| Param | Original file | Final file |
|---|---|---|
| Filename | modeM0/AS1P01_163T03_9000000186_00927cztM0_level2.evt | modeM0/AS1P01_163T03_9000000186_00927cztM0_level2_quad_clean.evt |
| Size (bytes) | 906,206,400 | 91,892,160 |
| Size | 864.2 MB | 87.6 MB |
| Events in quadrant A | 6,702,937 | 605,677 |
| Events in quadrant B | 7,126,930 | 609,589 |
| Events in quadrant C | 6,684,861 | 592,000 |
| Events in quadrant D | 6,549,341 | 575,292 |
| Mode SS | |||
|---|---|---|---|
| Quadrant | BADHDUFLAG | Total packets | Discarded packets |
| A | 0 | 118 | 0 |
| B | 0 | 118 | 0 |
| C | 0 | 118 | 0 |
| D | 0 | 118 | 0 |
| Mode M0 | |||
|---|---|---|---|
| Quadrant | BADHDUFLAG | Total packets | Discarded packets |
| A | 0 | 23964 | 0 |
| B | 0 | 25207 | 0 |
| C | 0 | 23894 | 0 |
| D | 0 | 23547 | 0 |
| Mode M9 | |||
|---|---|---|---|
| Quadrant | BADHDUFLAG | Total packets | Discarded packets |
| A | 0 | 12 | 0 |
| B | 0 | 12 | 0 |
| C | 0 | 12 | 0 |
| D | 0 | 12 | 0 |
| Quadrant | Total seconds | Saturated seconds | Saturation percentage |
|---|---|---|---|
| A | 5722 | 15 | 0.262146% |
| B | 5722 | 47 | 0.821391% |
| C | 5721 | 12 | 0.209754% |
| D | 5722 | 109 | 1.904928% |
Noise dominated data is calculated using 1-second bins in cleaned event files. If a bin has >2000 counts, and if more than 50% of those come from <1% of pixels, then it is considered to be noise-dominated and hence unusable.
| Quadrant | # 1 sec bins | Bins with >0 counts | Bins with >2000 counts | High rate bins dominated by noise | Noise dominated (total time) | Noise dominated (detector-on time) | Marked lightcurve |
|---|---|---|---|---|---|---|---|
| A | 6977 | 5723 | 204 | 204 | 2.92% | 3.56% | 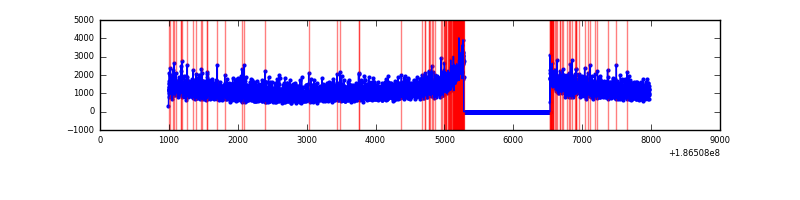 |
| B | 6977 | 5723 | 274 | 274 | 3.93% | 4.79% |  |
| C | 6976 | 5722 | 180 | 180 | 2.58% | 3.15% | 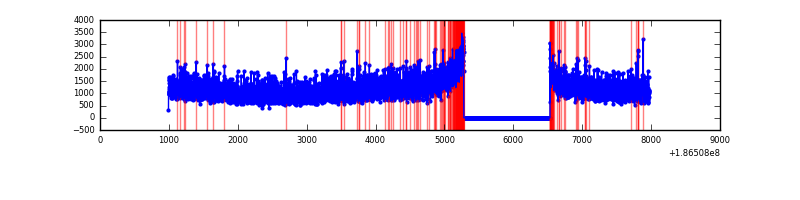 |
| D | 6977 | 5723 | 321 | 321 | 4.60% | 5.61% | 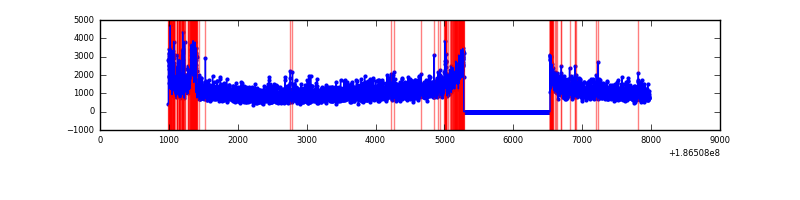 |
Top three noisy pixels from each quadrant. If the there are fewer than three noisy pixels in the level2.evt file, extra rows are filled as -1
| Pixel properties | Quadrant properties | ||||||
|---|---|---|---|---|---|---|---|
| Quadrant | DetID | PixID | Counts | Sigma | Mean | Median | Sigma |
| A | 15 | 233 | 11280 | 22.83 | 1739 | 1754 | 417.2 |
| A | 14 | 170 | 11088 | 22.37 | 1739 | 1754 | 417.2 |
| A | 11 | 79 | 6652 | 11.74 | 1739 | 1754 | 417.2 |
| B | 8 | 38 | 89658 | 207.08 | 1819 | 1827 | 424.1 |
| B | 0 | 230 | 22268 | 48.19 | 1819 | 1827 | 424.1 |
| B | 5 | 191 | 20309 | 43.57 | 1819 | 1827 | 424.1 |
| C | 15 | 241 | 229313 | 508.7 | 1622 | 1675 | 447.5 |
| C | 9 | 144 | 78340 | 171.32 | 1622 | 1675 | 447.5 |
| C | 3 | 111 | 22104 | 45.65 | 1622 | 1675 | 447.5 |
| D | 12 | 188 | 463841 | 962.15 | 1554 | 1605 | 480.4 |
| D | 1 | 4 | 119263 | 244.91 | 1554 | 1605 | 480.4 |
| D | 13 | 73 | 69452 | 141.22 | 1554 | 1605 | 480.4 |
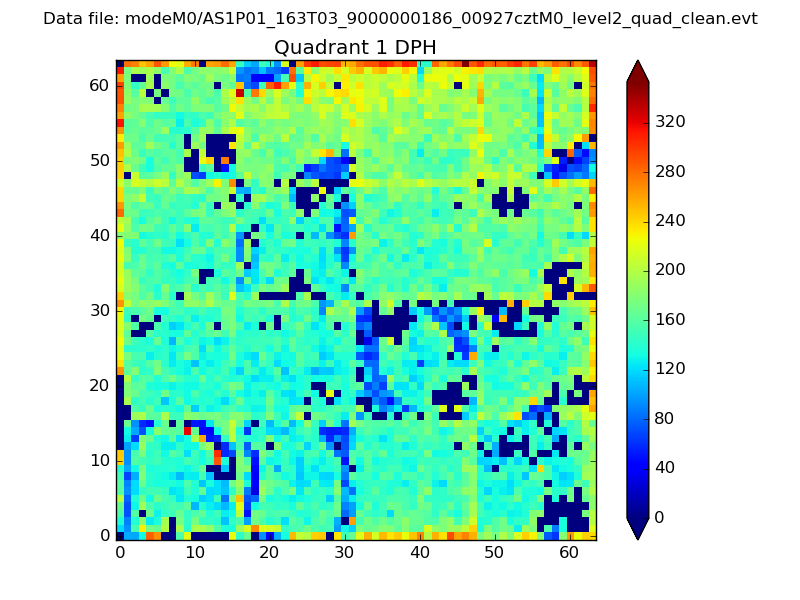
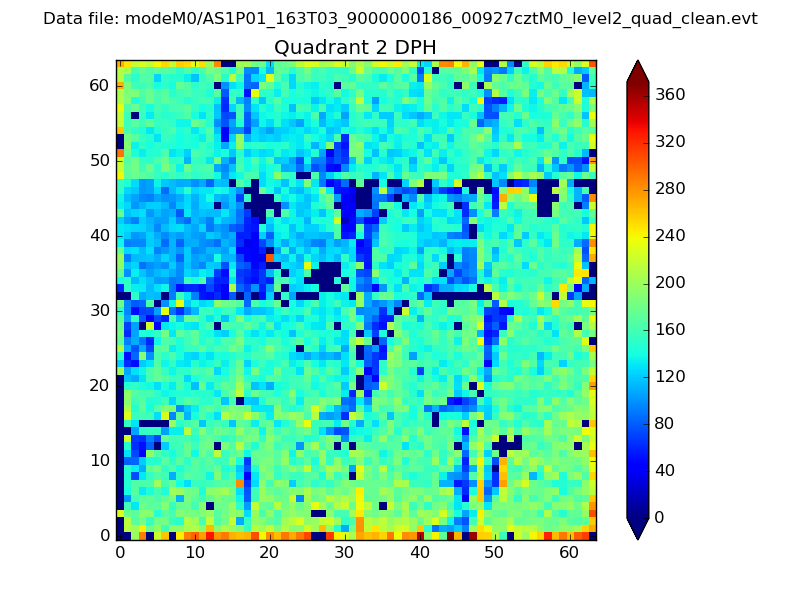
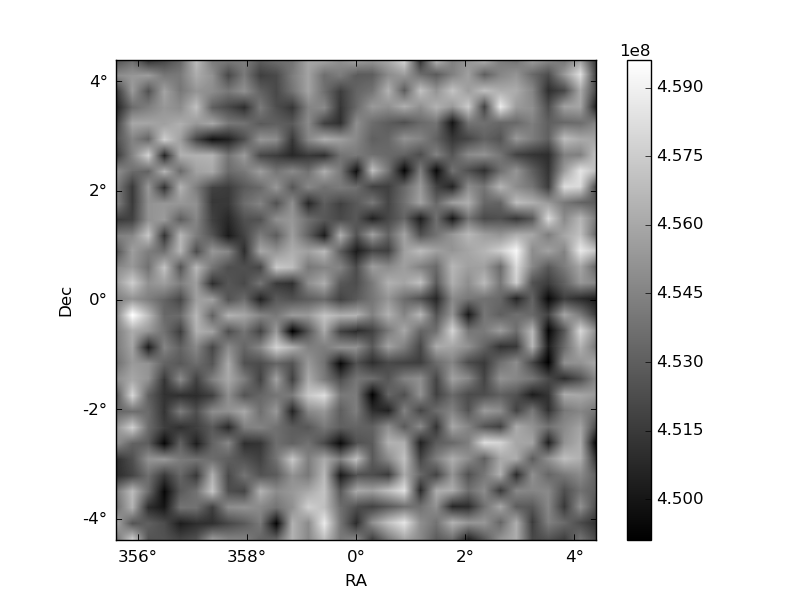
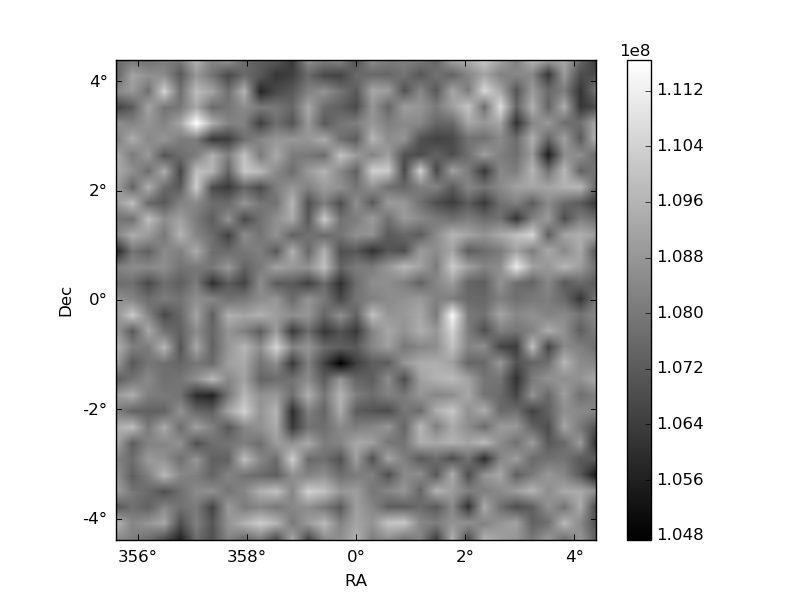
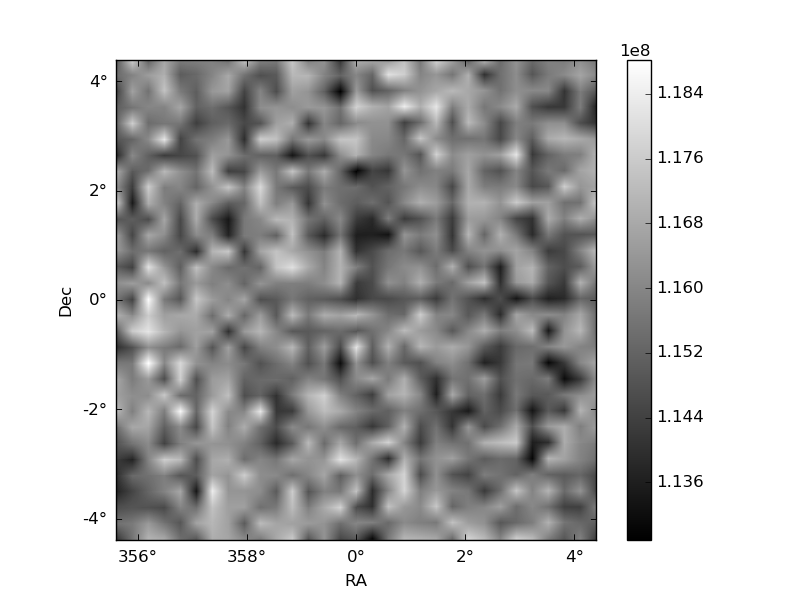
Histogram calculated using DETX and DETY for each event in the final _common_clean file
| Quadrant A | 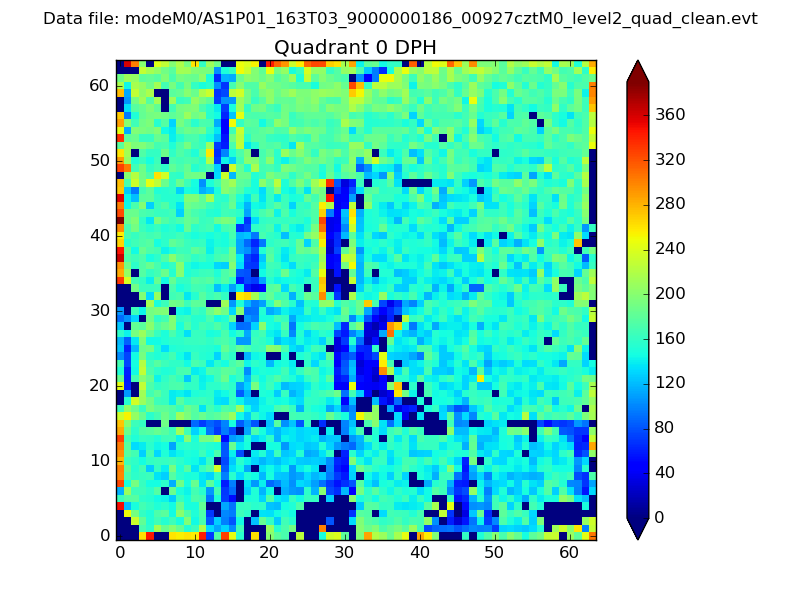 |
 |
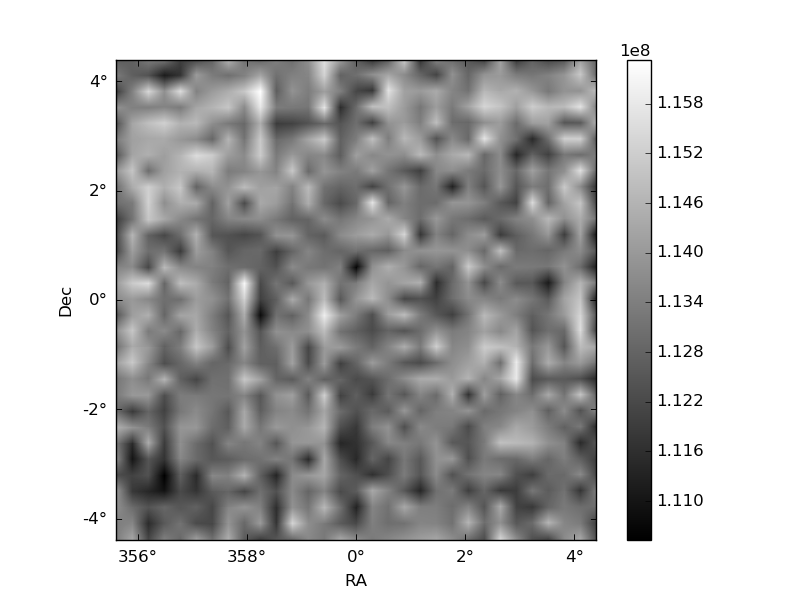
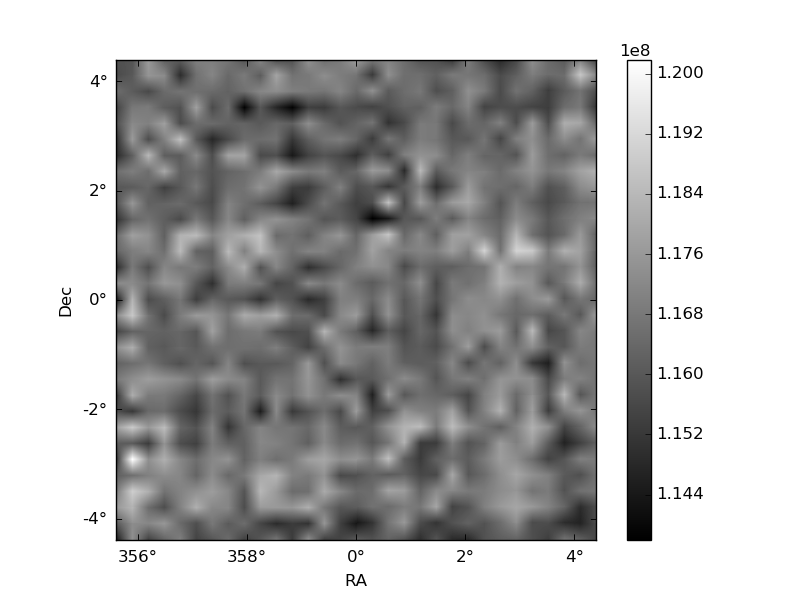
Quadrant B |
|---|---|---|---|
| Quadrant D | 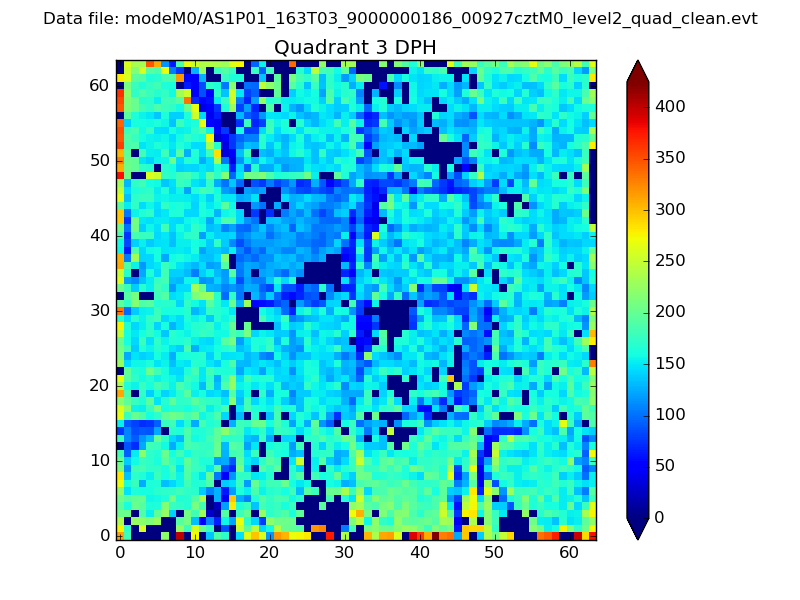 |
 |
Quadrant C |
| Plot type | Count rate plots | Images |
|---|---|---|
| Comparison with Poisson distribution Blue bars denote a histogram of data divided into 1 sec bins. Red curve is a Poisson curve with rate = median count rate of data. |
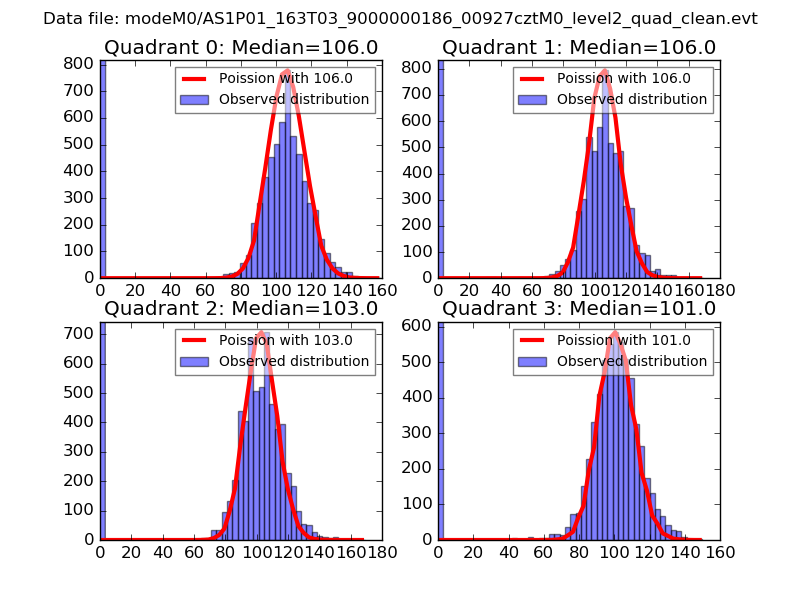 |
 |
| Quadrant-wise count rates Data is divided into 100 sec bins |
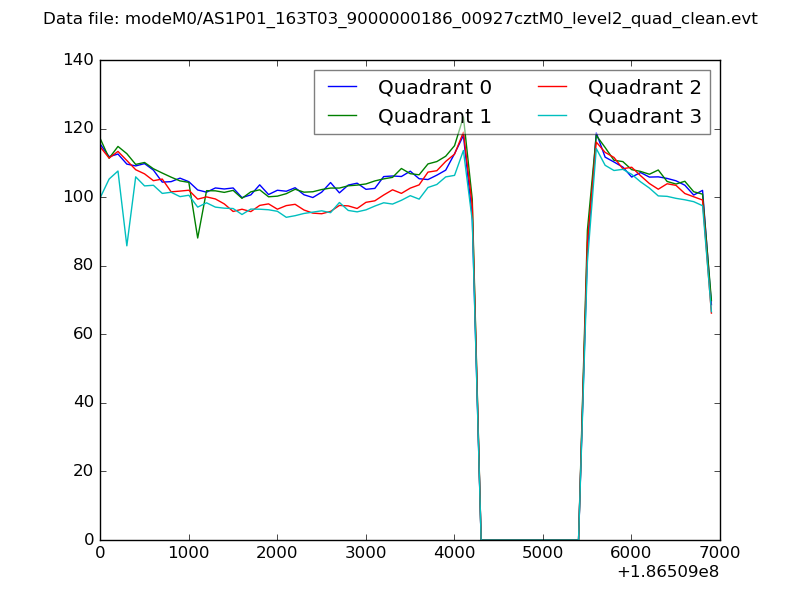 |
|
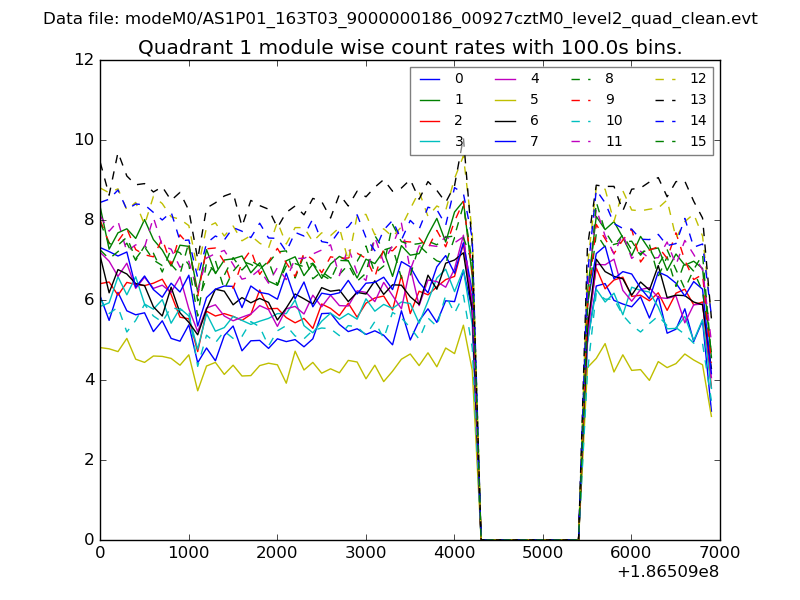
| Module-wise count rates for Quadrant A Data is divided into 100 sec bins |
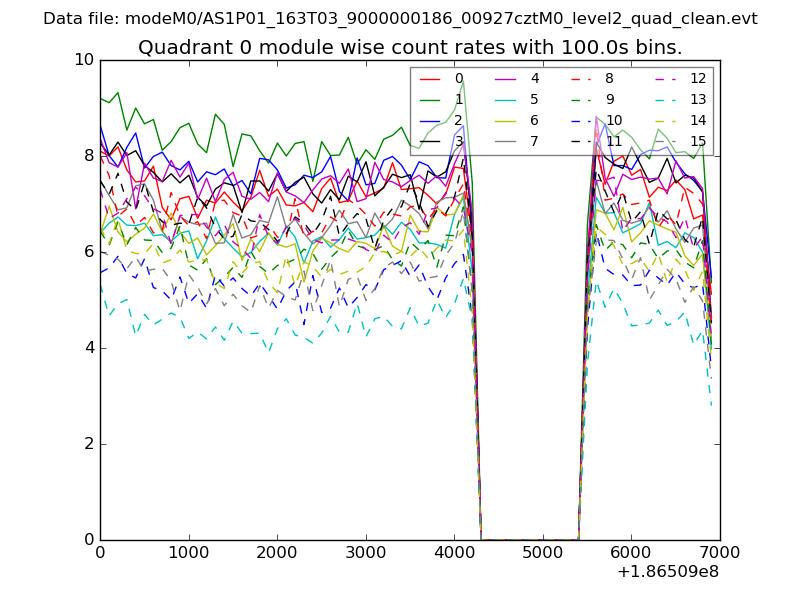 |
 |
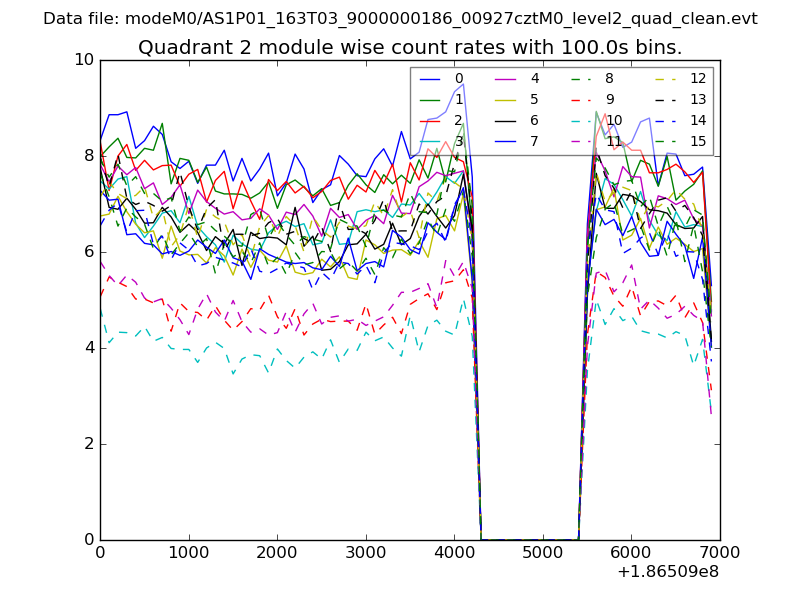
| Module-wise count rates for Quadrant B Data is divided into 100 sec bins |
 |
 |
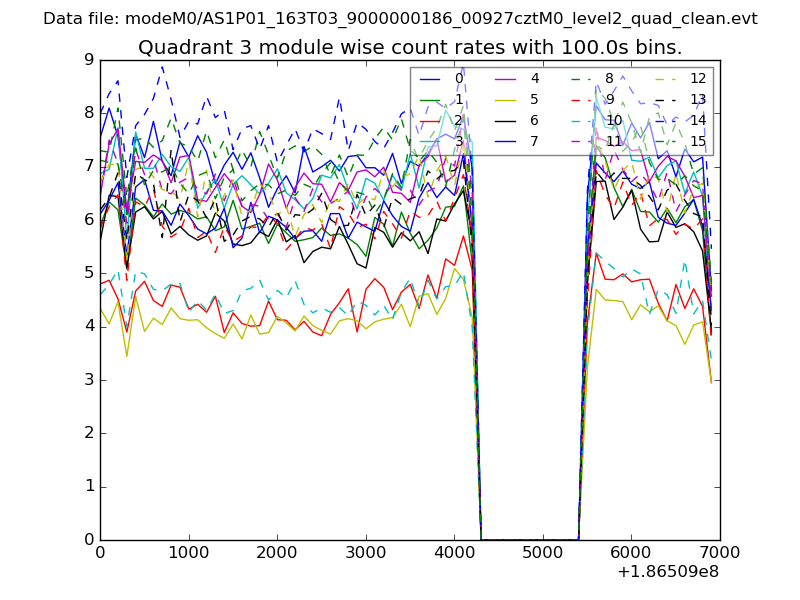
| Module-wise count rates for Quadrant C Data is divided into 100 sec bins |
 |
 |
| Module-wise count rates for Quadrant D Data is divided into 100 sec bins |
 |
 |
| Parameter | Plot |
|---|---|
| CZT HV Monitor | 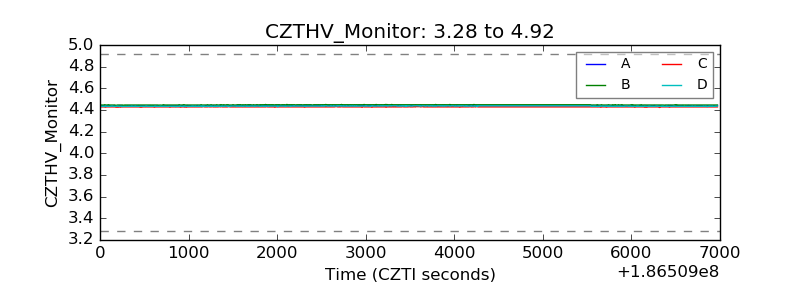 |
| D_VDD | 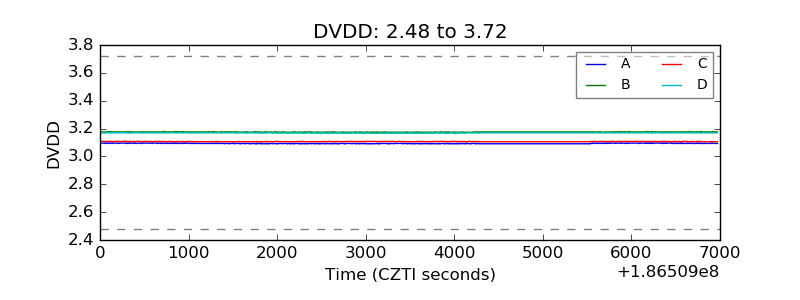 |
| Temperature 1 | 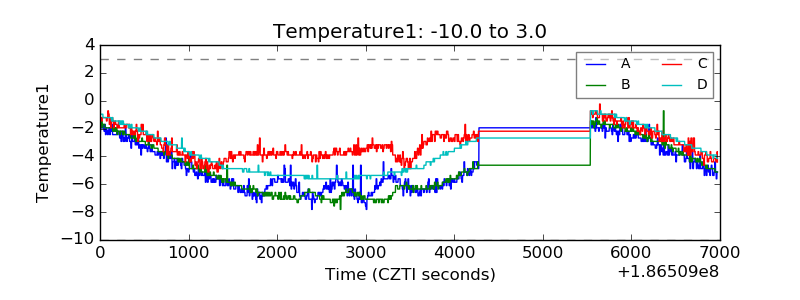 |
| Veto HV Monitor | 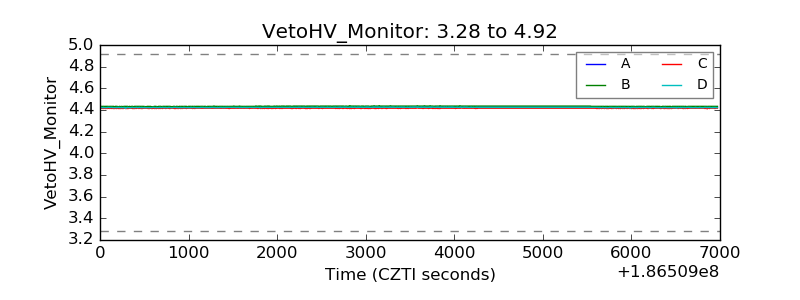 |
| Veto LLD |  |
| Alpha Counter | 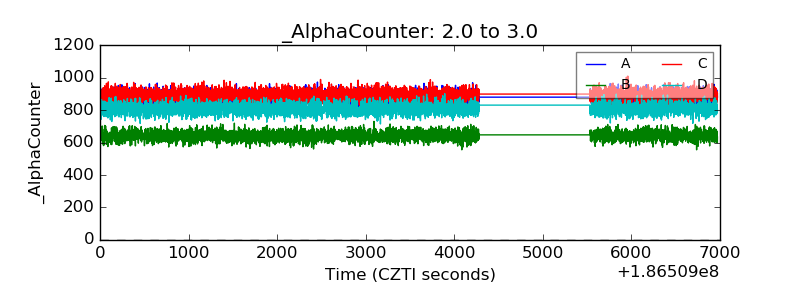 |
| _CPM_Rate | 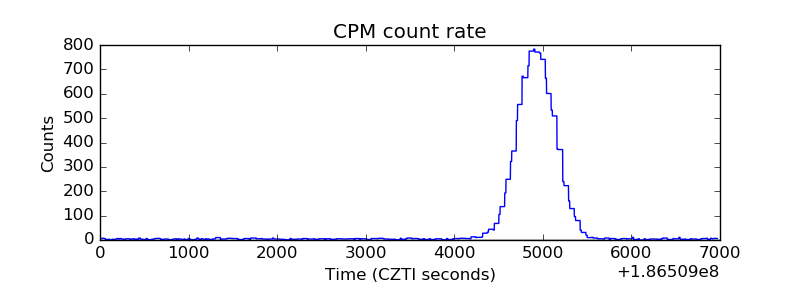 |
| CZT Counter | 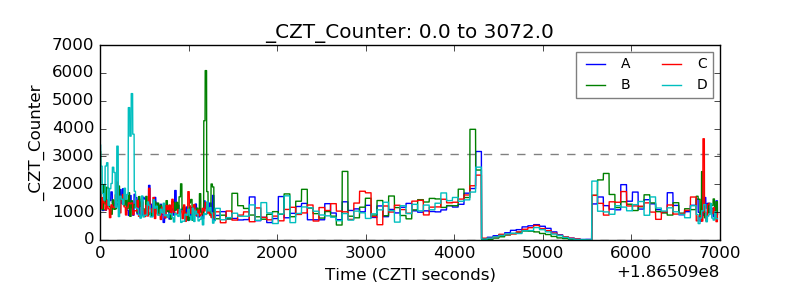 |
| +2.5 Volts monitor |  |
| +5 Volts monitor |  |
| _ROLL_ROT | 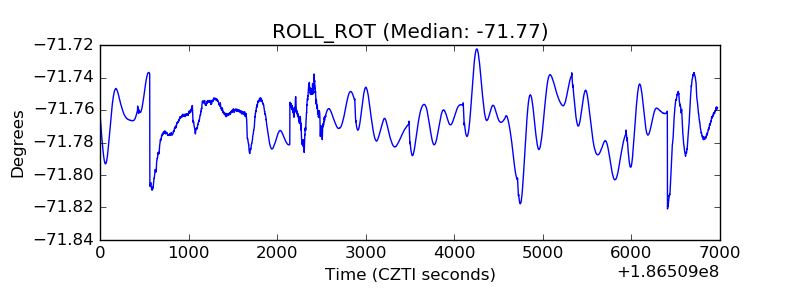 |
| _Roll_DEC | 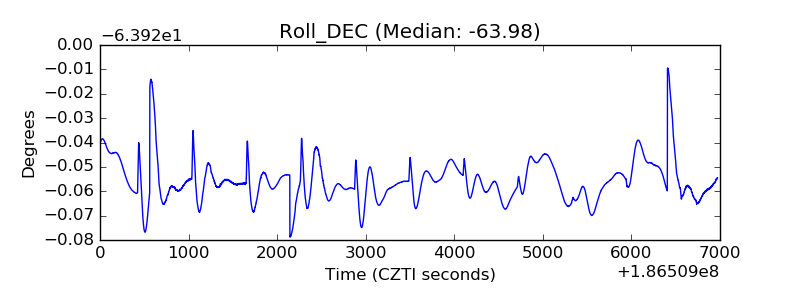 |
| _Roll_RA | 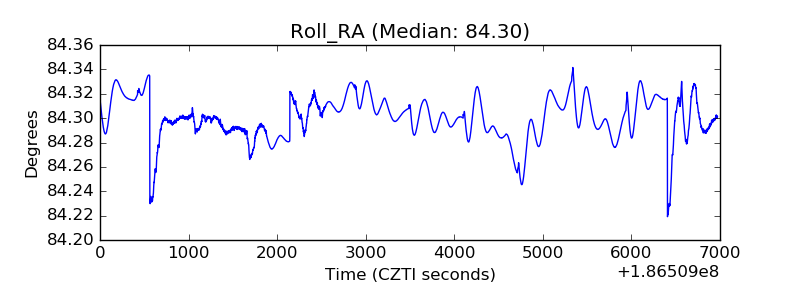 |
| Veto Counter | 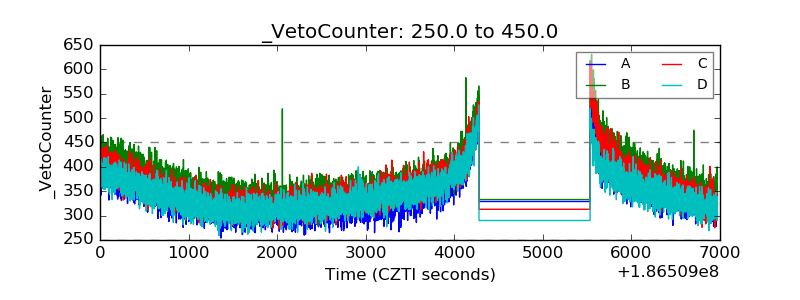 |