| Param | Original file | Final file |
|---|---|---|
| Filename | modeM0/AS1P01_163T03_9000000186_00928cztM0_level2.evt | modeM0/AS1P01_163T03_9000000186_00928cztM0_level2_quad_clean.evt |
| Size (bytes) | 1,003,340,160 | 94,590,720 |
| Size | 956.9 MB | 90.2 MB |
| Events in quadrant A | 7,690,118 | 612,405 |
| Events in quadrant B | 7,931,845 | 617,068 |
| Events in quadrant C | 7,556,618 | 598,181 |
| Events in quadrant D | 6,779,835 | 587,412 |
| Mode SS | |||
|---|---|---|---|
| Quadrant | BADHDUFLAG | Total packets | Discarded packets |
| A | 0 | 130 | 0 |
| B | 0 | 130 | 0 |
| C | 0 | 130 | 0 |
| D | 0 | 130 | 0 |
| Mode M0 | |||
|---|---|---|---|
| Quadrant | BADHDUFLAG | Total packets | Discarded packets |
| A | 0 | 27469 | 0 |
| B | 0 | 28119 | 0 |
| C | 0 | 27025 | 0 |
| D | 0 | 24764 | 0 |
| Mode M9 | |||
|---|---|---|---|
| Quadrant | BADHDUFLAG | Total packets | Discarded packets |
| A | 0 | 11 | 0 |
| B | 0 | 11 | 0 |
| C | 0 | 11 | 0 |
| D | 0 | 11 | 0 |
| Quadrant | Total seconds | Saturated seconds | Saturation percentage |
|---|---|---|---|
| A | 6448 | 13 | 0.201613% |
| B | 6447 | 9 | 0.139600% |
| C | 6447 | 9 | 0.139600% |
| D | 6447 | 2 | 0.031022% |
Noise dominated data is calculated using 1-second bins in cleaned event files. If a bin has >2000 counts, and if more than 50% of those come from <1% of pixels, then it is considered to be noise-dominated and hence unusable.
| Quadrant | # 1 sec bins | Bins with >0 counts | Bins with >2000 counts | High rate bins dominated by noise | Noise dominated (total time) | Noise dominated (detector-on time) | Marked lightcurve |
|---|---|---|---|---|---|---|---|
| A | 7523 | 6449 | 261 | 261 | 3.47% | 4.05% | 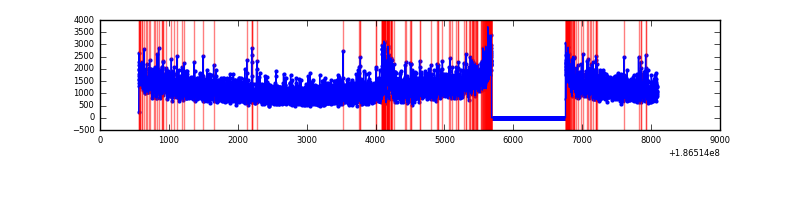 |
| B | 7522 | 6448 | 249 | 249 | 3.31% | 3.86% | 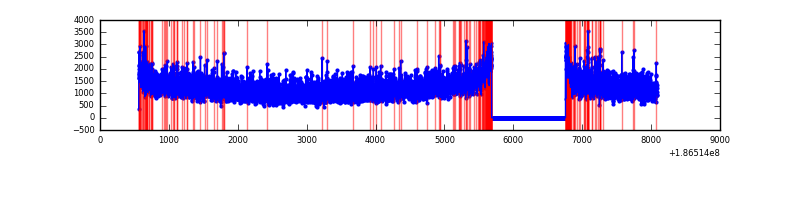 |
| C | 7522 | 6448 | 169 | 169 | 2.25% | 2.62% | 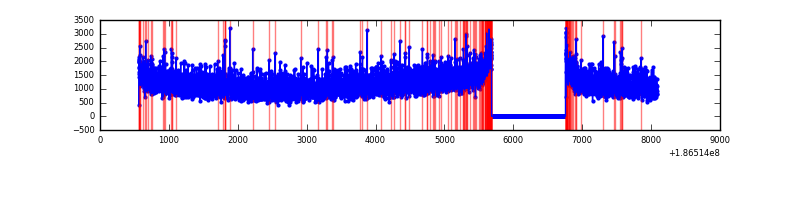 |
| D | 7522 | 6448 | 102 | 102 | 1.36% | 1.58% | 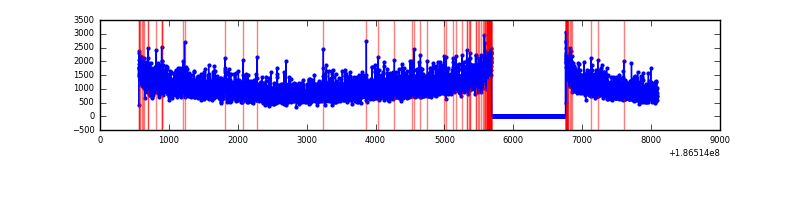 |
Top three noisy pixels from each quadrant. If the there are fewer than three noisy pixels in the level2.evt file, extra rows are filled as -1
| Pixel properties | Quadrant properties | ||||||
|---|---|---|---|---|---|---|---|
| Quadrant | DetID | PixID | Counts | Sigma | Mean | Median | Sigma |
| A | 15 | 233 | 172100 | 362.25 | 1953 | 1972 | 469.6 |
| A | 14 | 170 | 18516 | 35.23 | 1953 | 1972 | 469.6 |
| A | 12 | 189 | 12439 | 22.29 | 1953 | 1972 | 469.6 |
| B | 5 | 191 | 47398 | 93.85 | 2054 | 2060 | 483.1 |
| B | 15 | 22 | 32864 | 63.77 | 2054 | 2060 | 483.1 |
| B | 7 | 221 | 9472 | 15.34 | 2054 | 2060 | 483.1 |
| C | 15 | 241 | 248562 | 483.51 | 1839 | 1899 | 510.2 |
| C | 9 | 144 | 85981 | 164.82 | 1839 | 1899 | 510.2 |
| C | 3 | 111 | 23430 | 42.2 | 1839 | 1899 | 510.2 |
| D | 1 | 4 | 97391 | 175.7 | 1759 | 1818 | 543.9 |
| D | 10 | 125 | 39412 | 69.11 | 1759 | 1818 | 543.9 |
| D | 12 | 188 | 17344 | 28.54 | 1759 | 1818 | 543.9 |
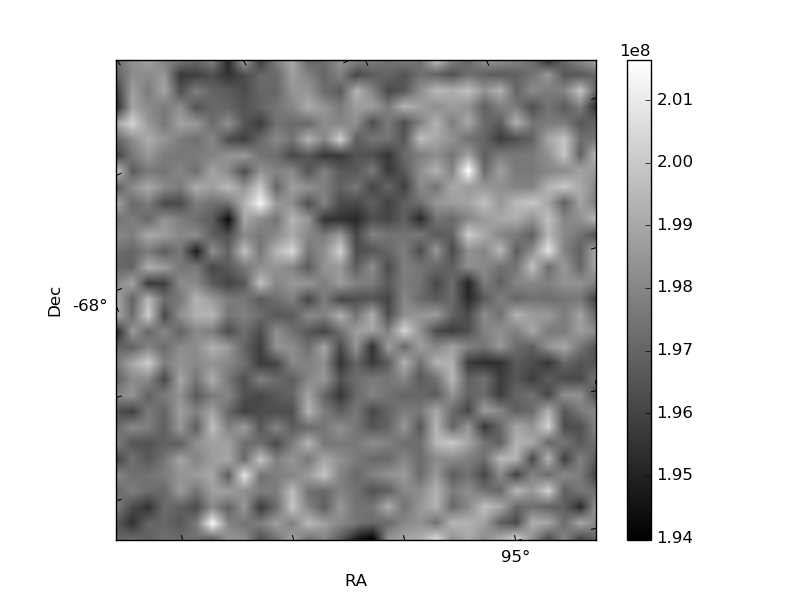
Histogram calculated using DETX and DETY for each event in the final _common_clean file
| Quadrant A | 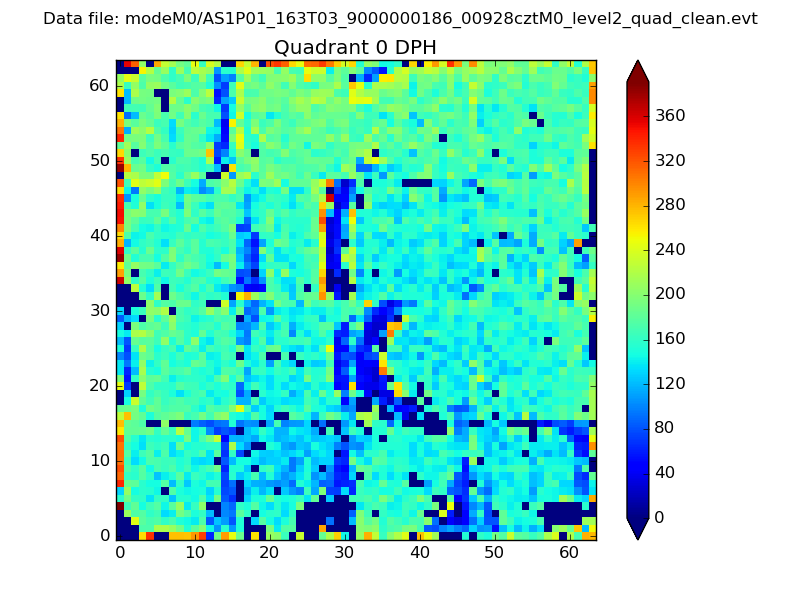 |
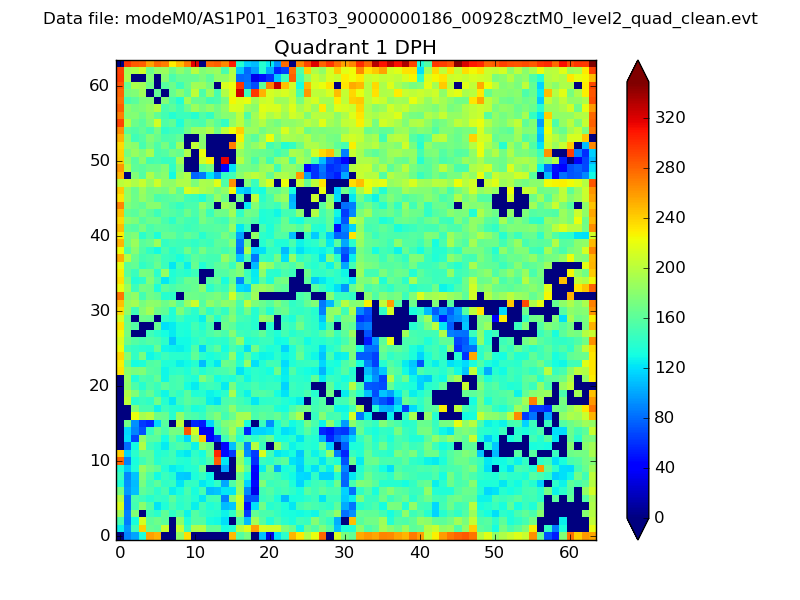 |
Quadrant B |
|---|---|---|---|
| Quadrant D |  |
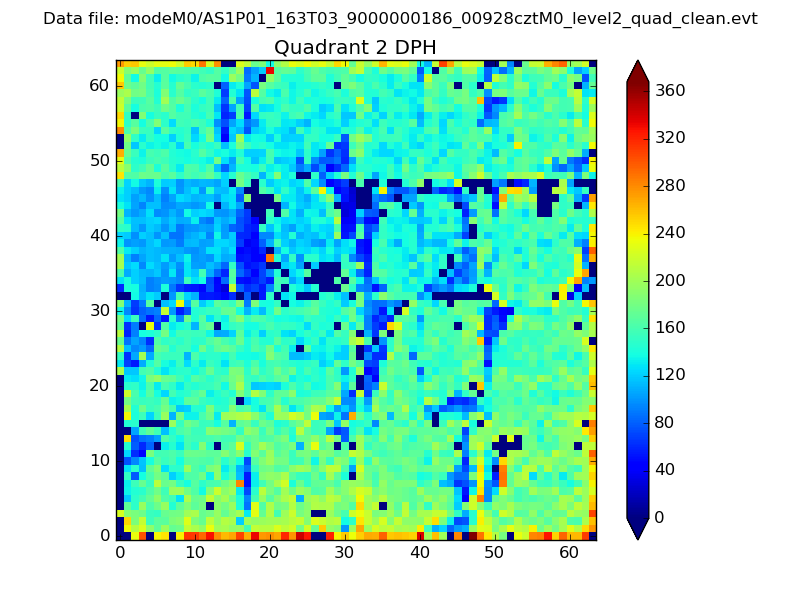 |
Quadrant C |
| Plot type | Count rate plots | Images |
|---|---|---|
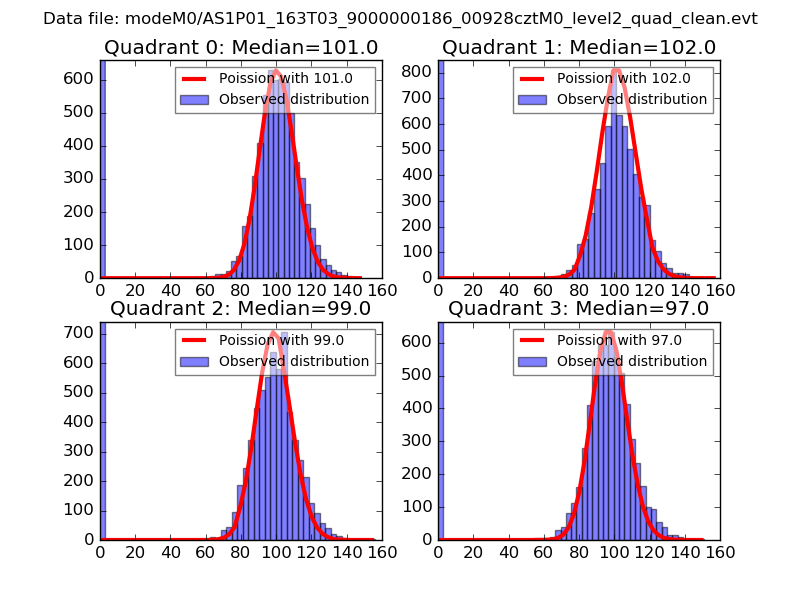
| Comparison with Poisson distribution Blue bars denote a histogram of data divided into 1 sec bins. Red curve is a Poisson curve with rate = median count rate of data. |
 |
 |
| Quadrant-wise count rates Data is divided into 100 sec bins |
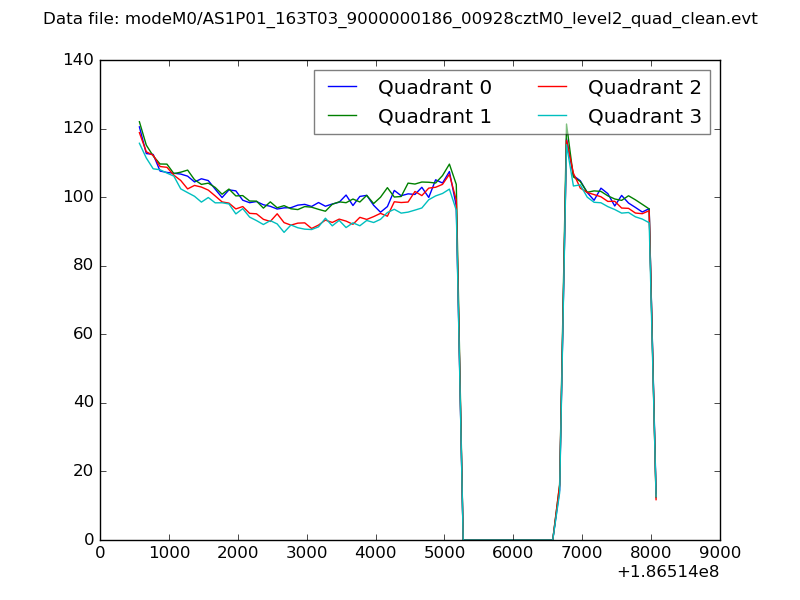 |
|
| Module-wise count rates for Quadrant A Data is divided into 100 sec bins |
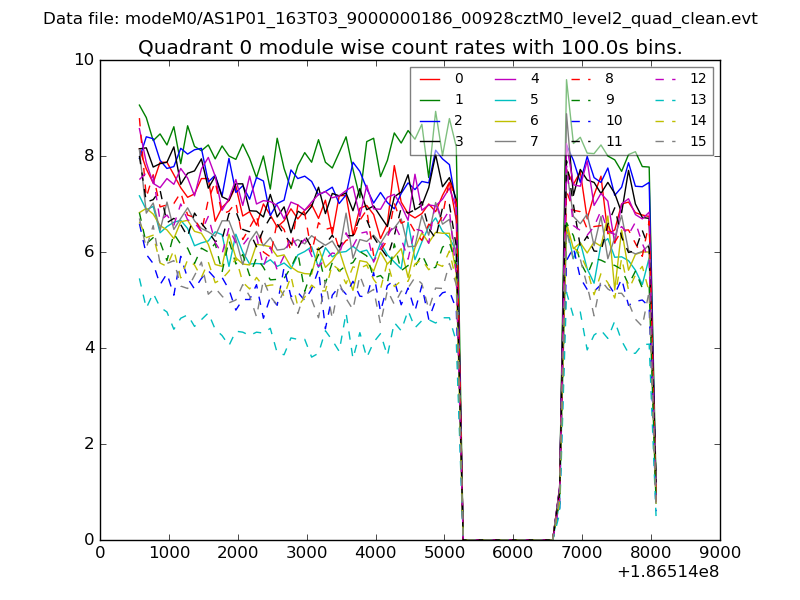 |
 |
| Module-wise count rates for Quadrant B Data is divided into 100 sec bins |
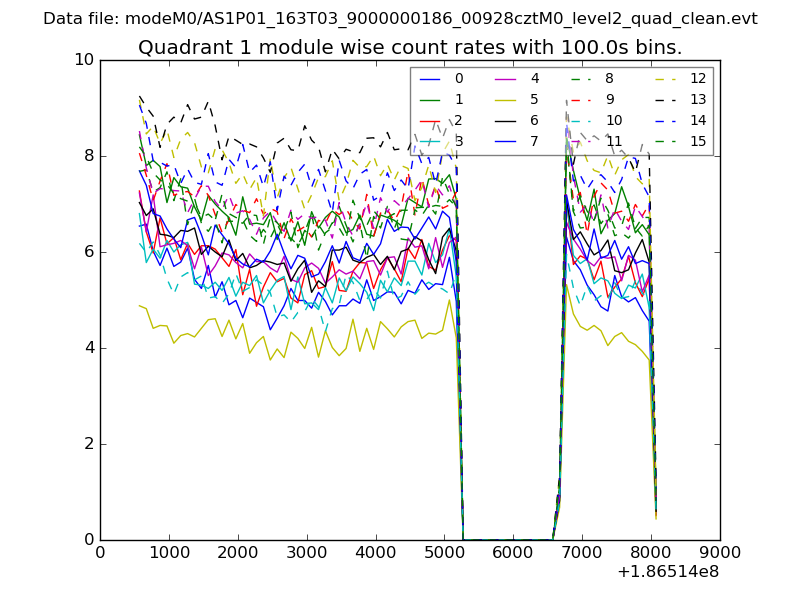 |
 |
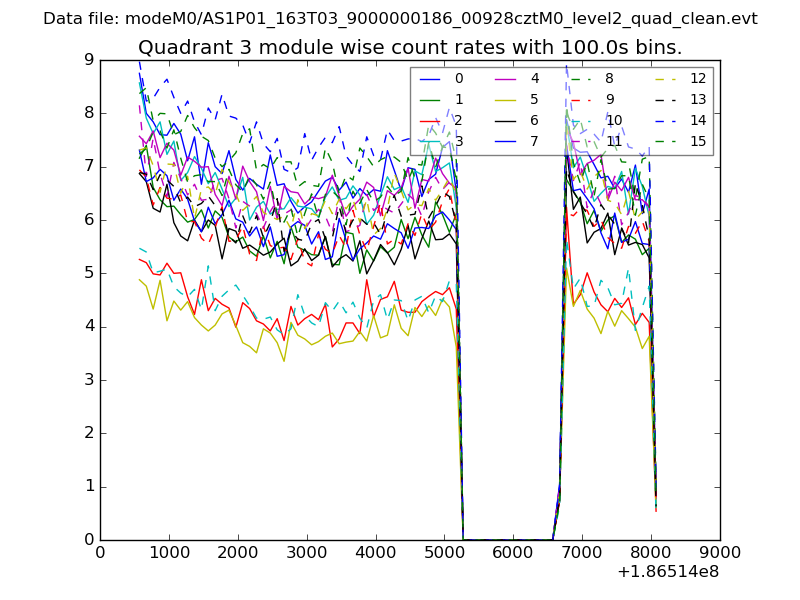
| Module-wise count rates for Quadrant C Data is divided into 100 sec bins |
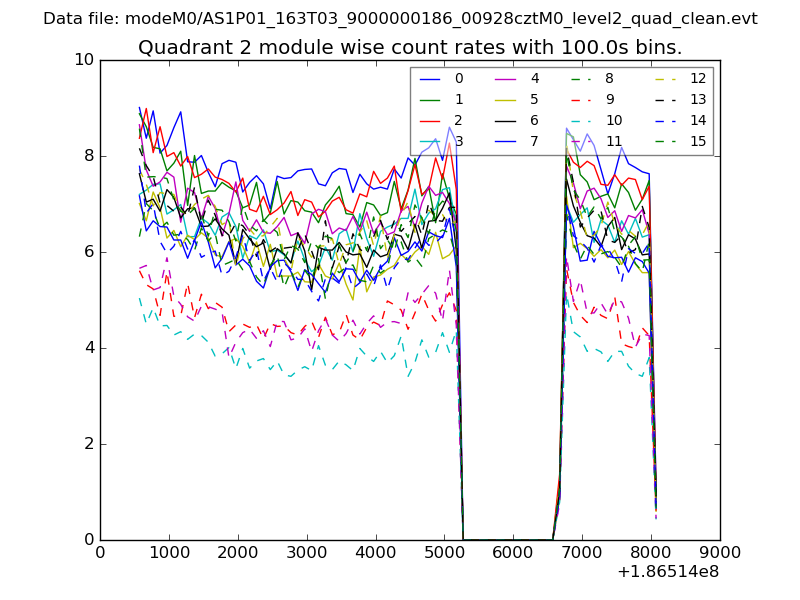 |
 |
| Module-wise count rates for Quadrant D Data is divided into 100 sec bins |
 |
 |
| Parameter | Plot |
|---|---|
| CZT HV Monitor | 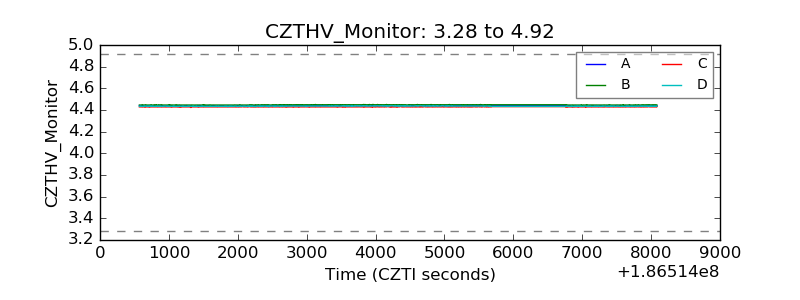 |
| D_VDD | 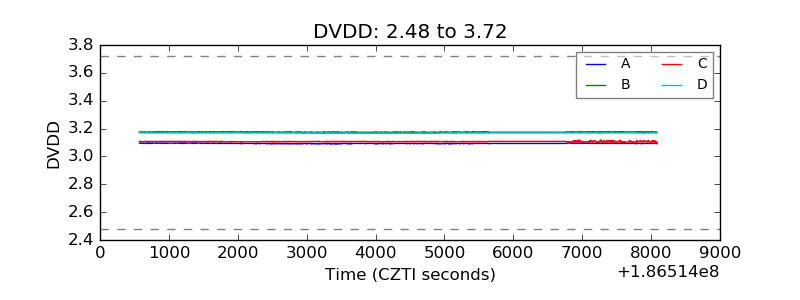 |
| Temperature 1 | 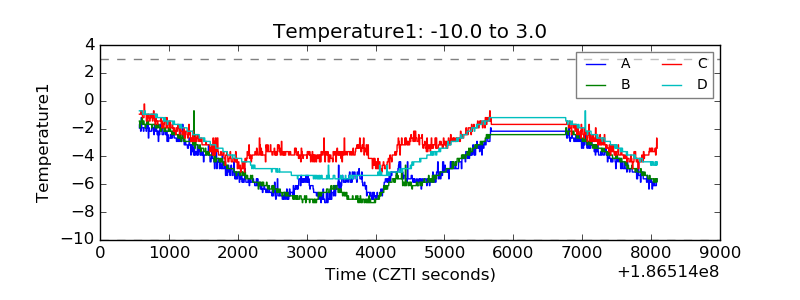 |
| Veto HV Monitor | 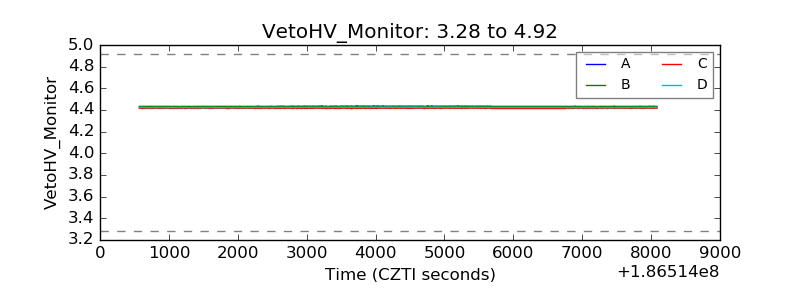 |
| Veto LLD | 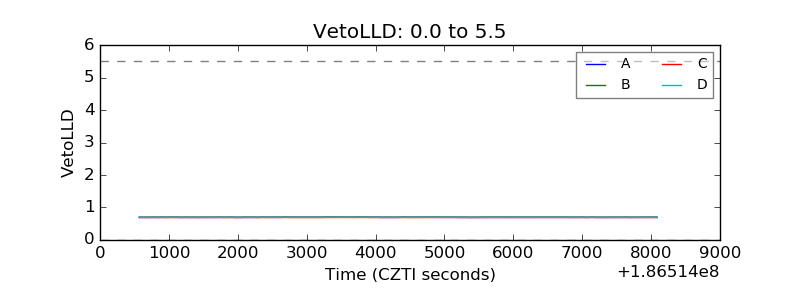 |
| Alpha Counter | 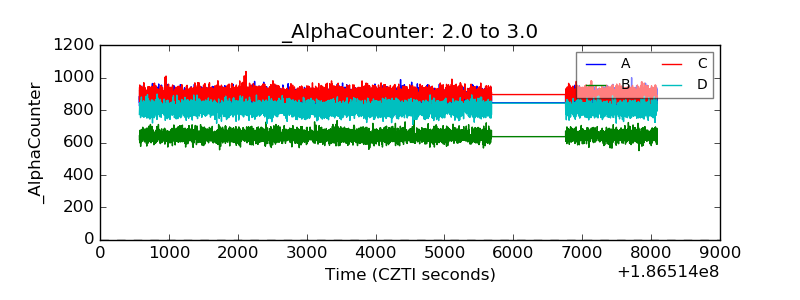 |
| _CPM_Rate | 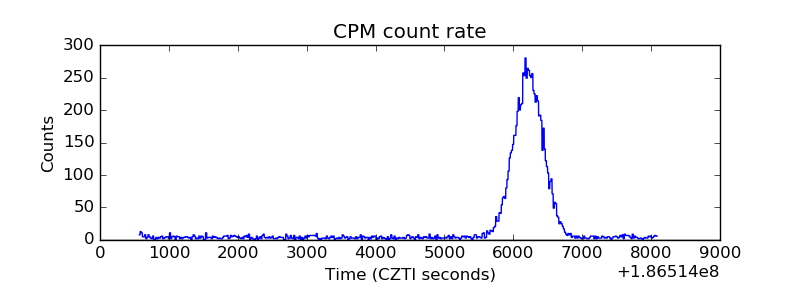 |
| CZT Counter |  |
| +2.5 Volts monitor |  |
| +5 Volts monitor | 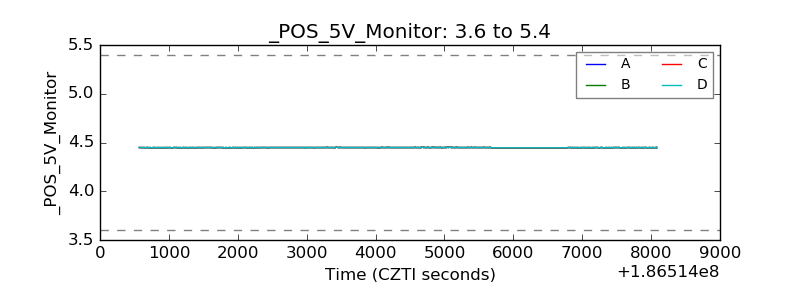 |
| _ROLL_ROT | 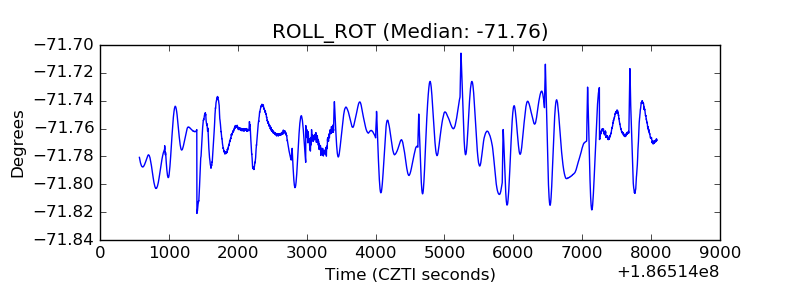 |
| _Roll_DEC | 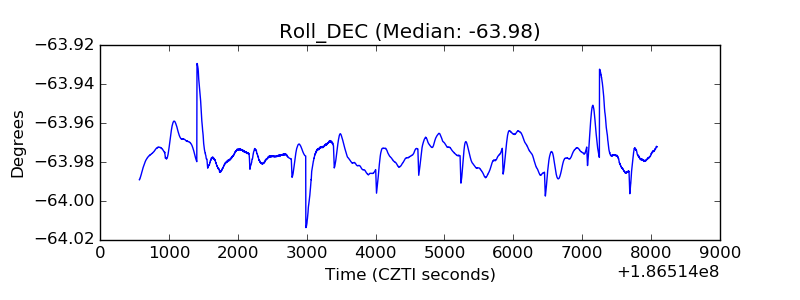 |
| _Roll_RA |  |
| Veto Counter | 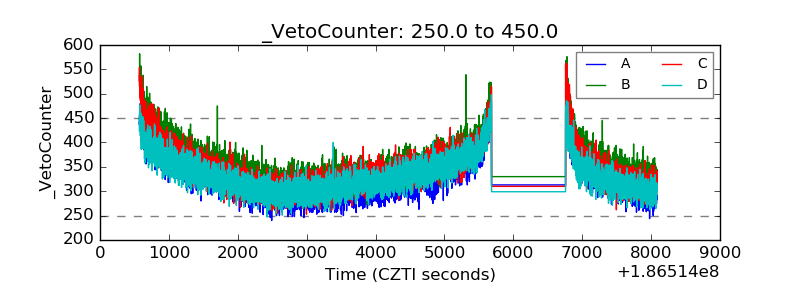 |