| Param | Original file | Final file |
|---|---|---|
| Filename | modeM0/AS1P01_163T03_9000000186_00929cztM0_level2.evt | modeM0/AS1P01_163T03_9000000186_00929cztM0_level2_quad_clean.evt |
| Size (bytes) | 1,134,290,880 | 91,722,240 |
| Size | 1.1 GB | 87.5 MB |
| Events in quadrant A | 8,393,215 | 585,490 |
| Events in quadrant B | 8,547,438 | 588,320 |
| Events in quadrant C | 9,626,703 | 564,730 |
| Events in quadrant D | 7,330,161 | 561,146 |
| Mode SS | |||
|---|---|---|---|
| Quadrant | BADHDUFLAG | Total packets | Discarded packets |
| A | 0 | 138 | 0 |
| B | 0 | 138 | 0 |
| C | 0 | 138 | 0 |
| D | 0 | 138 | 0 |
| Mode M0 | |||
|---|---|---|---|
| Quadrant | BADHDUFLAG | Total packets | Discarded packets |
| A | 0 | 29789 | 0 |
| B | 0 | 30258 | 0 |
| C | 0 | 33562 | 0 |
| D | 0 | 26706 | 0 |
| Mode M9 | |||
|---|---|---|---|
| Quadrant | BADHDUFLAG | Total packets | Discarded packets |
| A | 0 | 10 | 0 |
| B | 0 | 10 | 0 |
| C | 0 | 10 | 0 |
| D | 0 | 10 | 0 |
| Quadrant | Total seconds | Saturated seconds | Saturation percentage |
|---|---|---|---|
| A | 6863 | 17 | 0.247705% |
| B | 6863 | 31 | 0.451698% |
| C | 6863 | 636 | 9.267084% |
| D | 6862 | 15 | 0.218595% |
Noise dominated data is calculated using 1-second bins in cleaned event files. If a bin has >2000 counts, and if more than 50% of those come from <1% of pixels, then it is considered to be noise-dominated and hence unusable.
| Quadrant | # 1 sec bins | Bins with >0 counts | Bins with >2000 counts | High rate bins dominated by noise | Noise dominated (total time) | Noise dominated (detector-on time) | Marked lightcurve |
|---|---|---|---|---|---|---|---|
| A | 7563 | 6864 | 348 | 348 | 4.60% | 5.07% | 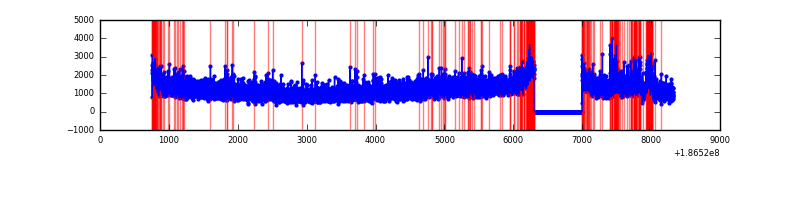 |
| B | 7563 | 6864 | 330 | 330 | 4.36% | 4.81% | 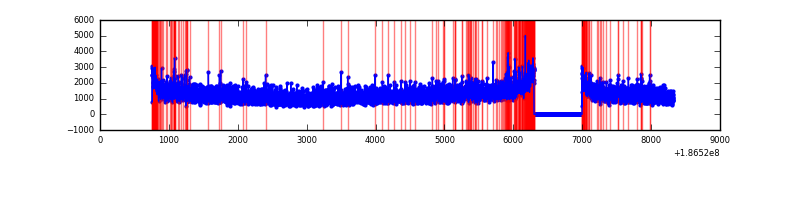 |
| C | 7563 | 6864 | 1101 | 1101 | 14.56% | 16.04% | 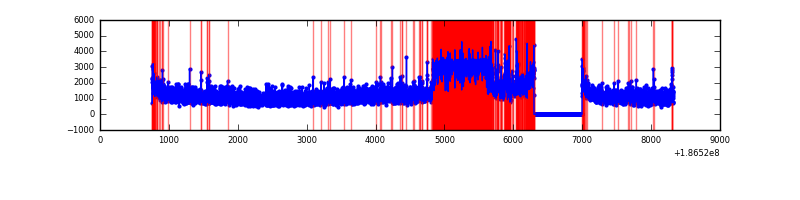 |
| D | 7562 | 6863 | 152 | 152 | 2.01% | 2.21% | 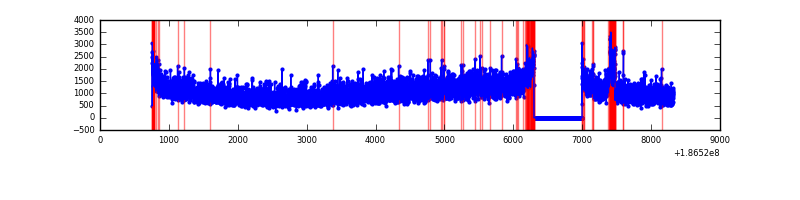 |
Top three noisy pixels from each quadrant. If the there are fewer than three noisy pixels in the level2.evt file, extra rows are filled as -1
| Pixel properties | Quadrant properties | ||||||
|---|---|---|---|---|---|---|---|
| Quadrant | DetID | PixID | Counts | Sigma | Mean | Median | Sigma |
| A | 14 | 170 | 342766 | 680.04 | 2081 | 2095 | 501.0 |
| A | 15 | 233 | 55076 | 105.76 | 2081 | 2095 | 501.0 |
| A | 12 | 189 | 10913 | 17.6 | 2081 | 2095 | 501.0 |
| B | 7 | 221 | 86022 | 161.87 | 2202 | 2210 | 517.8 |
| B | 5 | 191 | 38575 | 70.24 | 2202 | 2210 | 517.8 |
| B | 5 | 249 | 15470 | 25.61 | 2202 | 2210 | 517.8 |
| C | 9 | 83 | 1774225 | 3348.38 | 1909 | 1974 | 529.3 |
| C | 15 | 241 | 255347 | 478.71 | 1909 | 1974 | 529.3 |
| C | 9 | 144 | 57583 | 105.06 | 1909 | 1974 | 529.3 |
| D | 1 | 4 | 126513 | 213.96 | 1880 | 1947 | 582.2 |
| D | 13 | 171 | 121973 | 206.16 | 1880 | 1947 | 582.2 |
| D | 10 | 125 | 18128 | 27.79 | 1880 | 1947 | 582.2 |
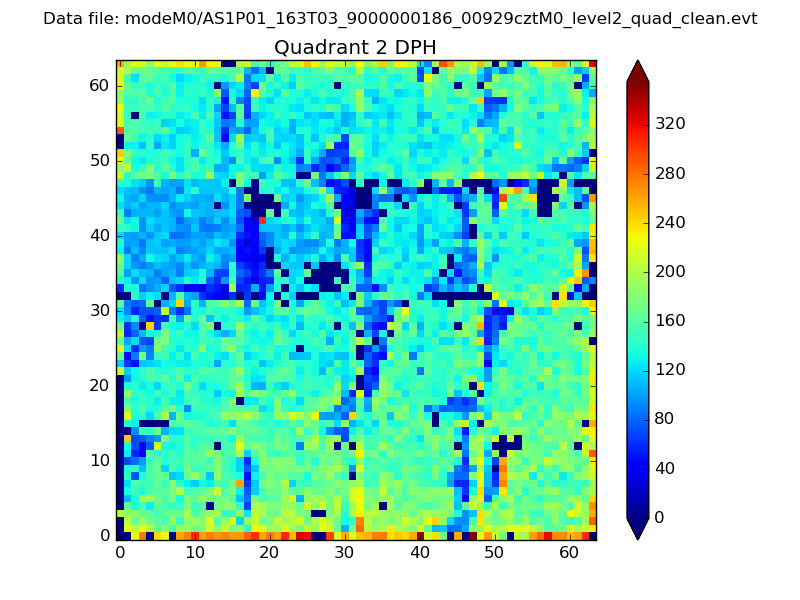
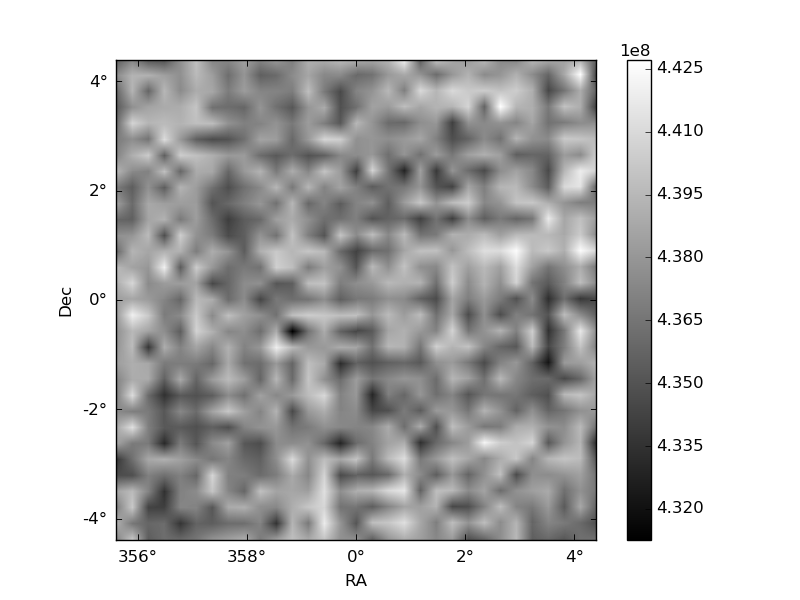
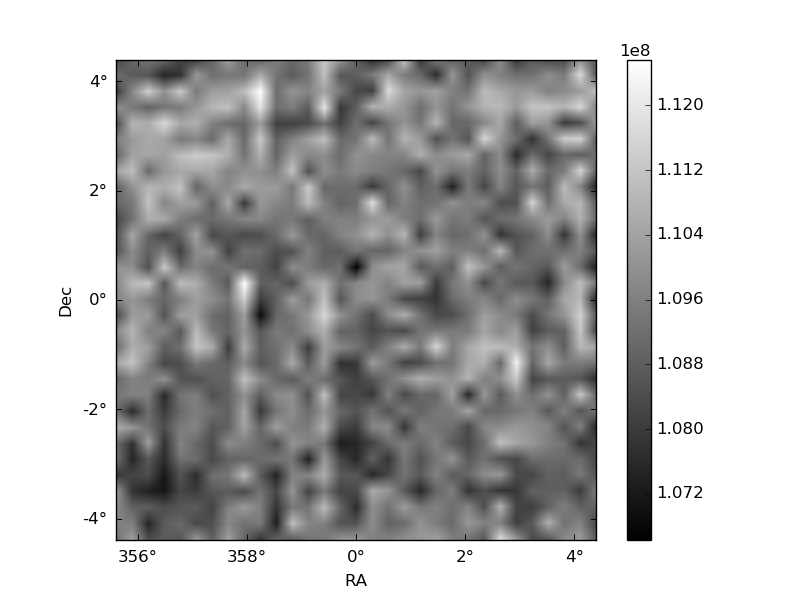
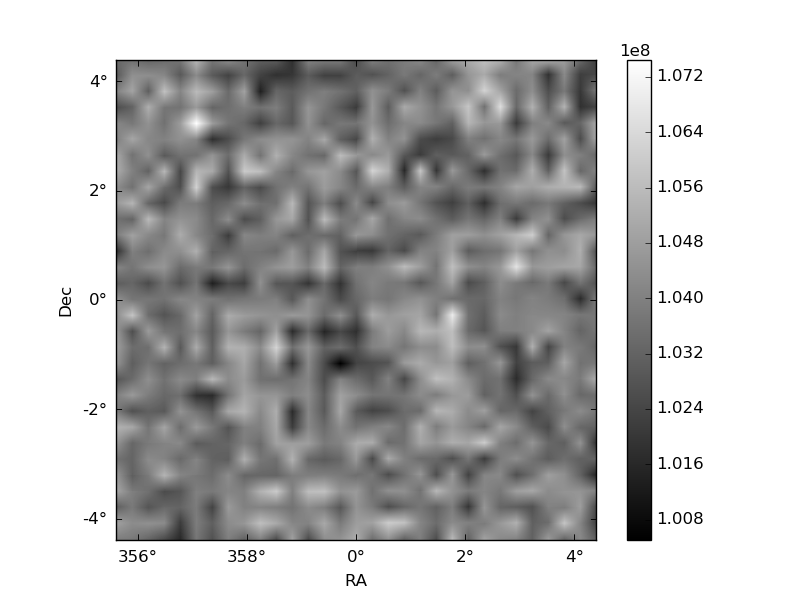
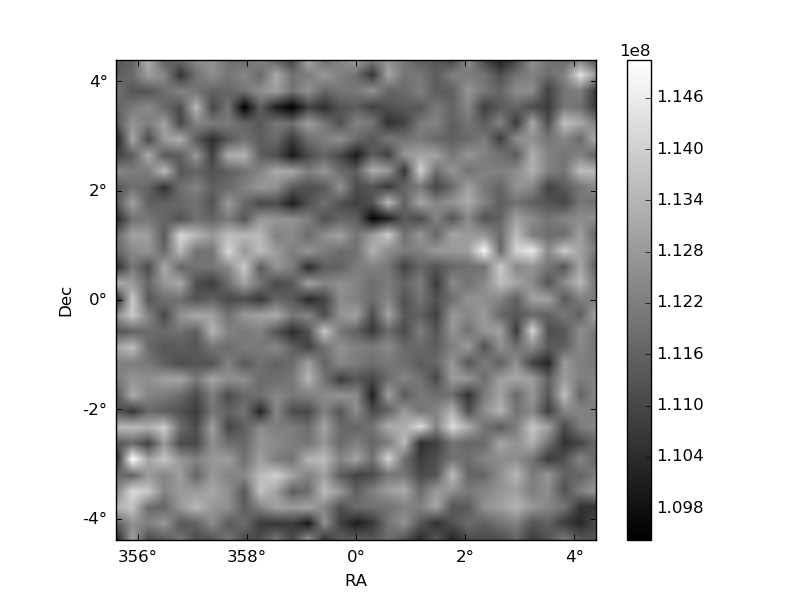
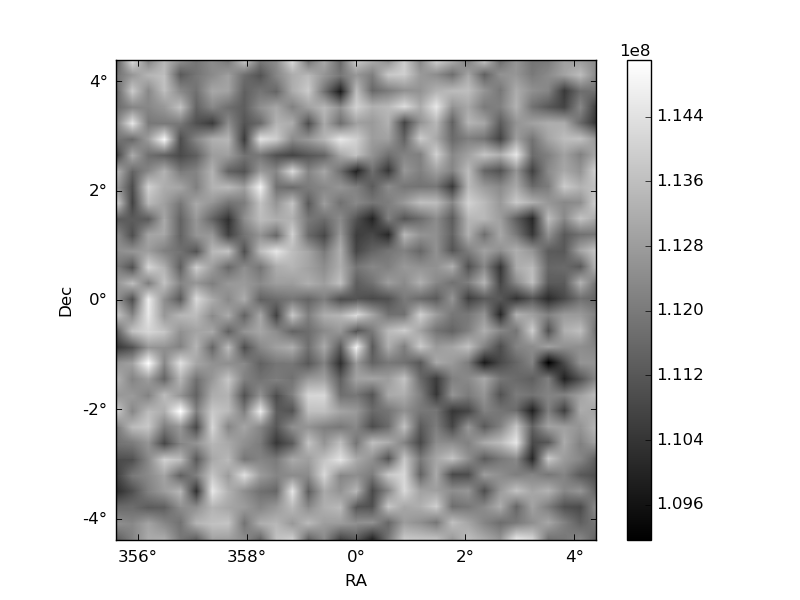
Histogram calculated using DETX and DETY for each event in the final _common_clean file
| Quadrant A | 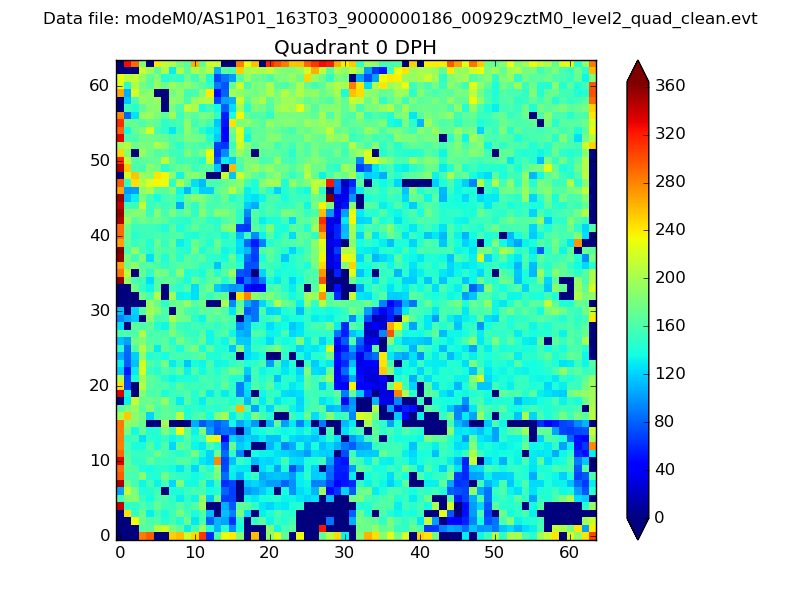 |
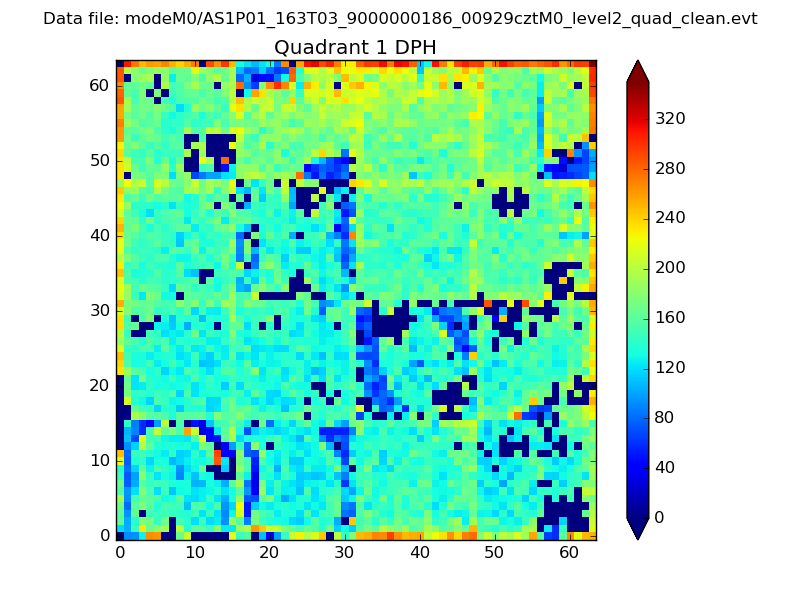 |
Quadrant B |
|---|---|---|---|
| Quadrant D | 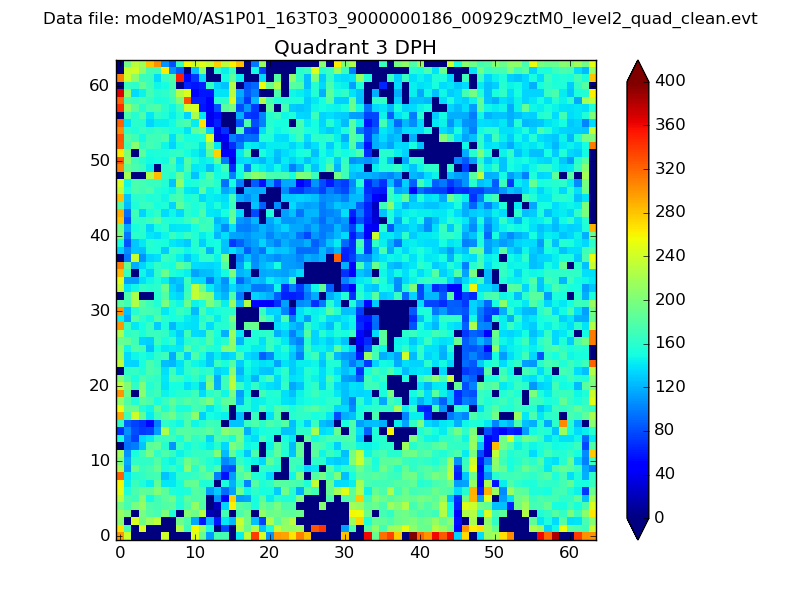 |
 |
Quadrant C |
| Plot type | Count rate plots | Images |
|---|---|---|
| Comparison with Poisson distribution Blue bars denote a histogram of data divided into 1 sec bins. Red curve is a Poisson curve with rate = median count rate of data. |
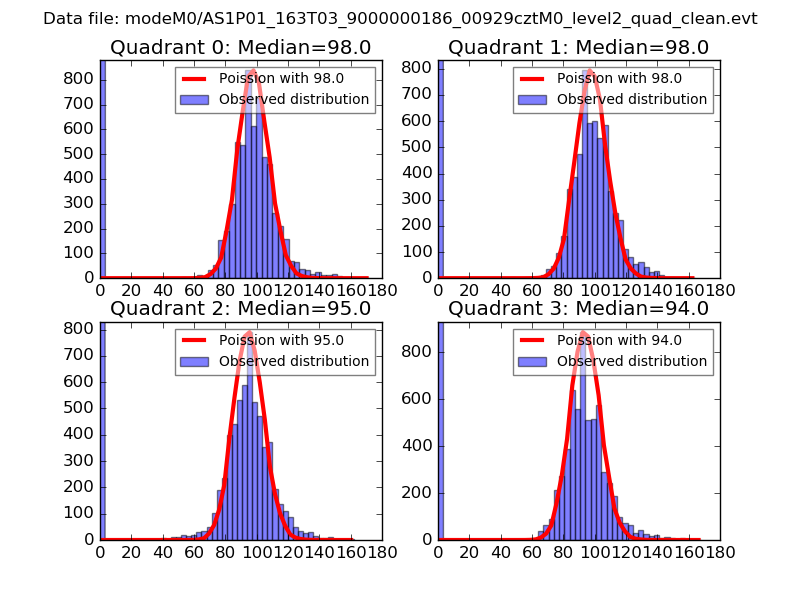 |
 |
| Quadrant-wise count rates Data is divided into 100 sec bins |
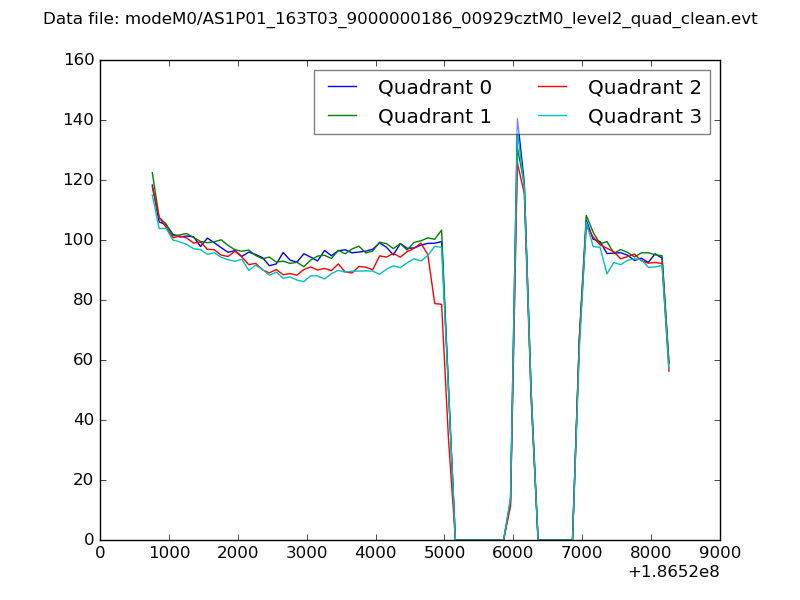 |
|
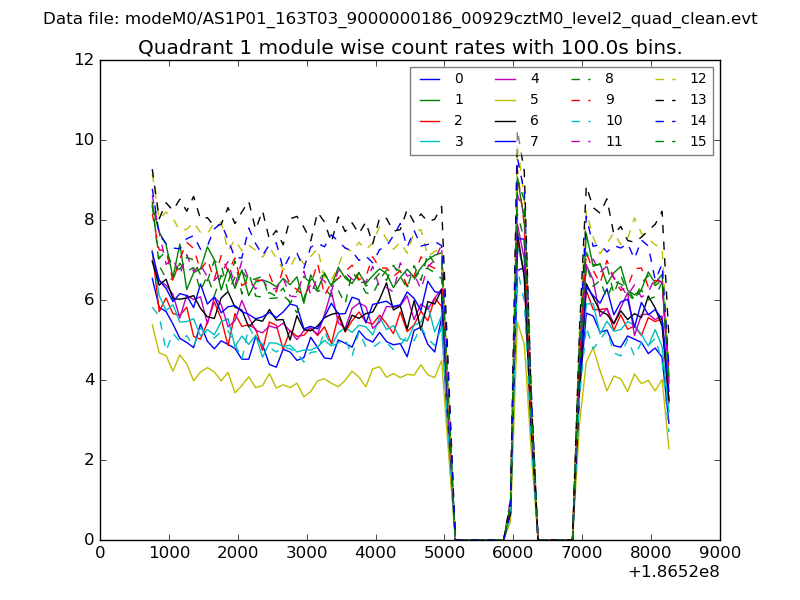
| Module-wise count rates for Quadrant A Data is divided into 100 sec bins |
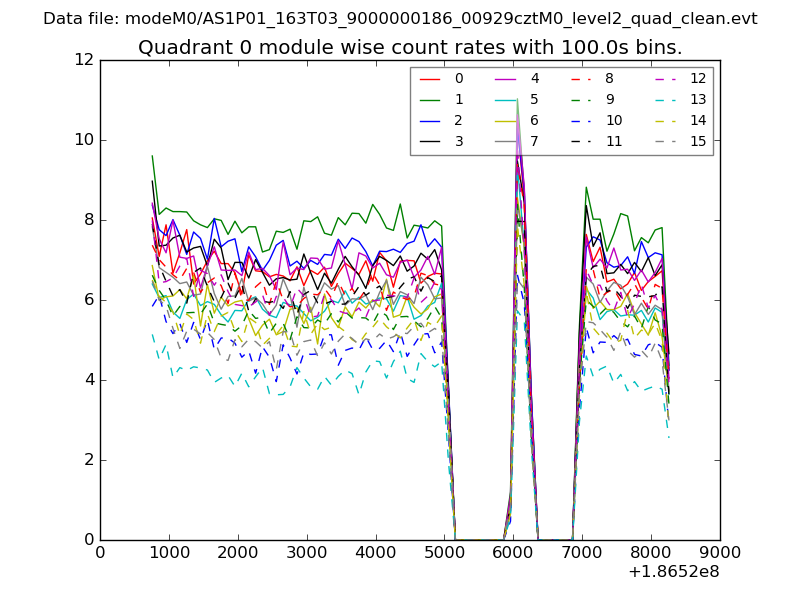 |
 |
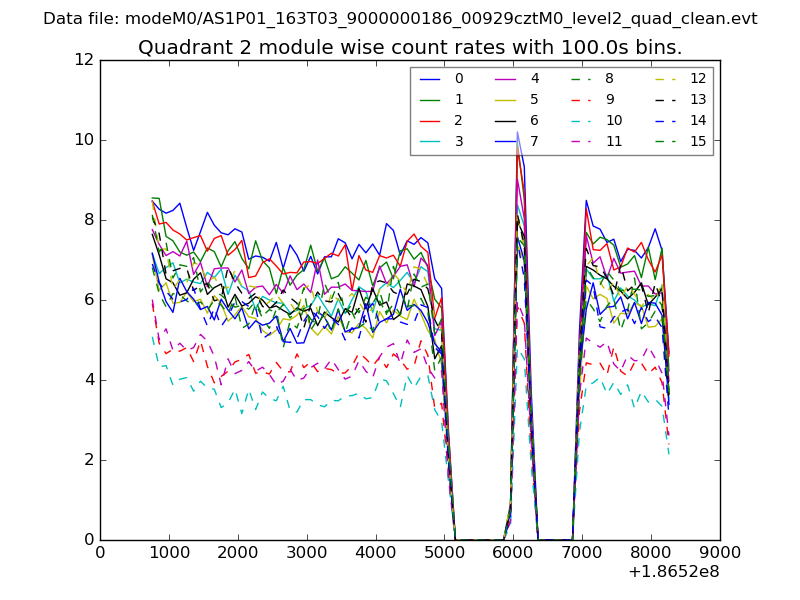
| Module-wise count rates for Quadrant B Data is divided into 100 sec bins |
 |
 |
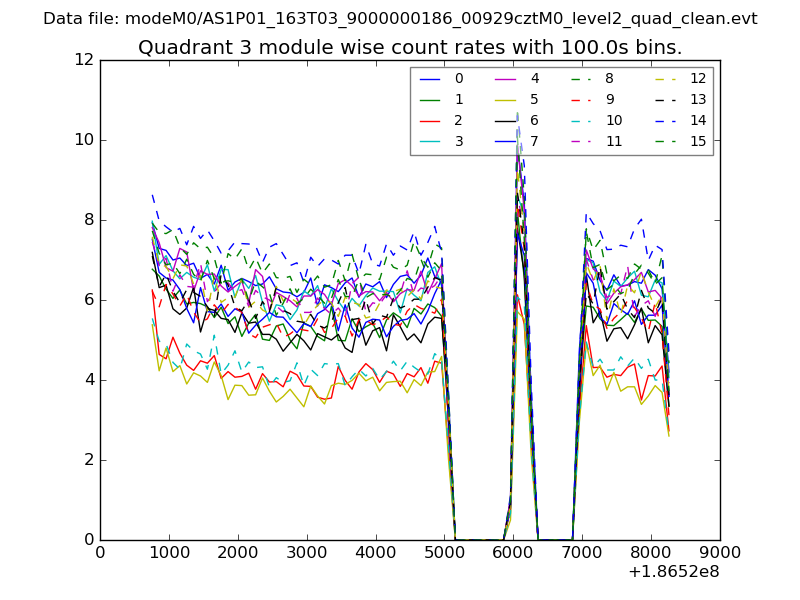
| Module-wise count rates for Quadrant C Data is divided into 100 sec bins |
 |
 |
| Module-wise count rates for Quadrant D Data is divided into 100 sec bins |
 |
 |
| Parameter | Plot |
|---|---|
| CZT HV Monitor | 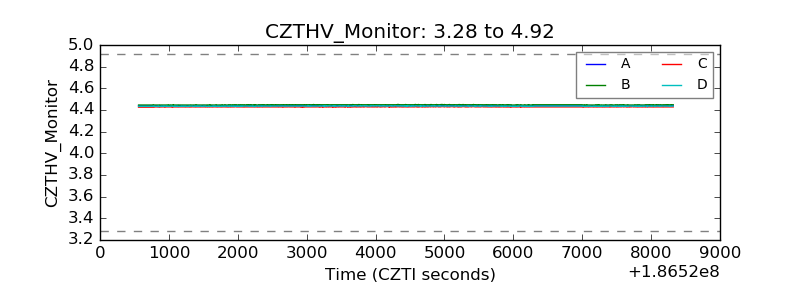 |
| D_VDD | 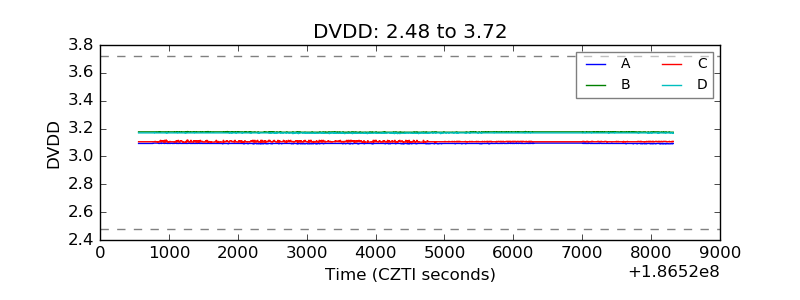 |
| Temperature 1 | 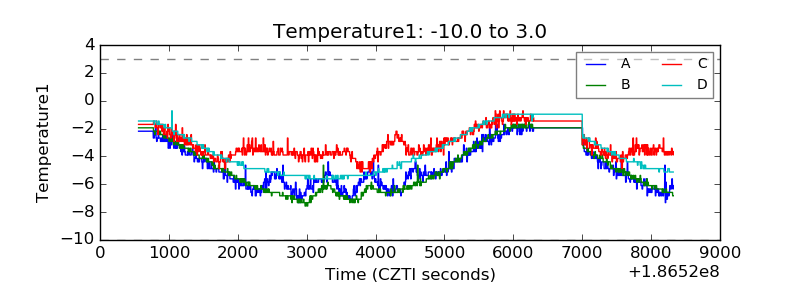 |
| Veto HV Monitor | 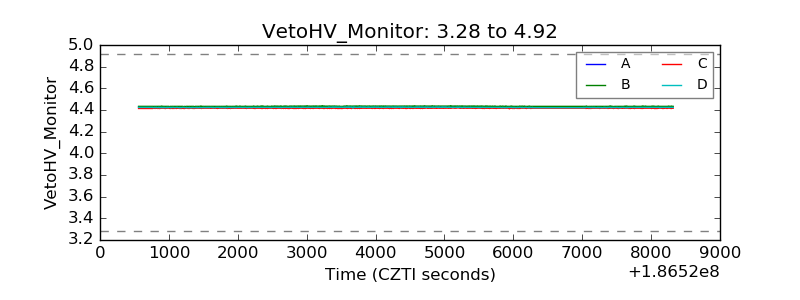 |
| Veto LLD | 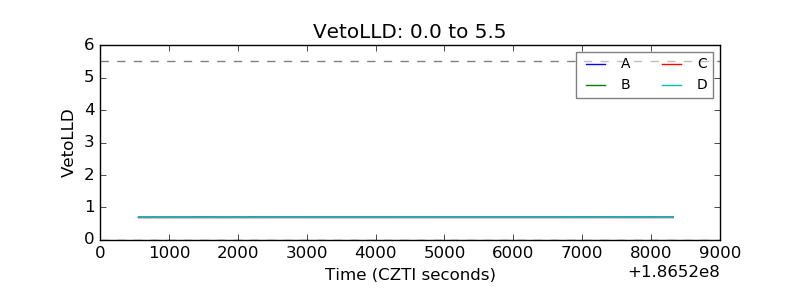 |
| Alpha Counter | 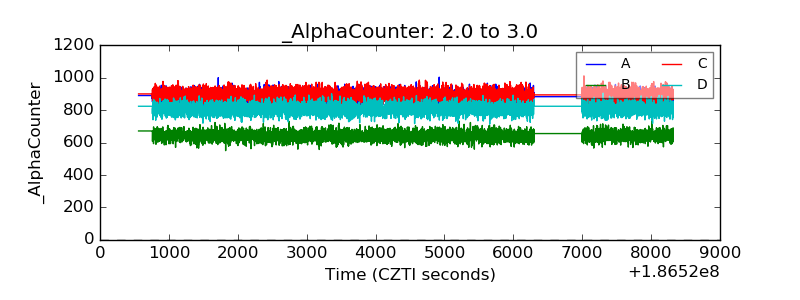 |
| _CPM_Rate | 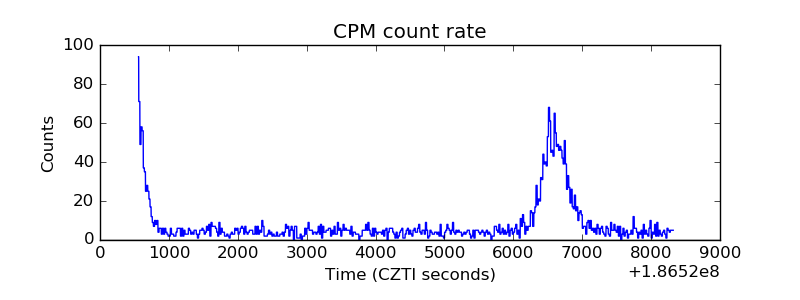 |
| CZT Counter | 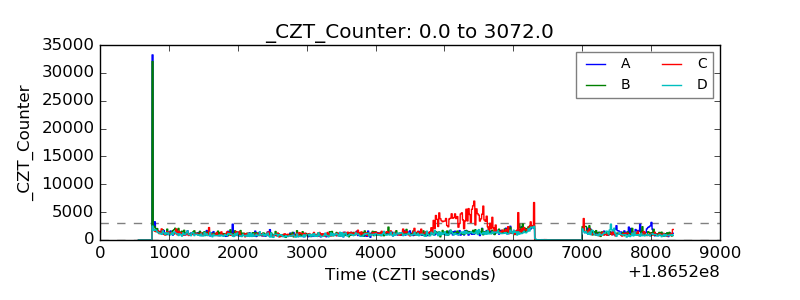 |
| +2.5 Volts monitor |  |
| +5 Volts monitor |  |
| _ROLL_ROT | 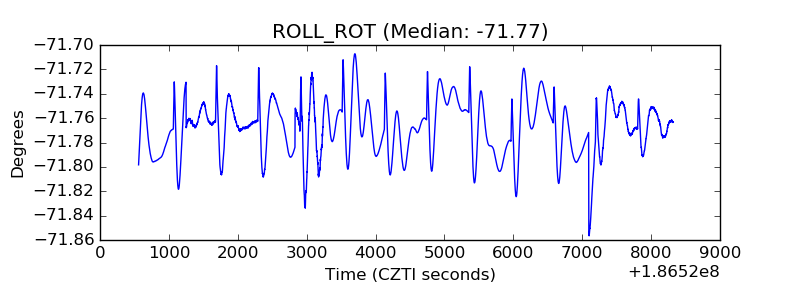 |
| _Roll_DEC | 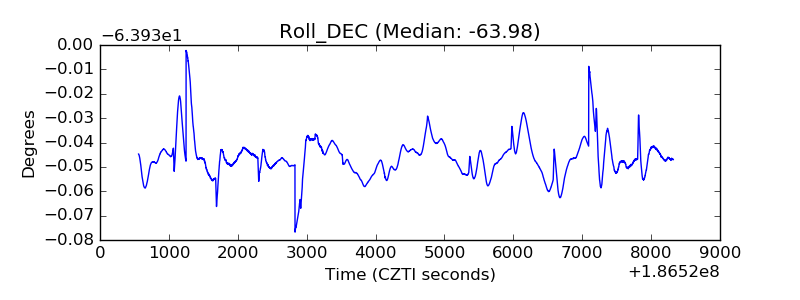 |
| _Roll_RA | 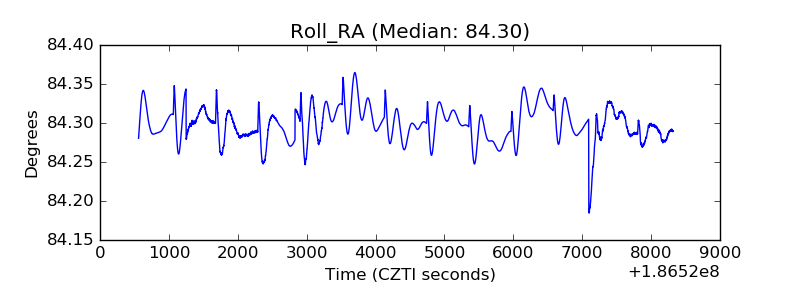 |
| Veto Counter | 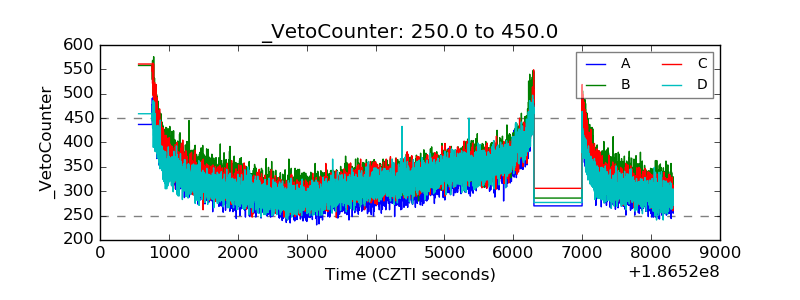 |