| Param | Original file | Final file |
|---|---|---|
| Filename | modeM0/AS1P01_163T03_9000000186_00930cztM0_level2.evt | modeM0/AS1P01_163T03_9000000186_00930cztM0_level2_quad_clean.evt |
| Size (bytes) | 1,244,952,000 | 103,561,920 |
| Size | 1.2 GB | 98.8 MB |
| Events in quadrant A | 9,929,926 | 657,449 |
| Events in quadrant B | 9,685,686 | 663,322 |
| Events in quadrant C | 9,189,260 | 643,294 |
| Events in quadrant D | 8,386,938 | 634,756 |
| Mode SS | |||
|---|---|---|---|
| Quadrant | BADHDUFLAG | Total packets | Discarded packets |
| A | 0 | 160 | 0 |
| B | 0 | 160 | 0 |
| C | 0 | 160 | 0 |
| D | 0 | 160 | 0 |
| Mode M0 | |||
|---|---|---|---|
| Quadrant | BADHDUFLAG | Total packets | Discarded packets |
| A | 0 | 35029 | 0 |
| B | 0 | 34249 | 0 |
| C | 0 | 32775 | 0 |
| D | 0 | 30505 | 0 |
| Mode M9 | |||
|---|---|---|---|
| Quadrant | BADHDUFLAG | Total packets | Discarded packets |
| A | 0 | 9 | 0 |
| B | 0 | 9 | 0 |
| C | 0 | 9 | 0 |
| D | 0 | 9 | 0 |
| Quadrant | Total seconds | Saturated seconds | Saturation percentage |
|---|---|---|---|
| A | 7729 | 65 | 0.840988% |
| B | 7730 | 36 | 0.465718% |
| C | 7730 | 16 | 0.206986% |
| D | 7730 | 24 | 0.310479% |
Noise dominated data is calculated using 1-second bins in cleaned event files. If a bin has >2000 counts, and if more than 50% of those come from <1% of pixels, then it is considered to be noise-dominated and hence unusable.
| Quadrant | # 1 sec bins | Bins with >0 counts | Bins with >2000 counts | High rate bins dominated by noise | Noise dominated (total time) | Noise dominated (detector-on time) | Marked lightcurve |
|---|---|---|---|---|---|---|---|
| A | 8609 | 7732 | 591 | 591 | 6.86% | 7.64% |  |
| B | 8610 | 7733 | 389 | 389 | 4.52% | 5.03% | 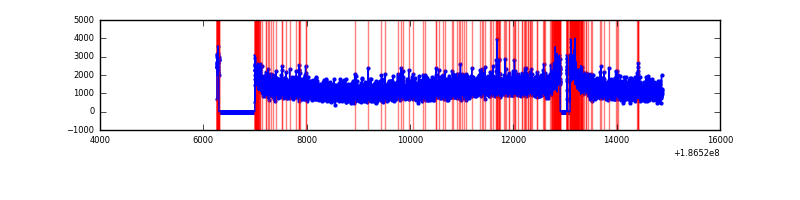 |
| C | 8610 | 7733 | 265 | 265 | 3.08% | 3.43% |  |
| D | 8610 | 7733 | 227 | 227 | 2.64% | 2.94% | 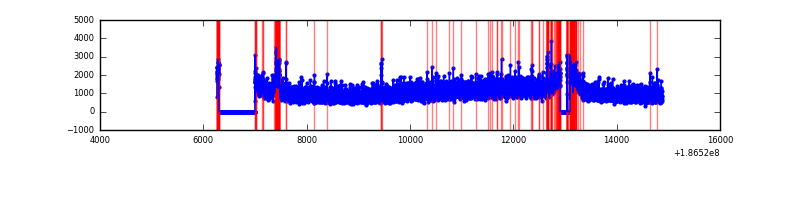 |
Top three noisy pixels from each quadrant. If the there are fewer than three noisy pixels in the level2.evt file, extra rows are filled as -1
| Pixel properties | Quadrant properties | ||||||
|---|---|---|---|---|---|---|---|
| Quadrant | DetID | PixID | Counts | Sigma | Mean | Median | Sigma |
| A | 14 | 170 | 924346 | 1622.79 | 2347 | 2362 | 568.1 |
| A | 11 | 79 | 9910 | 13.29 | 2347 | 2362 | 568.1 |
| A | 3 | 111 | 7756 | 9.49 | 2347 | 2362 | 568.1 |
| B | 8 | 38 | 59144 | 97.71 | 2484 | 2494 | 579.8 |
| B | 15 | 22 | 56783 | 93.64 | 2484 | 2494 | 579.8 |
| B | 5 | 249 | 30330 | 48.01 | 2484 | 2494 | 579.8 |
| C | 15 | 241 | 286304 | 456.62 | 2235 | 2309 | 622.0 |
| C | 9 | 144 | 71654 | 111.5 | 2235 | 2309 | 622.0 |
| C | 9 | 52 | 28222 | 41.66 | 2235 | 2309 | 622.0 |
| D | 1 | 4 | 157490 | 235.15 | 2138 | 2213 | 660.3 |
| D | 13 | 171 | 133608 | 198.98 | 2138 | 2213 | 660.3 |
| D | 12 | 188 | 79235 | 116.64 | 2138 | 2213 | 660.3 |
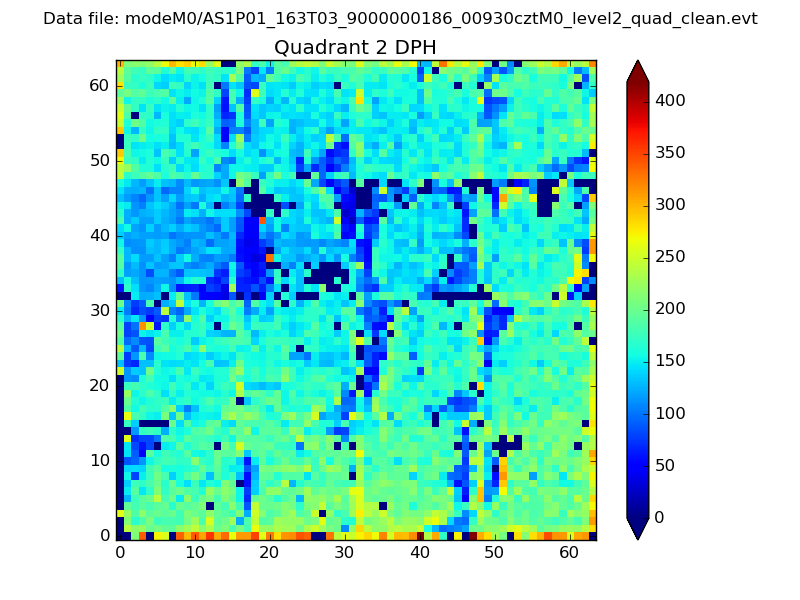
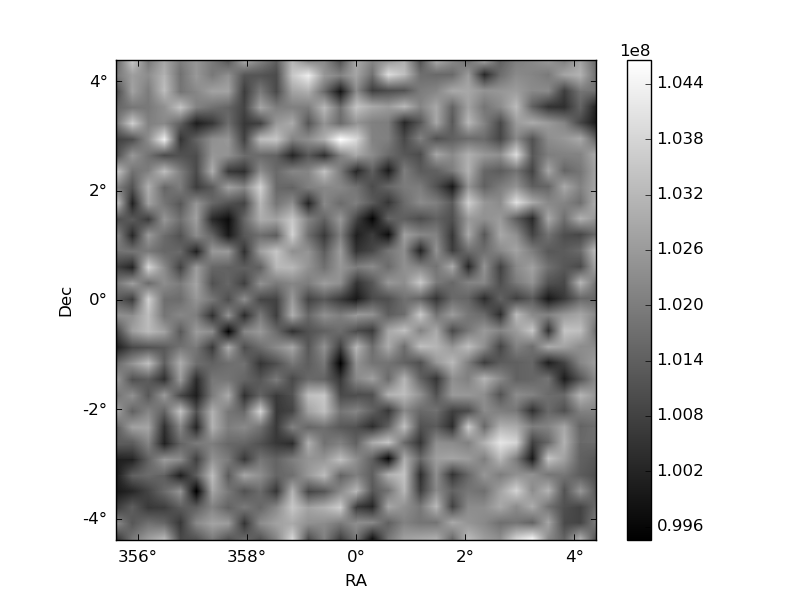
Histogram calculated using DETX and DETY for each event in the final _common_clean file
| Quadrant A | 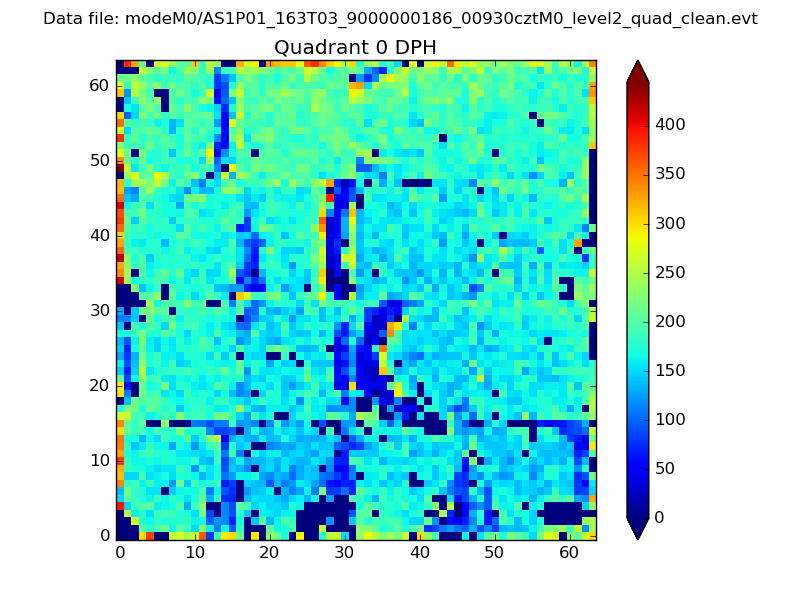 |
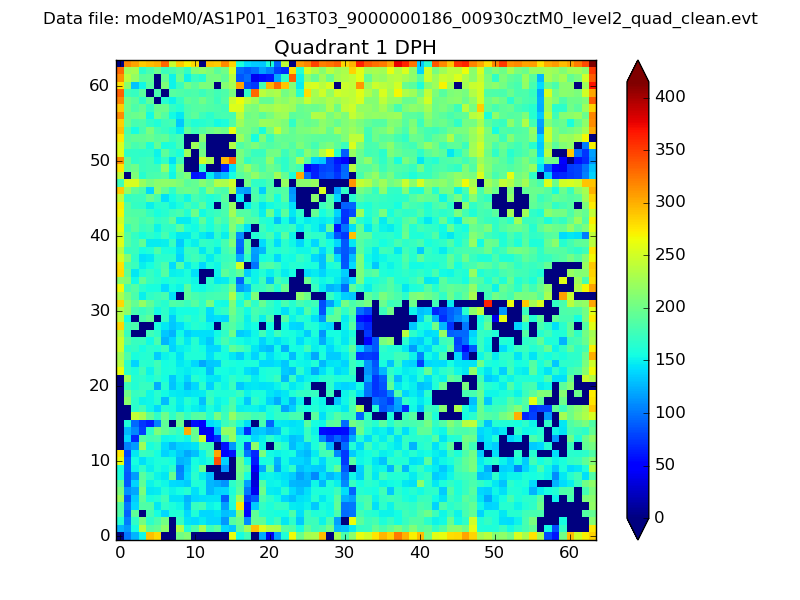 |
Quadrant B |
|---|---|---|---|
| Quadrant D | 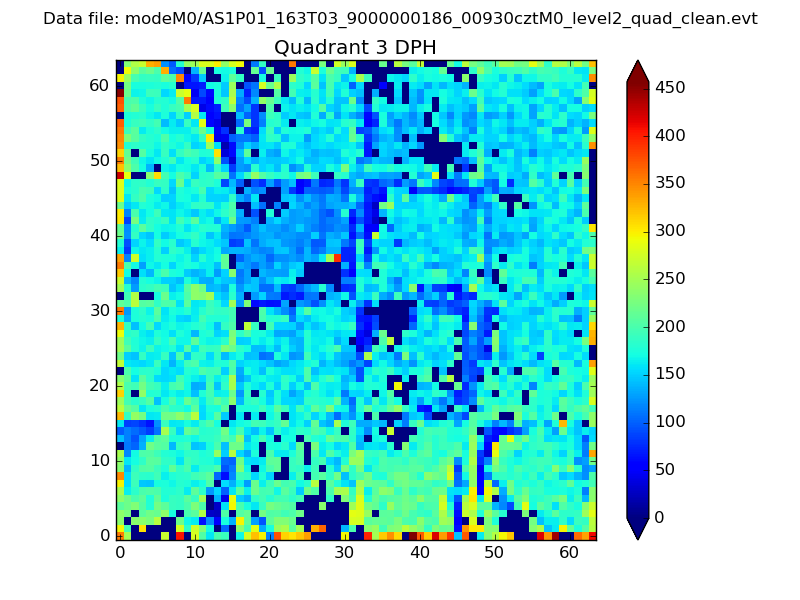 |
 |
Quadrant C |
| Plot type | Count rate plots | Images |
|---|---|---|
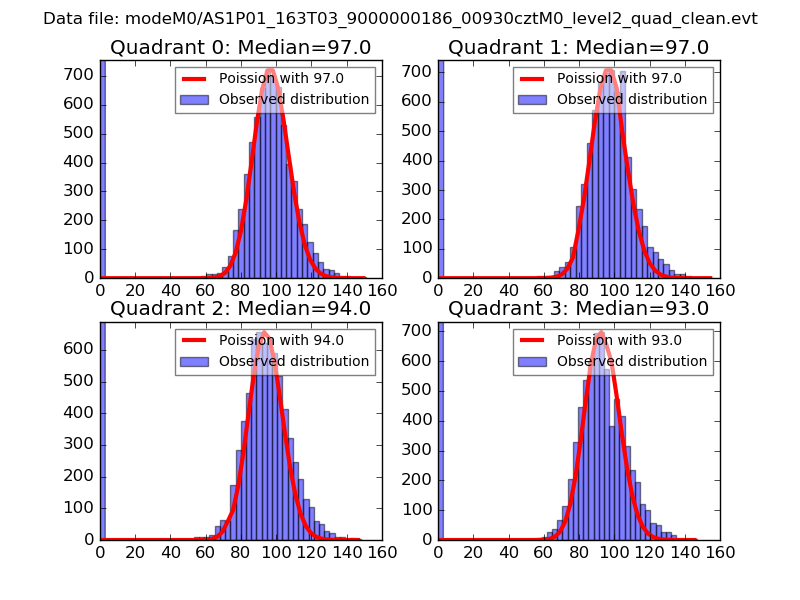
| Comparison with Poisson distribution Blue bars denote a histogram of data divided into 1 sec bins. Red curve is a Poisson curve with rate = median count rate of data. |
 |
 |
| Quadrant-wise count rates Data is divided into 100 sec bins |
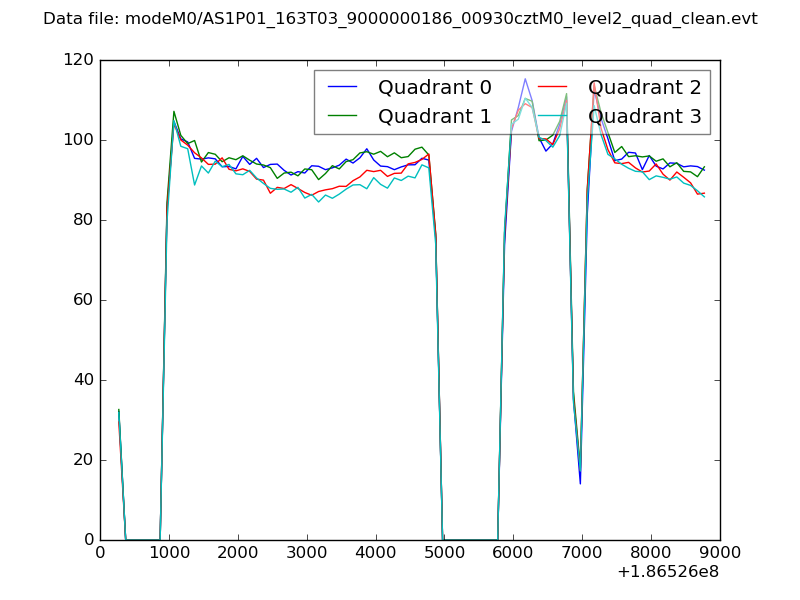 |
|
| Module-wise count rates for Quadrant A Data is divided into 100 sec bins |
 |
 |
| Module-wise count rates for Quadrant B Data is divided into 100 sec bins |
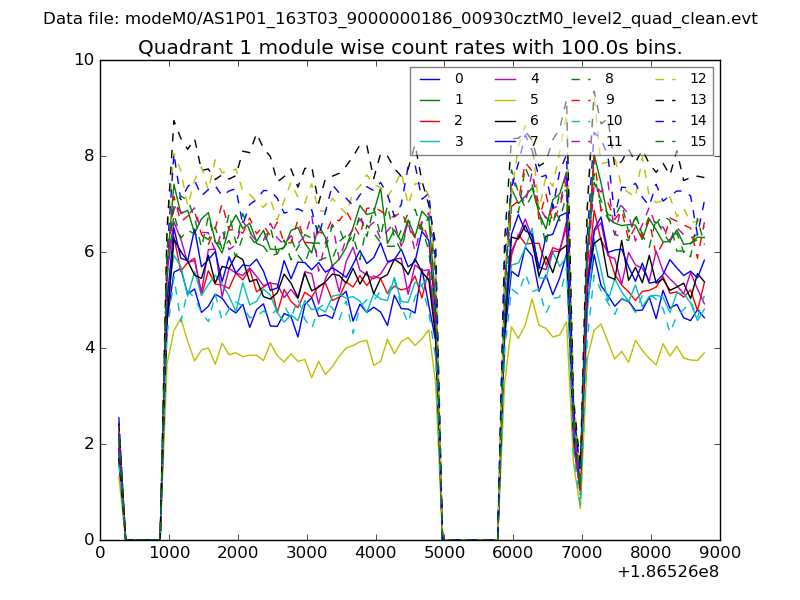 |
 |
| Module-wise count rates for Quadrant C Data is divided into 100 sec bins |
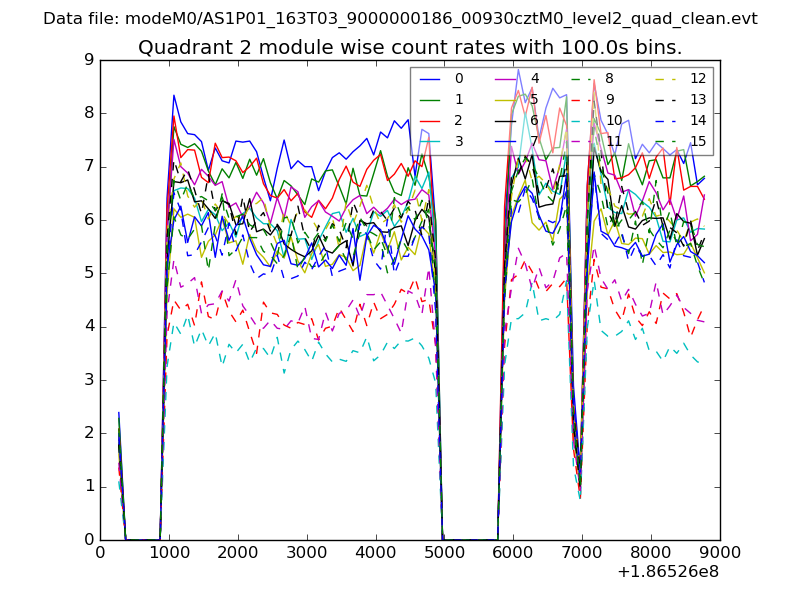 |
 |
| Module-wise count rates for Quadrant D Data is divided into 100 sec bins |
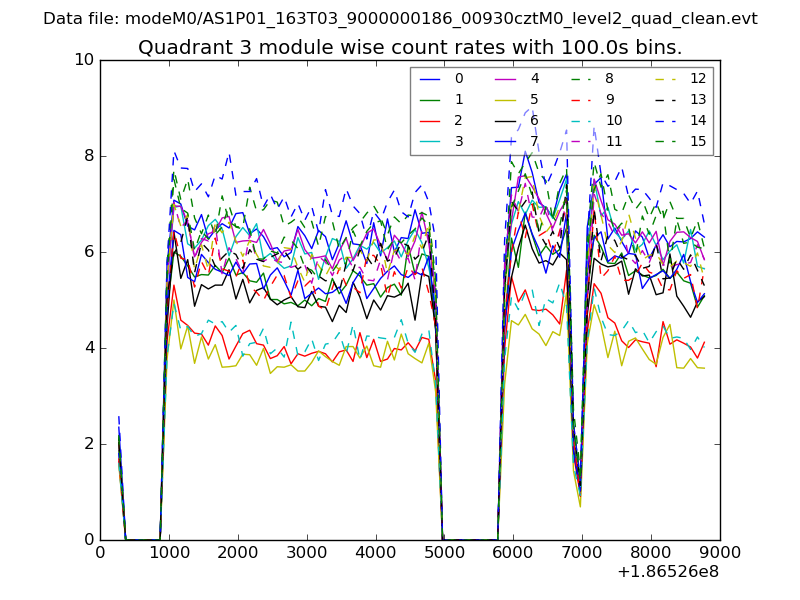 |
 |
| Parameter | Plot |
|---|---|
| CZT HV Monitor | 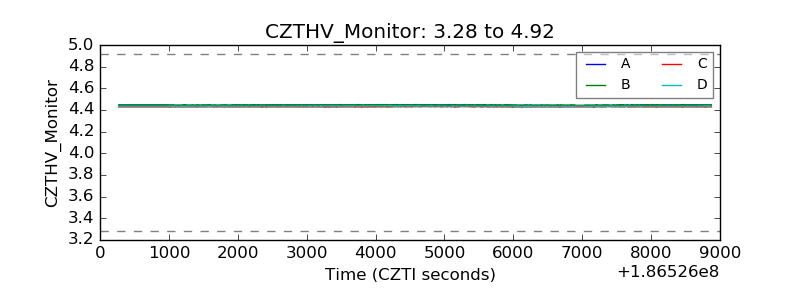 |
| D_VDD | 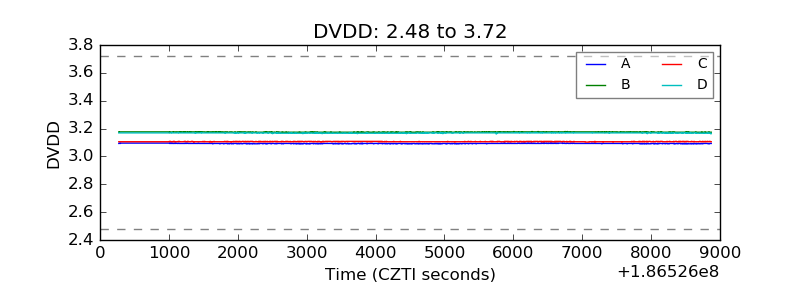 |
| Temperature 1 |  |
| Veto HV Monitor | 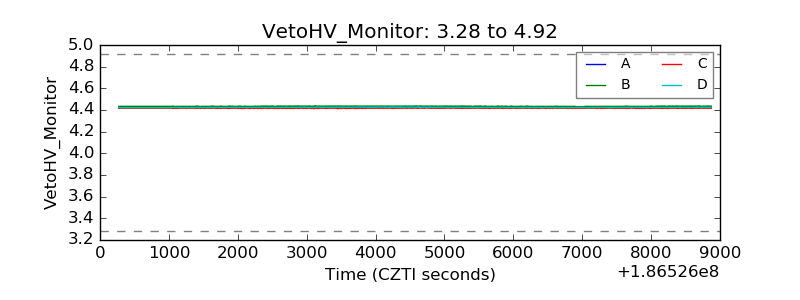 |
| Veto LLD | 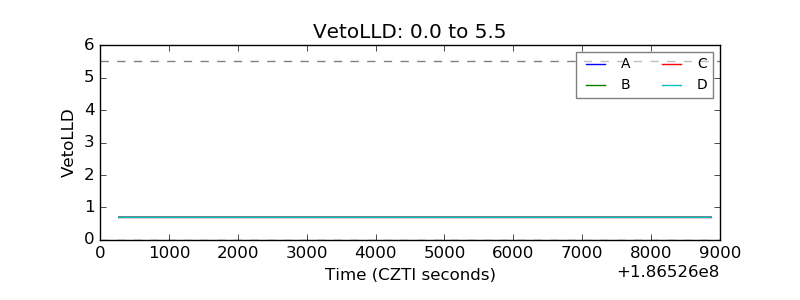 |
| Alpha Counter | 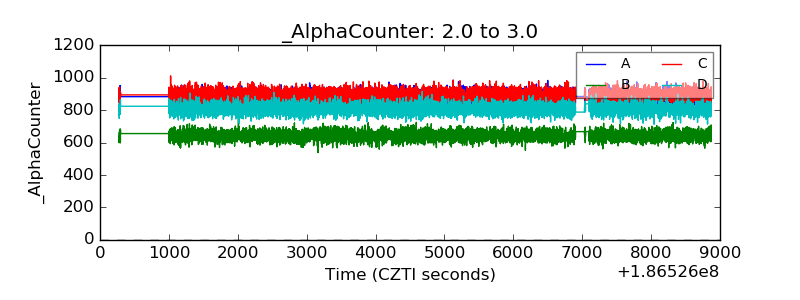 |
| _CPM_Rate | 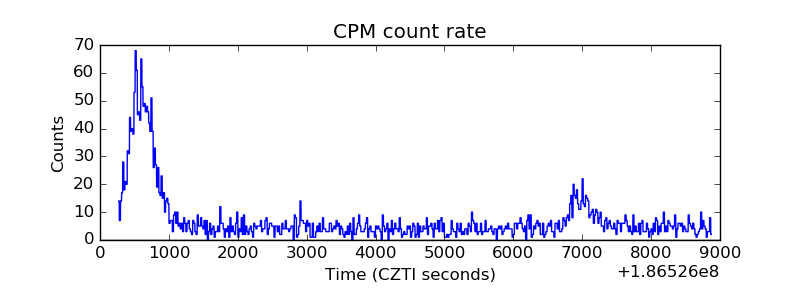 |
| CZT Counter | 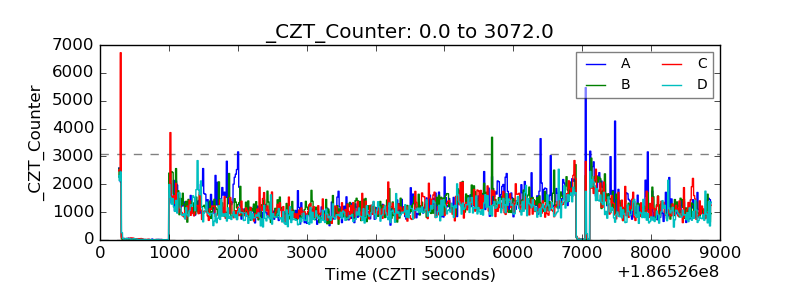 |
| +2.5 Volts monitor |  |
| +5 Volts monitor | 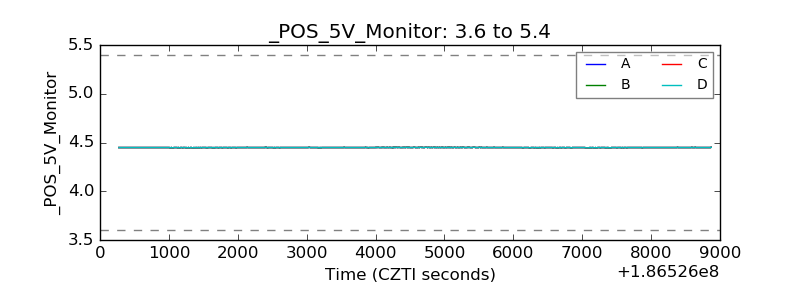 |
| _ROLL_ROT | 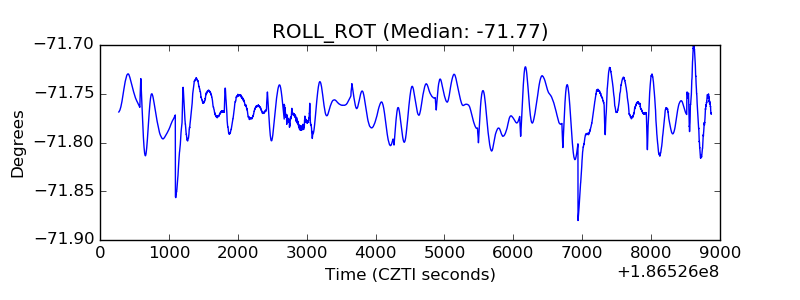 |
| _Roll_DEC | 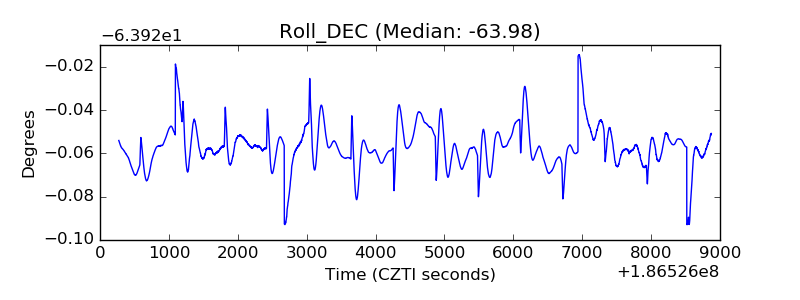 |
| _Roll_RA | 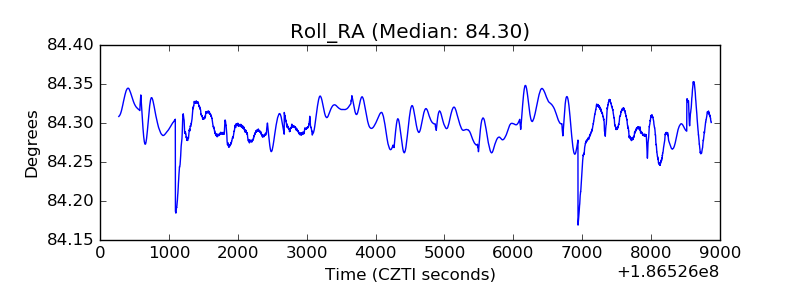 |
| Veto Counter | 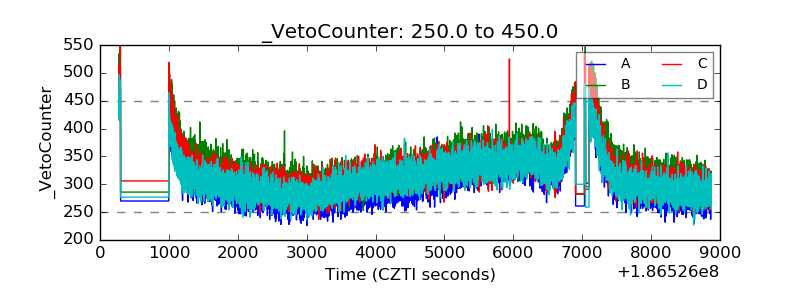 |