| Param | Original file | Final file |
|---|---|---|
| Filename | modeM0/AS1P01_163T03_9000000186_00931cztM0_level2.evt | modeM0/AS1P01_163T03_9000000186_00931cztM0_level2_quad_clean.evt |
| Size (bytes) | 1,318,371,840 | 106,220,160 |
| Size | 1.2 GB | 101.3 MB |
| Events in quadrant A | 11,022,119 | 667,064 |
| Events in quadrant B | 9,927,114 | 683,423 |
| Events in quadrant C | 9,500,173 | 662,111 |
| Events in quadrant D | 8,951,692 | 651,416 |
| Mode SS | |||
|---|---|---|---|
| Quadrant | BADHDUFLAG | Total packets | Discarded packets |
| A | 0 | 158 | 0 |
| B | 0 | 158 | 0 |
| C | 0 | 158 | 0 |
| D | 0 | 158 | 0 |
| Mode M0 | |||
|---|---|---|---|
| Quadrant | BADHDUFLAG | Total packets | Discarded packets |
| A | 0 | 38370 | 0 |
| B | 0 | 35171 | 0 |
| C | 0 | 33874 | 0 |
| D | 0 | 32281 | 0 |
| Quadrant | Total seconds | Saturated seconds | Saturation percentage |
|---|---|---|---|
| A | 7956 | 215 | 2.702363% |
| B | 7956 | 14 | 0.175968% |
| C | 7956 | 3 | 0.037707% |
| D | 7956 | 40 | 0.502765% |
Noise dominated data is calculated using 1-second bins in cleaned event files. If a bin has >2000 counts, and if more than 50% of those come from <1% of pixels, then it is considered to be noise-dominated and hence unusable.
| Quadrant | # 1 sec bins | Bins with >0 counts | Bins with >2000 counts | High rate bins dominated by noise | Noise dominated (total time) | Noise dominated (detector-on time) | Marked lightcurve |
|---|---|---|---|---|---|---|---|
| A | 7956 | 7956 | 1051 | 1051 | 13.21% | 13.21% | 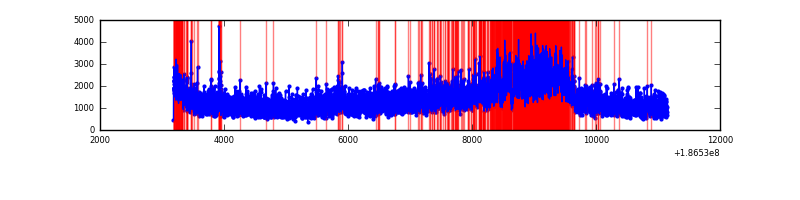 |
| B | 7956 | 7956 | 383 | 383 | 4.81% | 4.81% | 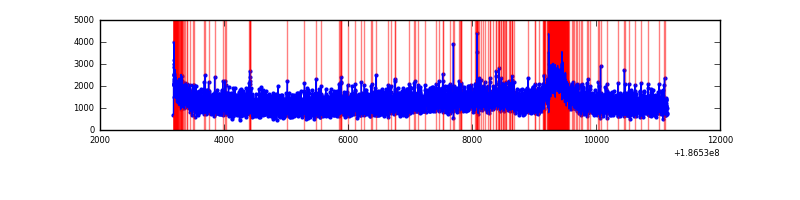 |
| C | 7956 | 7956 | 263 | 263 | 3.31% | 3.31% | 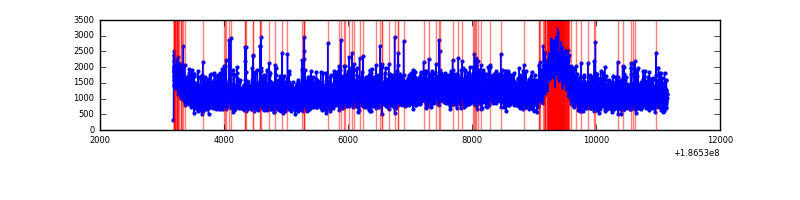 |
| D | 7956 | 7956 | 304 | 304 | 3.82% | 3.82% | 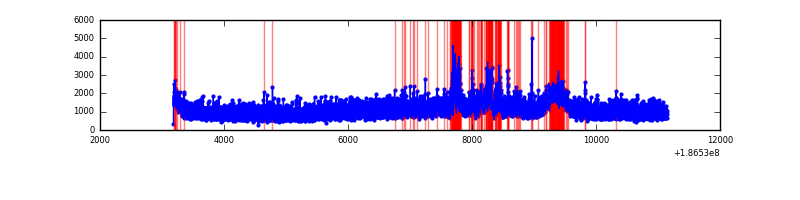 |
Top three noisy pixels from each quadrant. If the there are fewer than three noisy pixels in the level2.evt file, extra rows are filled as -1
| Pixel properties | Quadrant properties | ||||||
|---|---|---|---|---|---|---|---|
| Quadrant | DetID | PixID | Counts | Sigma | Mean | Median | Sigma |
| A | 14 | 170 | 1759002 | 3010.4 | 2413 | 2435 | 583.5 |
| A | 11 | 79 | 9809 | 12.64 | 2413 | 2435 | 583.5 |
| A | 3 | 111 | 7660 | 8.95 | 2413 | 2435 | 583.5 |
| B | 4 | 200 | 28256 | 42.83 | 2572 | 2583 | 599.5 |
| B | 5 | 249 | 25959 | 39.0 | 2572 | 2583 | 599.5 |
| B | 0 | 182 | 18887 | 27.2 | 2572 | 2583 | 599.5 |
| C | 15 | 241 | 289179 | 441.03 | 2321 | 2400 | 650.3 |
| C | 9 | 144 | 91672 | 137.29 | 2321 | 2400 | 650.3 |
| C | 3 | 111 | 29647 | 41.9 | 2321 | 2400 | 650.3 |
| D | 12 | 188 | 513879 | 741.85 | 2211 | 2286 | 689.6 |
| D | 1 | 4 | 116805 | 166.06 | 2211 | 2286 | 689.6 |
| D | 13 | 171 | 60489 | 84.4 | 2211 | 2286 | 689.6 |
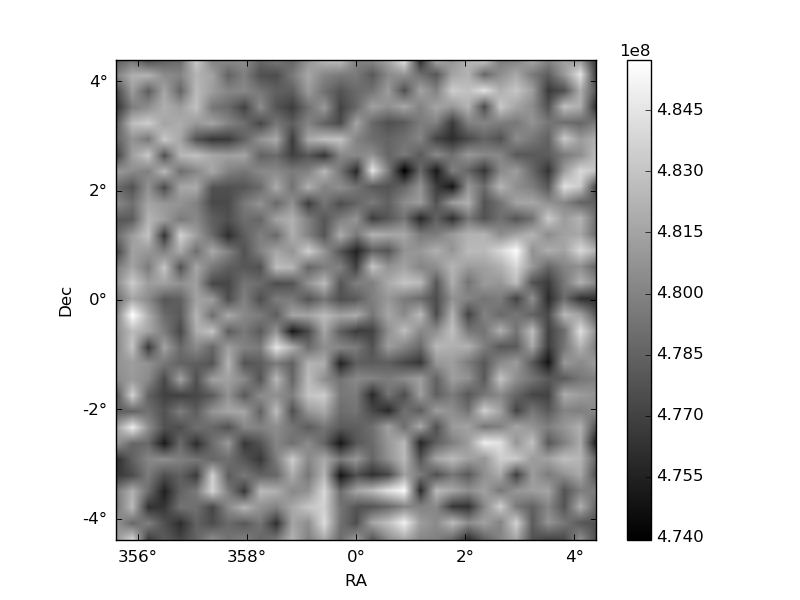
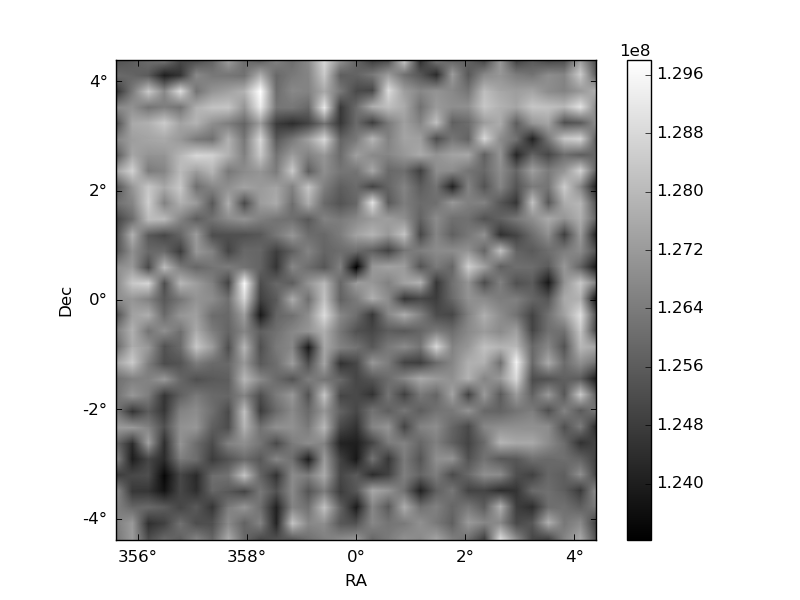
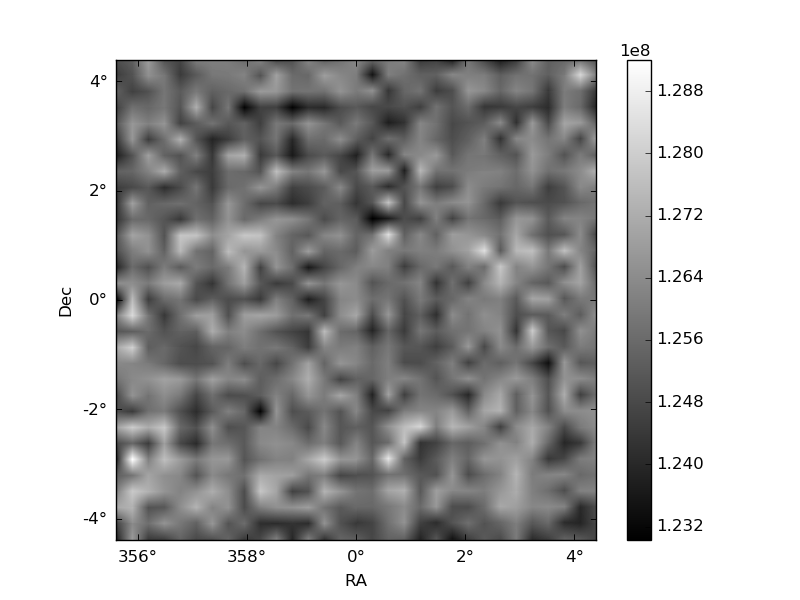
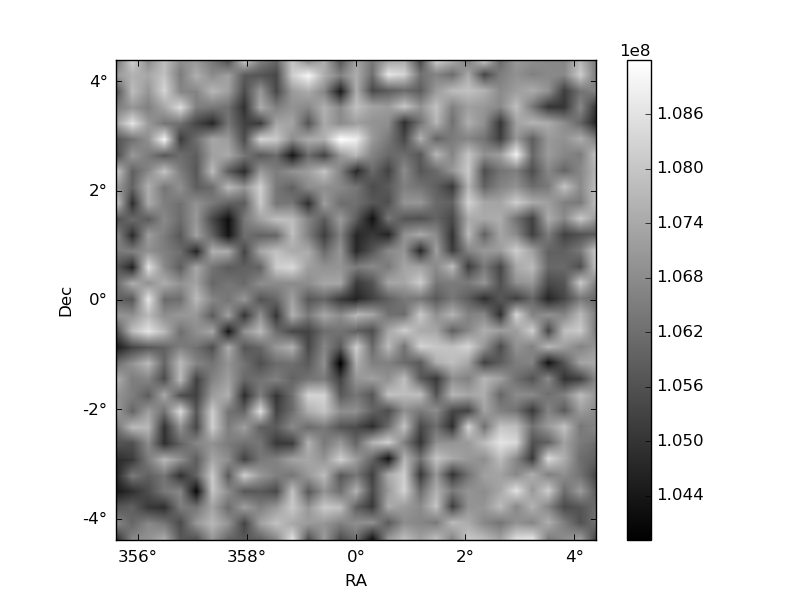
Histogram calculated using DETX and DETY for each event in the final _common_clean file
| Quadrant A | 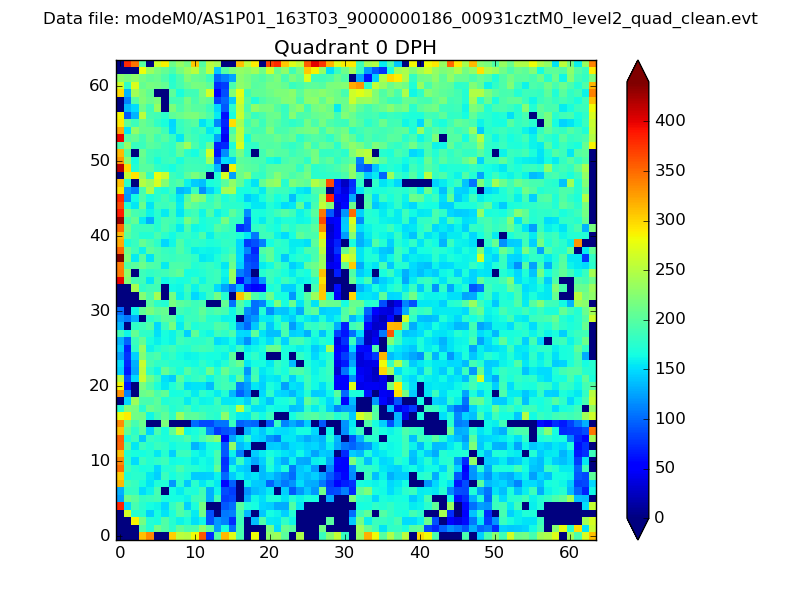 |
 |
Quadrant B |
|---|---|---|---|
| Quadrant D | 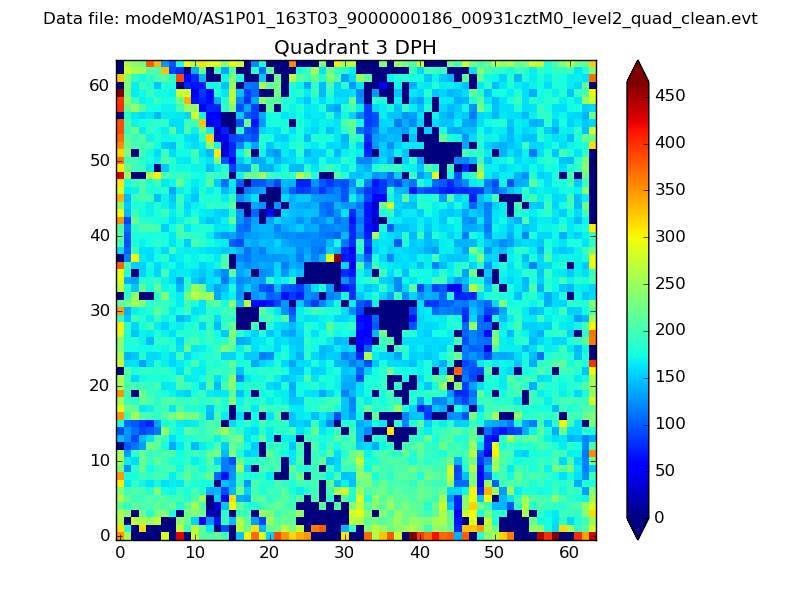 |
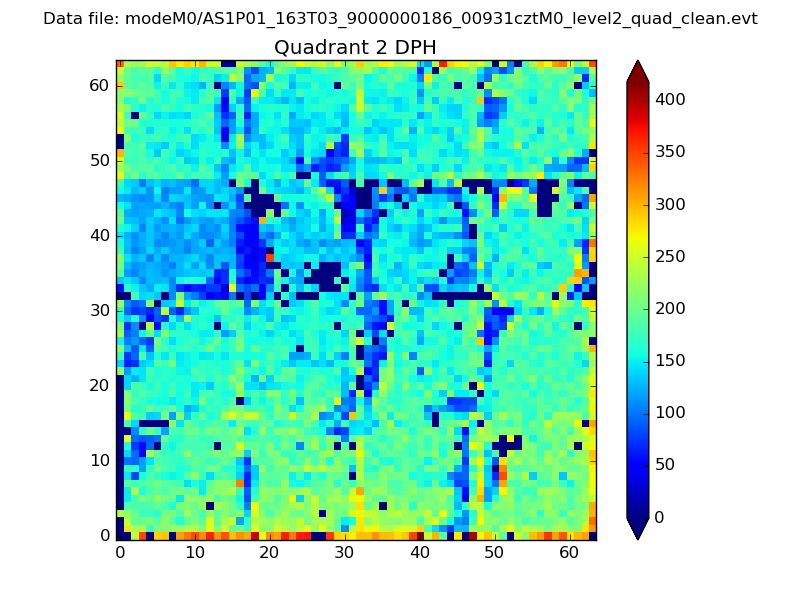 |
Quadrant C |
| Plot type | Count rate plots | Images |
|---|---|---|
| Comparison with Poisson distribution Blue bars denote a histogram of data divided into 1 sec bins. Red curve is a Poisson curve with rate = median count rate of data. |
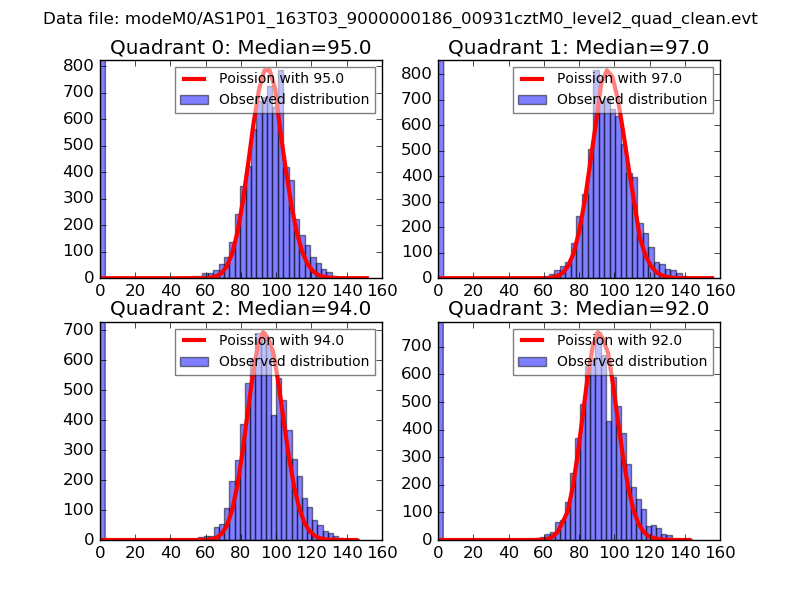 |
 |
| Quadrant-wise count rates Data is divided into 100 sec bins |
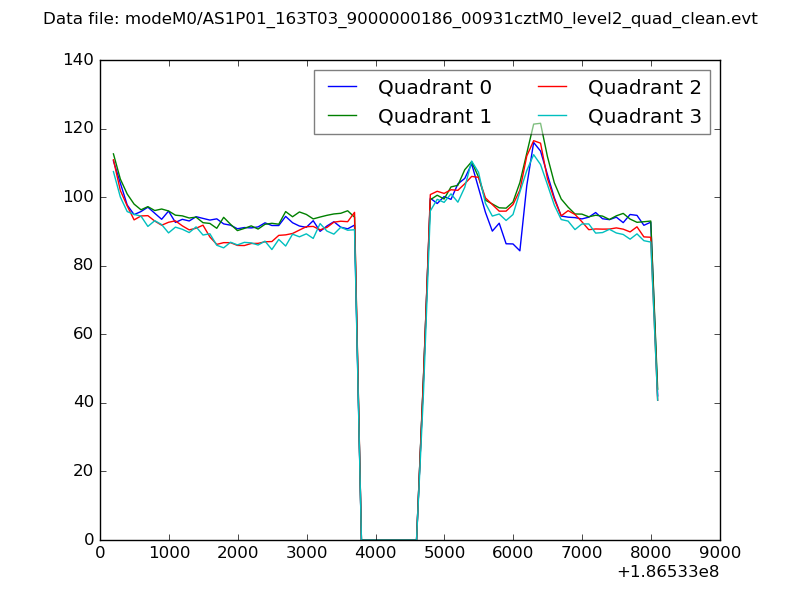 |
|
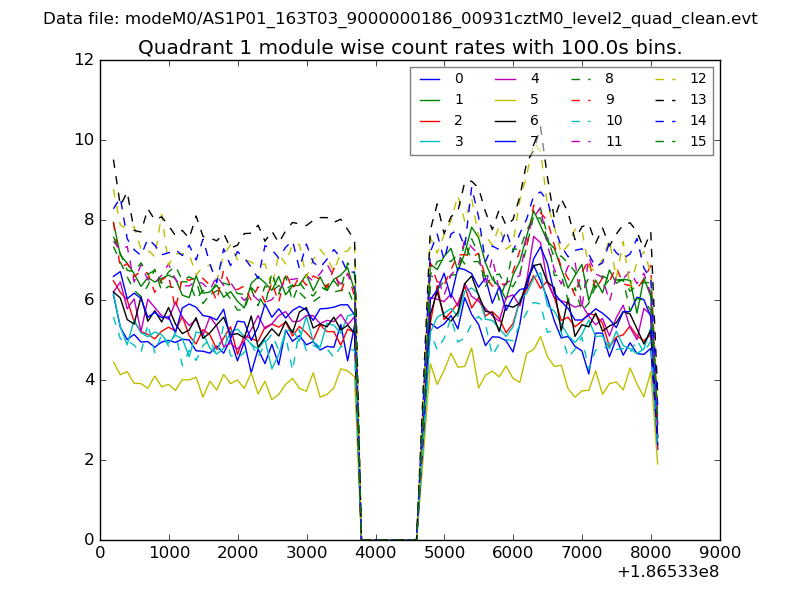
| Module-wise count rates for Quadrant A Data is divided into 100 sec bins |
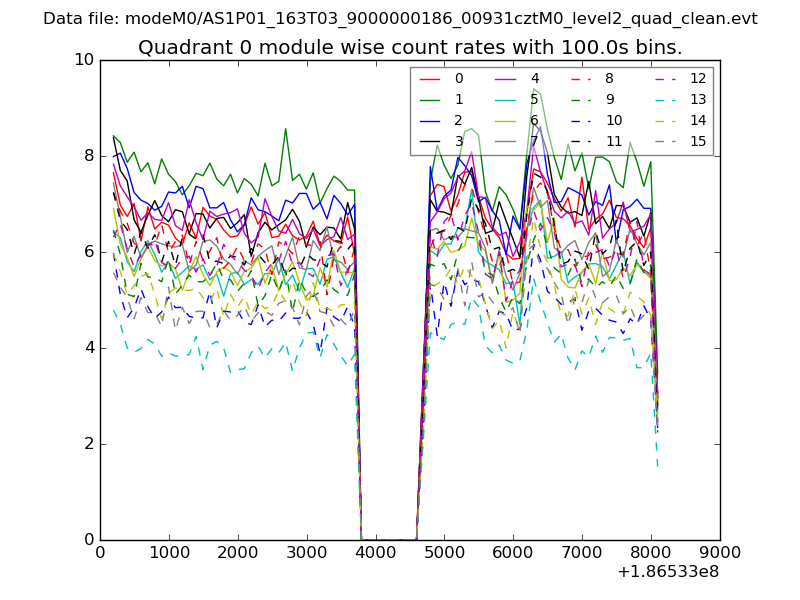 |
 |
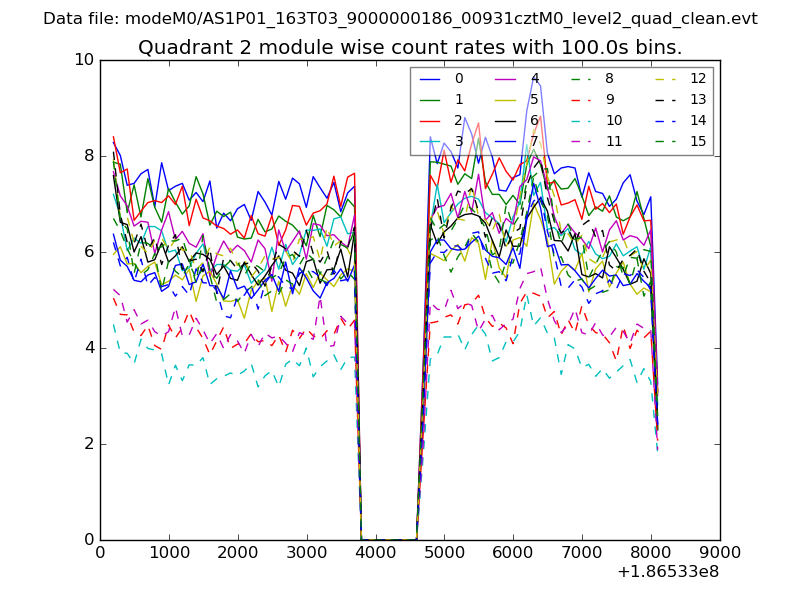
| Module-wise count rates for Quadrant B Data is divided into 100 sec bins |
 |
 |
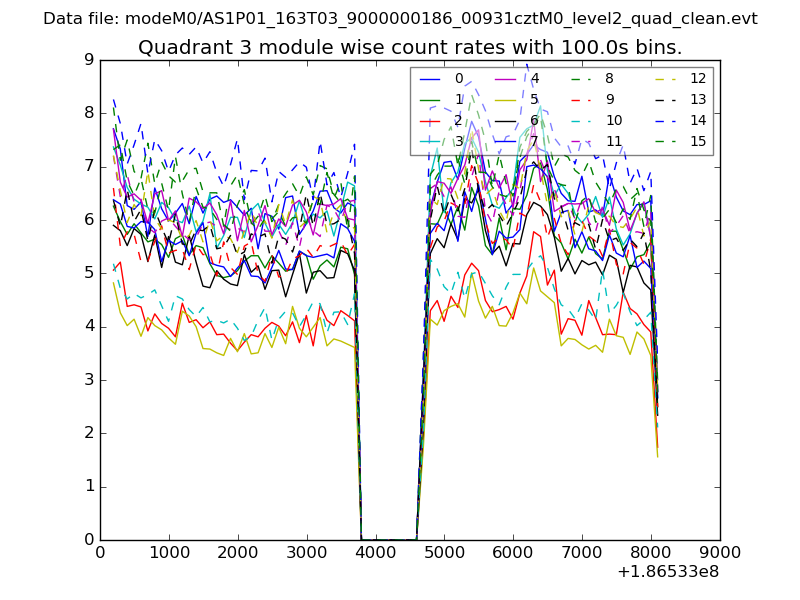
| Module-wise count rates for Quadrant C Data is divided into 100 sec bins |
 |
 |
| Module-wise count rates for Quadrant D Data is divided into 100 sec bins |
 |
 |
| Parameter | Plot |
|---|---|
| CZT HV Monitor | 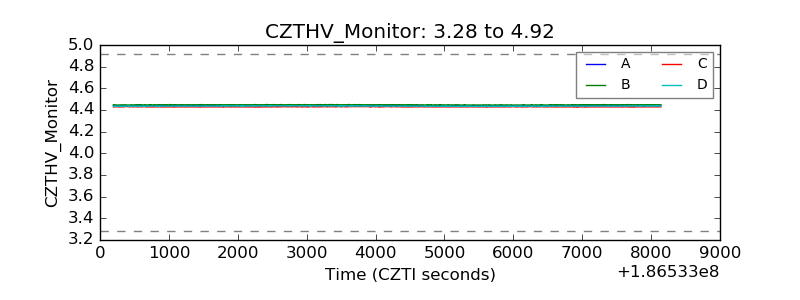 |
| D_VDD | 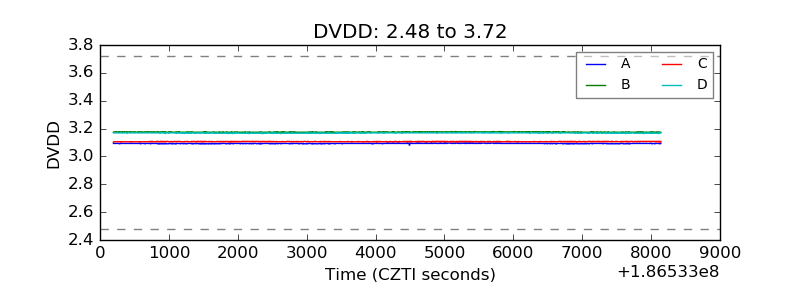 |
| Temperature 1 | 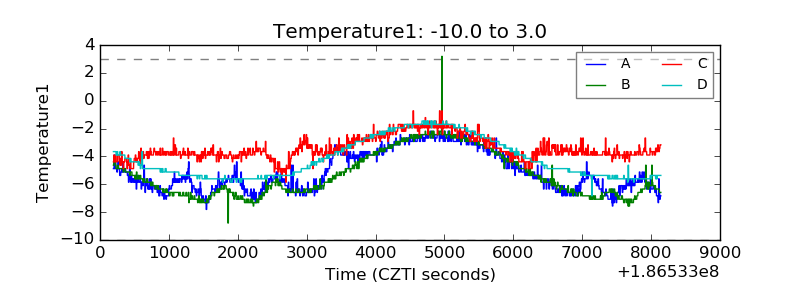 |
| Veto HV Monitor | 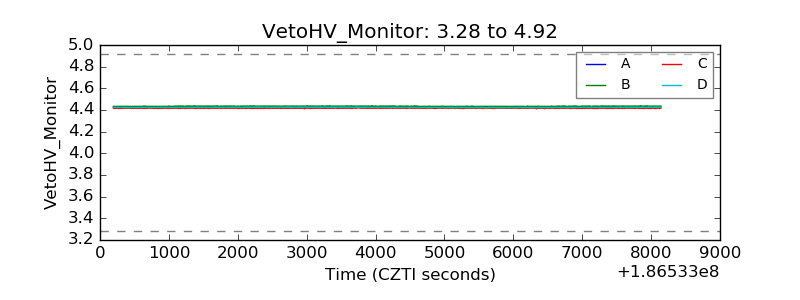 |
| Veto LLD | 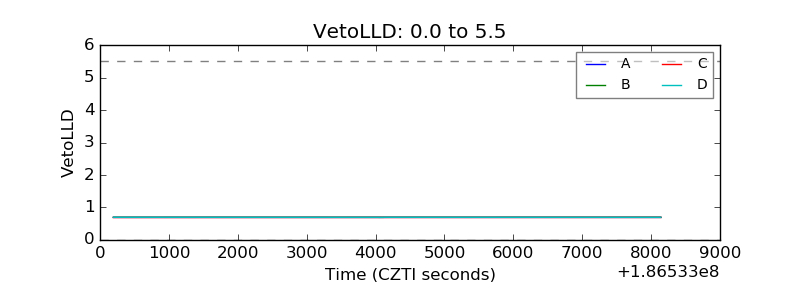 |
| Alpha Counter | 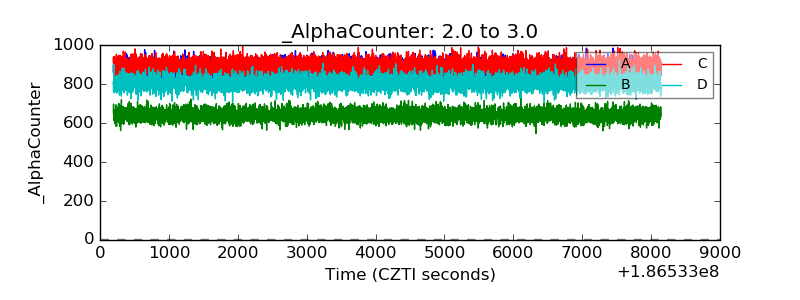 |
| _CPM_Rate | 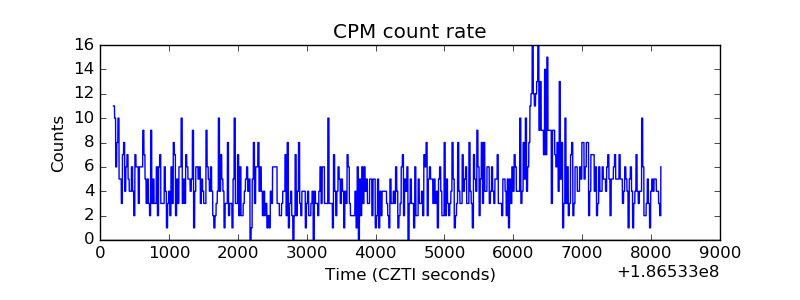 |
| CZT Counter | 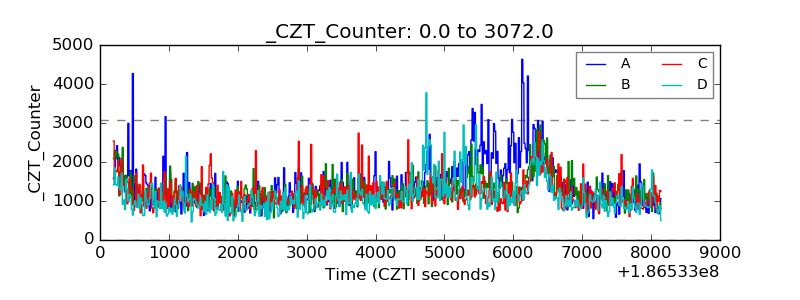 |
| +2.5 Volts monitor |  |
| +5 Volts monitor |  |
| _ROLL_ROT | 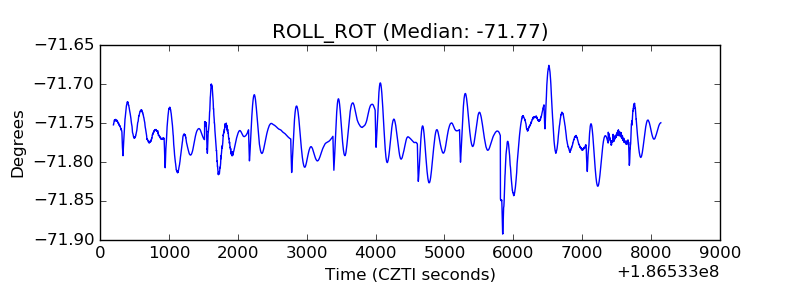 |
| _Roll_DEC | 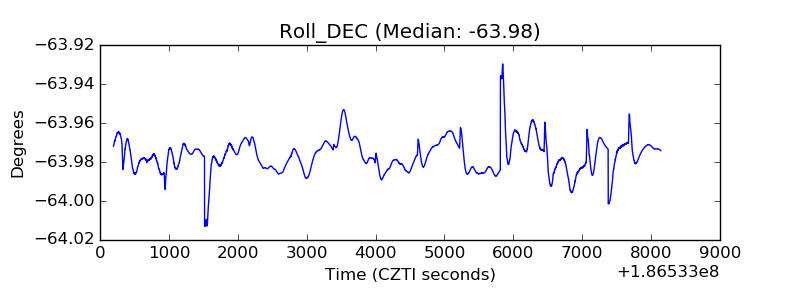 |
| _Roll_RA | 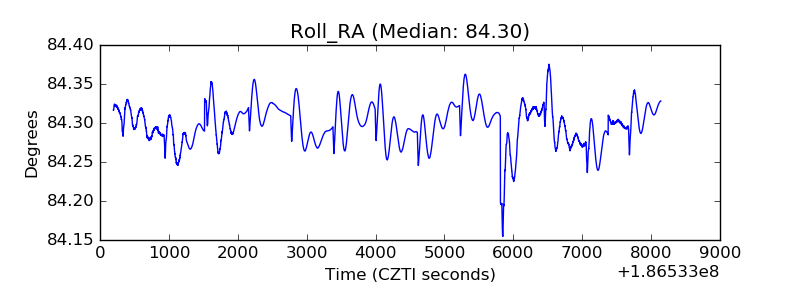 |
| Veto Counter | 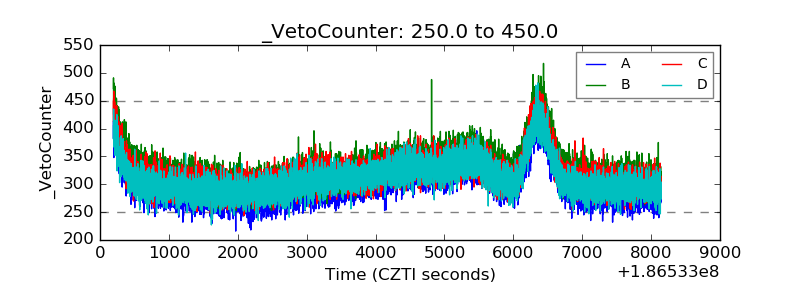 |