| Param | Original file | Final file |
|---|---|---|
| Filename | modeM0/AS1P01_163T03_9000000186_00932cztM0_level2.evt | modeM0/AS1P01_163T03_9000000186_00932cztM0_level2_quad_clean.evt |
| Size (bytes) | 521,893,440 | 40,057,920 |
| Size | 497.7 MB | 38.2 MB |
| Events in quadrant A | 3,794,812 | 246,520 |
| Events in quadrant B | 3,877,403 | 248,699 |
| Events in quadrant C | 3,894,500 | 239,837 |
| Events in quadrant D | 4,008,170 | 233,281 |
| Mode SS | |||
|---|---|---|---|
| Quadrant | BADHDUFLAG | Total packets | Discarded packets |
| A | 0 | 68 | 0 |
| B | 0 | 68 | 0 |
| C | 0 | 68 | 0 |
| D | 0 | 68 | 0 |
| Mode M0 | |||
|---|---|---|---|
| Quadrant | BADHDUFLAG | Total packets | Discarded packets |
| A | 0 | 13721 | 0 |
| B | 0 | 13997 | 0 |
| C | 0 | 14036 | 0 |
| D | 0 | 14350 | 0 |
| Quadrant | Total seconds | Saturated seconds | Saturation percentage |
|---|---|---|---|
| A | 3447 | 0 | 0.000000% |
| B | 3447 | 1 | 0.029011% |
| C | 3447 | 1 | 0.029011% |
| D | 3447 | 42 | 1.218451% |
Noise dominated data is calculated using 1-second bins in cleaned event files. If a bin has >2000 counts, and if more than 50% of those come from <1% of pixels, then it is considered to be noise-dominated and hence unusable.
| Quadrant | # 1 sec bins | Bins with >0 counts | Bins with >2000 counts | High rate bins dominated by noise | Noise dominated (total time) | Noise dominated (detector-on time) | Marked lightcurve |
|---|---|---|---|---|---|---|---|
| A | 3447 | 3447 | 34 | 34 | 0.99% | 0.99% | 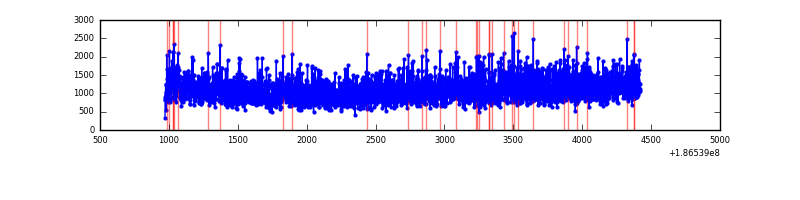 |
| B | 3447 | 3447 | 44 | 44 | 1.28% | 1.28% | 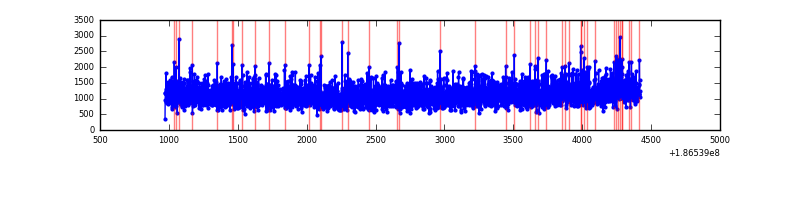 |
| C | 3447 | 3447 | 25 | 25 | 0.73% | 0.73% |  |
| D | 3447 | 3447 | 149 | 149 | 4.32% | 4.32% | 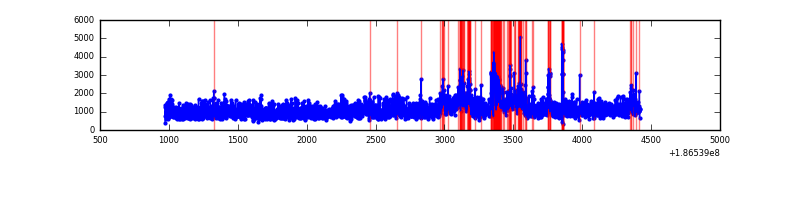 |
Top three noisy pixels from each quadrant. If the there are fewer than three noisy pixels in the level2.evt file, extra rows are filled as -1
| Pixel properties | Quadrant properties | ||||||
|---|---|---|---|---|---|---|---|
| Quadrant | DetID | PixID | Counts | Sigma | Mean | Median | Sigma |
| A | 14 | 170 | 114561 | 487.82 | 959 | 967 | 232.9 |
| A | 3 | 111 | 3155 | 9.4 | 959 | 967 | 232.9 |
| A | 11 | 79 | 3070 | 9.03 | 959 | 967 | 232.9 |
| B | 15 | 22 | 14593 | 56.97 | 1011 | 1014 | 238.4 |
| B | 5 | 249 | 7483 | 27.14 | 1011 | 1014 | 238.4 |
| B | 0 | 182 | 6770 | 24.15 | 1011 | 1014 | 238.4 |
| C | 15 | 241 | 124123 | 465.18 | 950 | 985 | 264.7 |
| C | 9 | 144 | 27033 | 98.4 | 950 | 985 | 264.7 |
| C | 3 | 111 | 12784 | 44.57 | 950 | 985 | 264.7 |
| D | 12 | 188 | 638849 | 2305.66 | 898 | 928 | 276.7 |
| D | 13 | 171 | 9585 | 31.29 | 898 | 928 | 276.7 |
| D | 13 | 169 | 4789 | 13.95 | 898 | 928 | 276.7 |
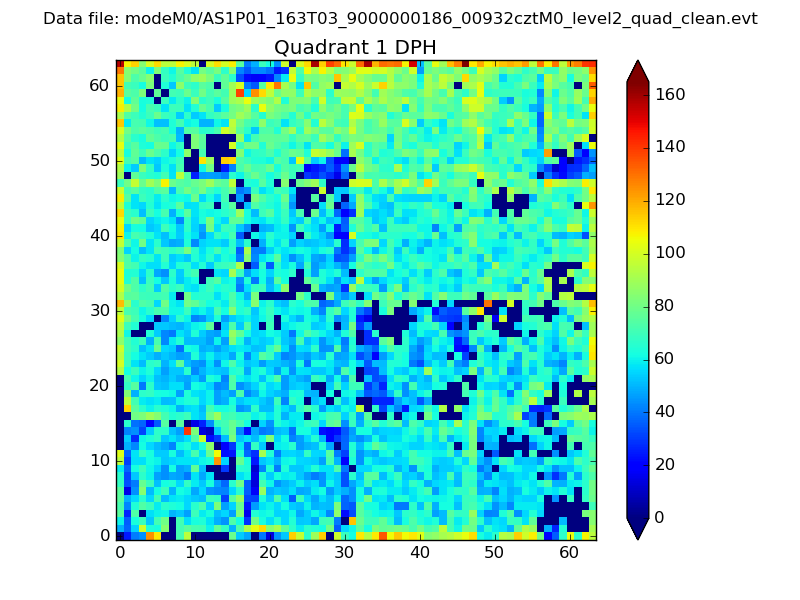
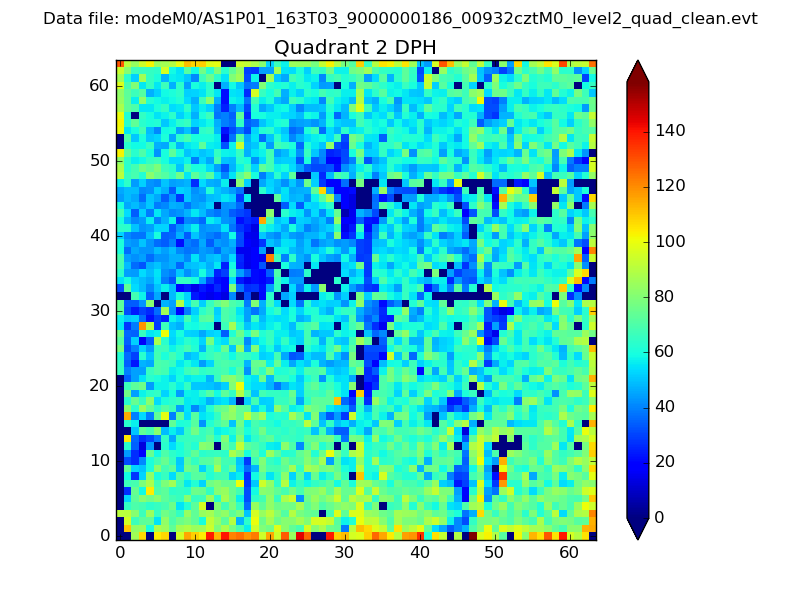
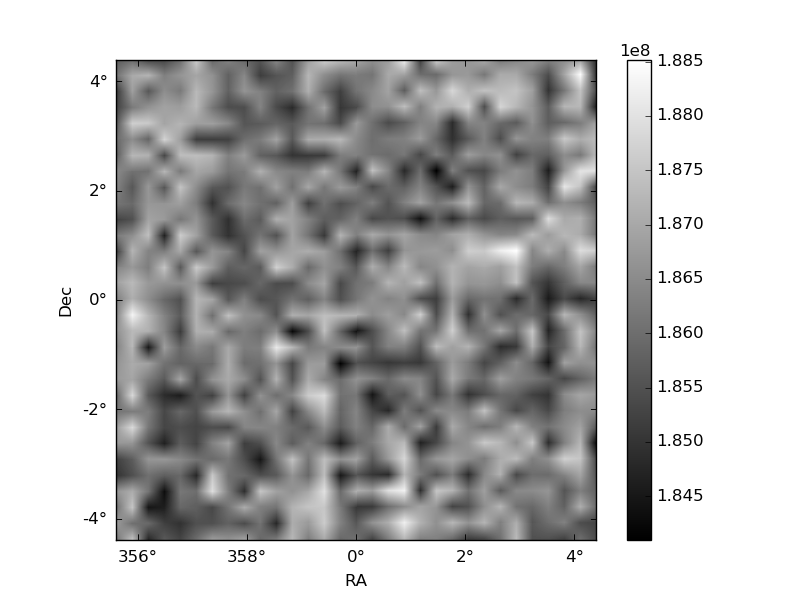
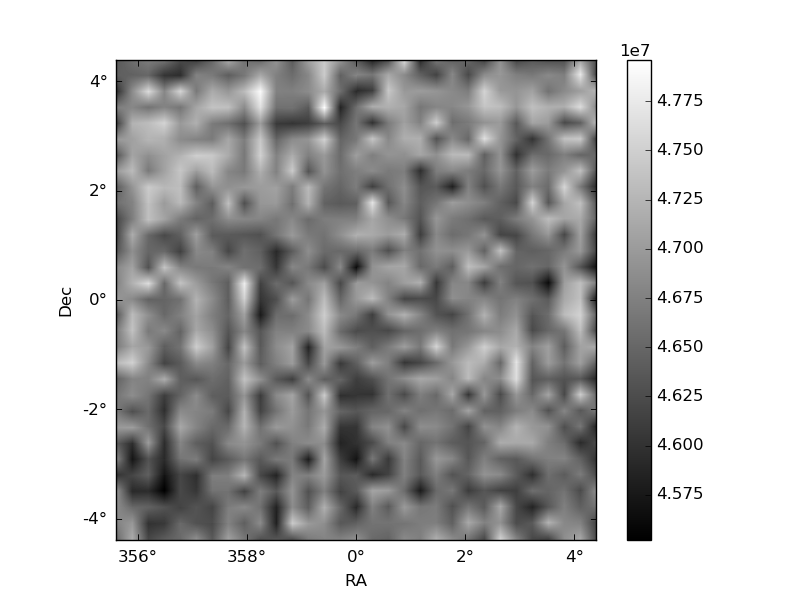
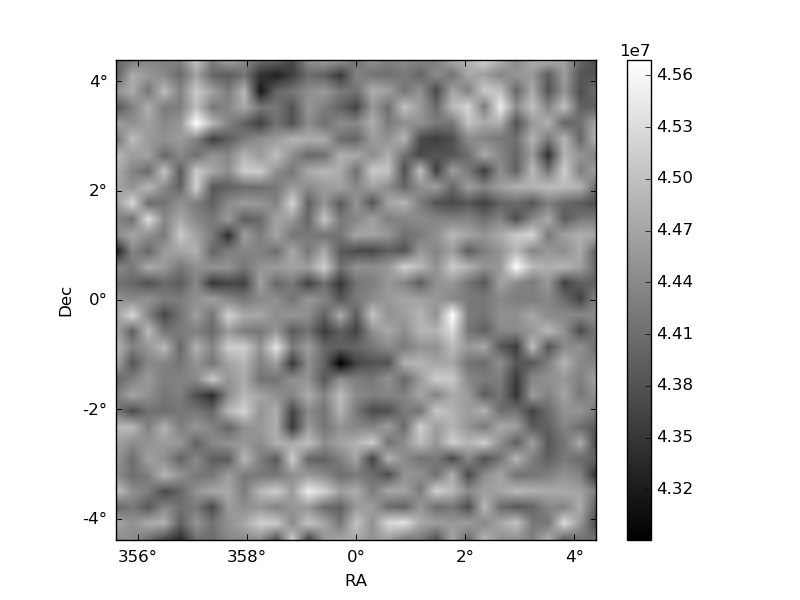
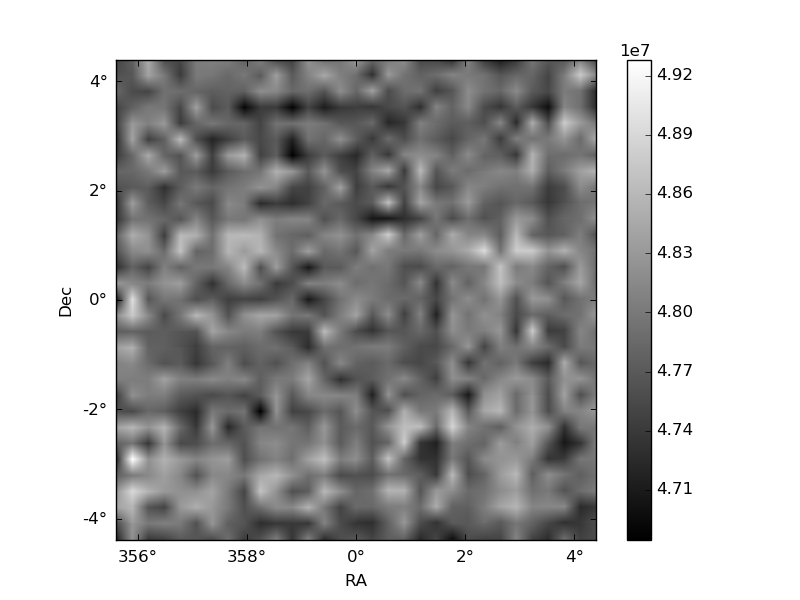
Histogram calculated using DETX and DETY for each event in the final _common_clean file
| Quadrant A | 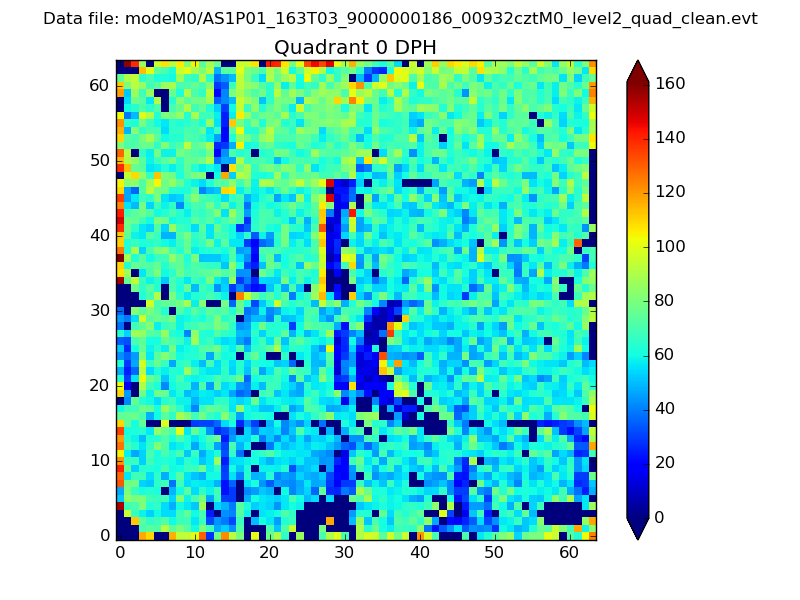 |
 |
Quadrant B |
|---|---|---|---|
| Quadrant D | 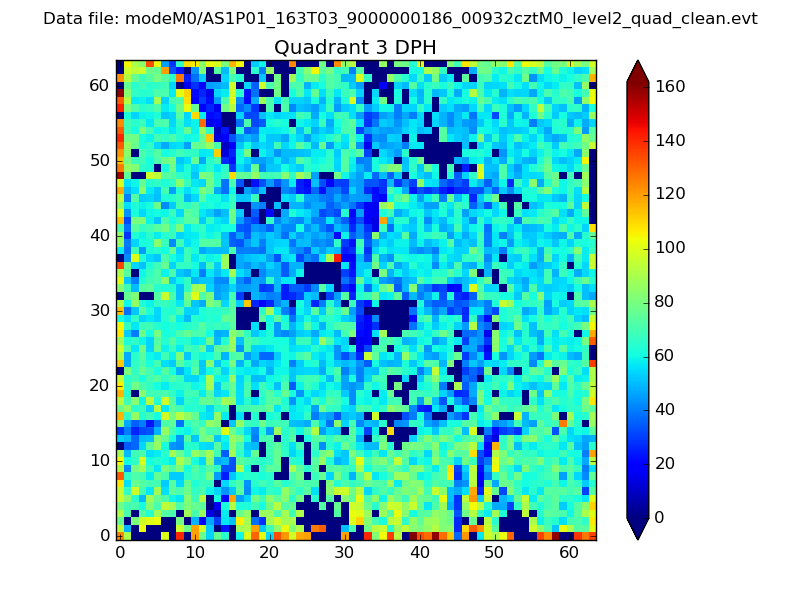 |
 |
Quadrant C |
| Plot type | Count rate plots | Images |
|---|---|---|
| Comparison with Poisson distribution Blue bars denote a histogram of data divided into 1 sec bins. Red curve is a Poisson curve with rate = median count rate of data. |
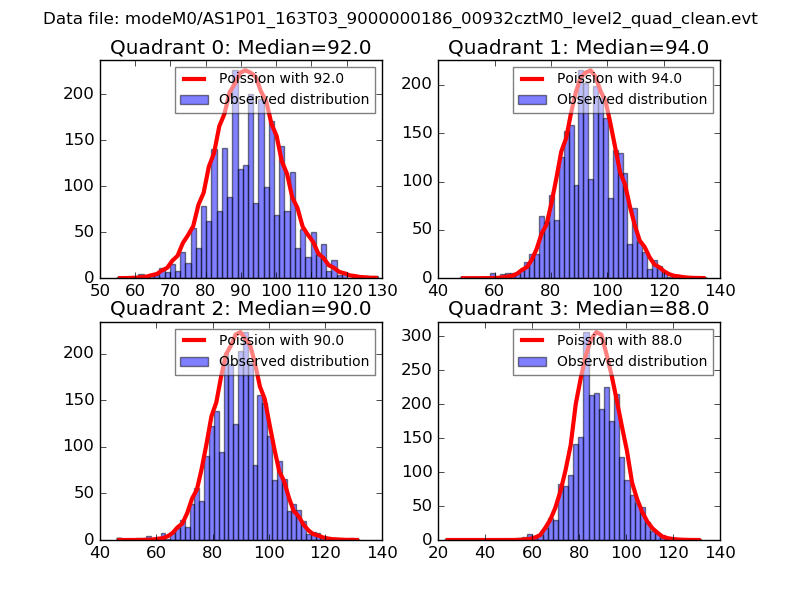 |
 |
| Quadrant-wise count rates Data is divided into 100 sec bins |
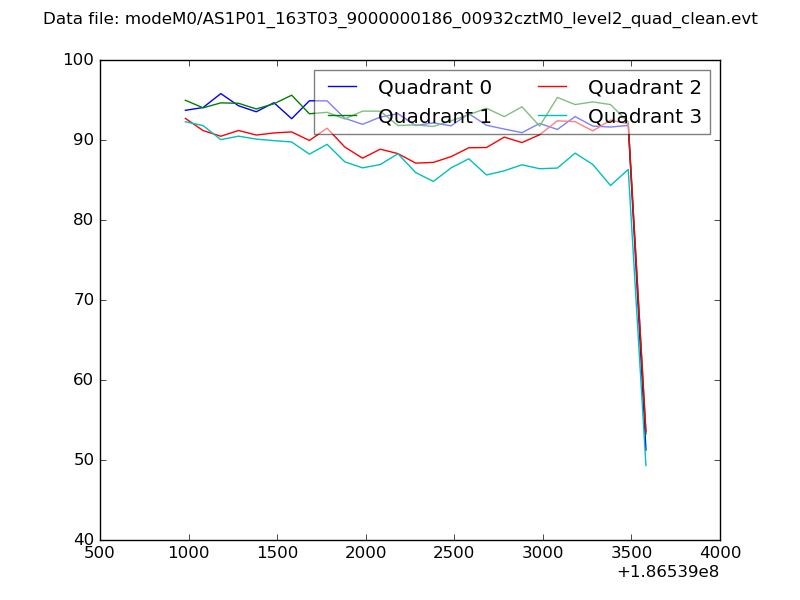 |
|
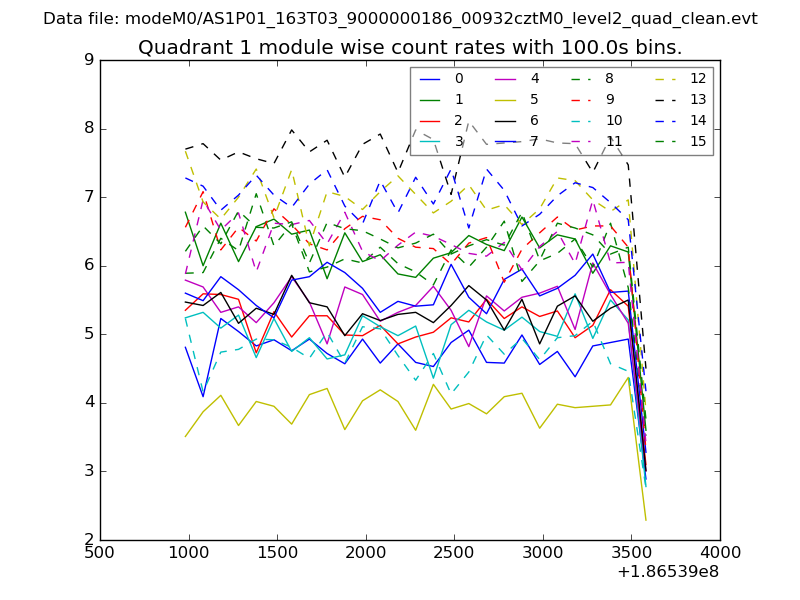
| Module-wise count rates for Quadrant A Data is divided into 100 sec bins |
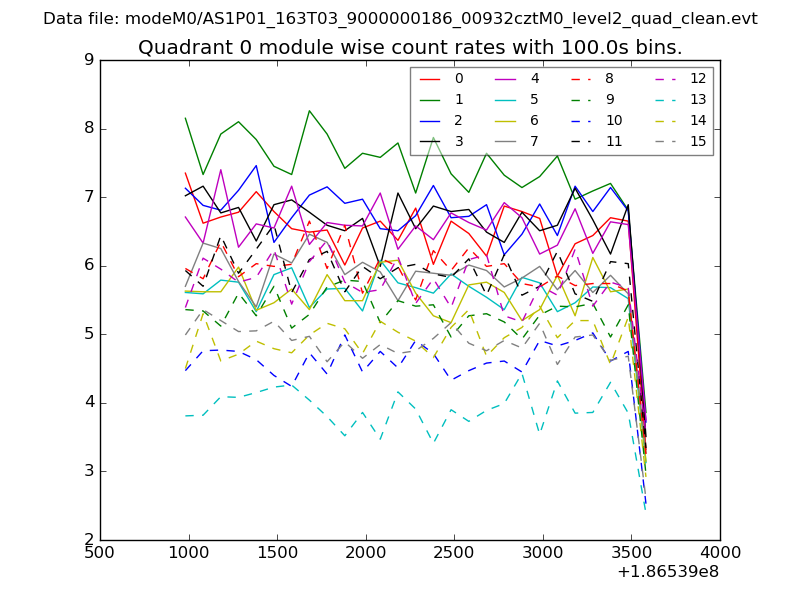 |
 |
| Module-wise count rates for Quadrant B Data is divided into 100 sec bins |
 |
 |
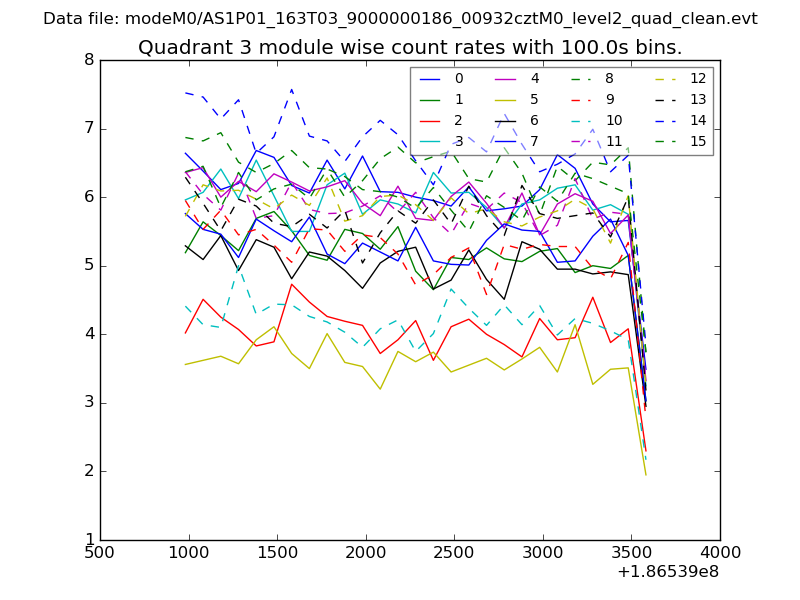
| Module-wise count rates for Quadrant C Data is divided into 100 sec bins |
 |
 |
| Module-wise count rates for Quadrant D Data is divided into 100 sec bins |
 |
 |
| Parameter | Plot |
|---|---|
| CZT HV Monitor | 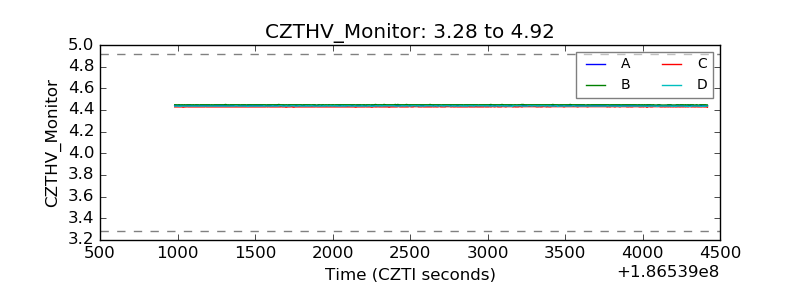 |
| D_VDD | 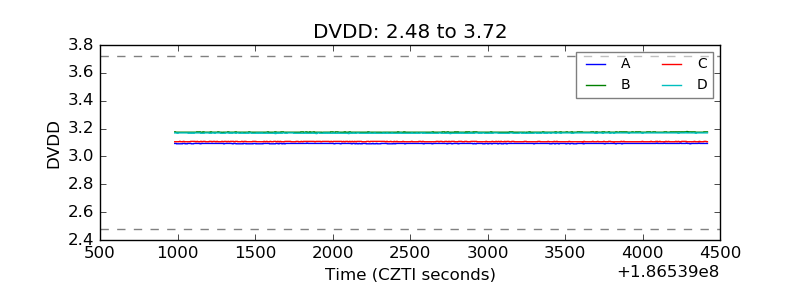 |
| Temperature 1 | 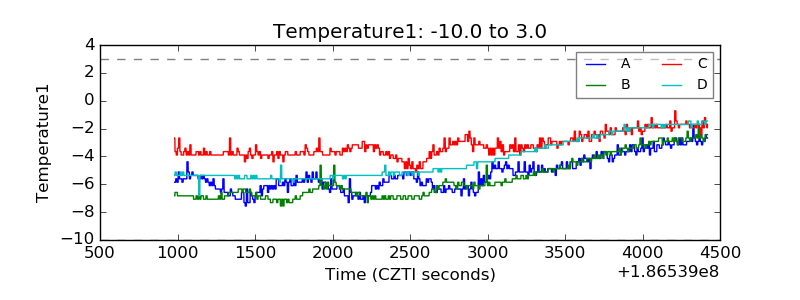 |
| Veto HV Monitor | 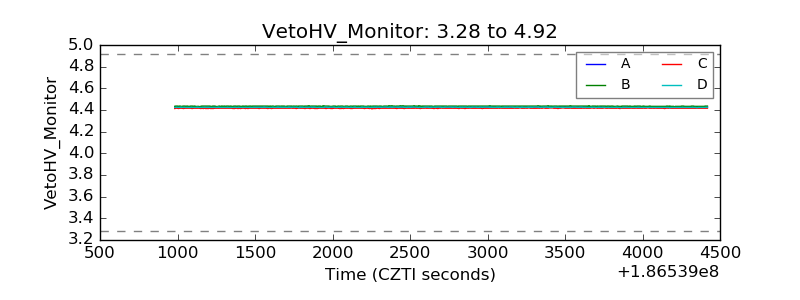 |
| Veto LLD | 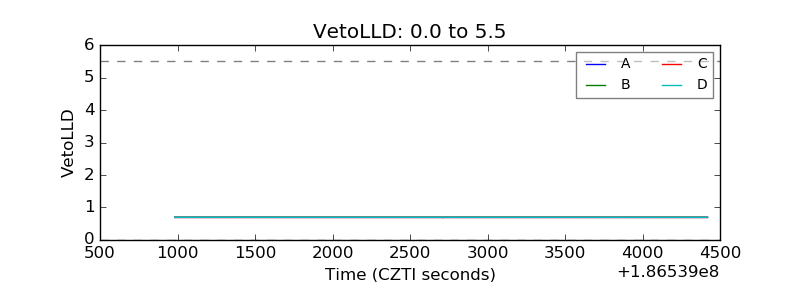 |
| Alpha Counter | 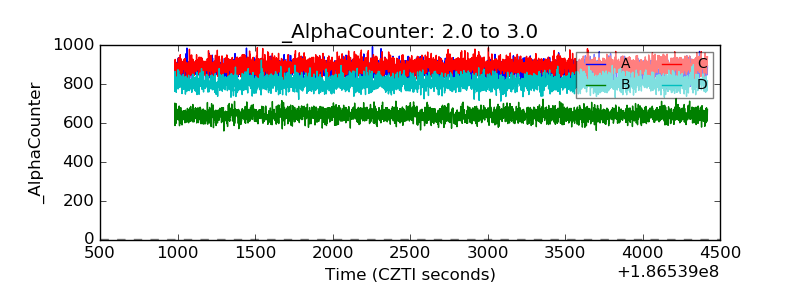 |
| _CPM_Rate | 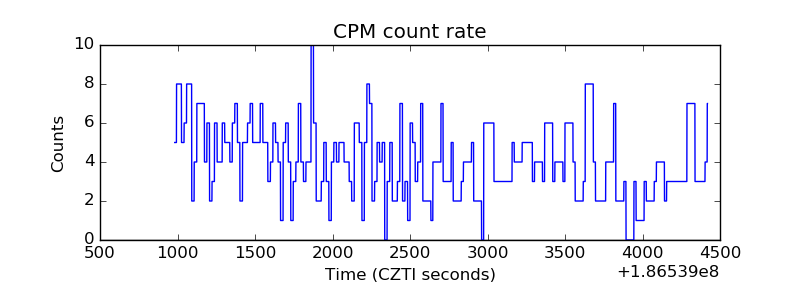 |
| CZT Counter | 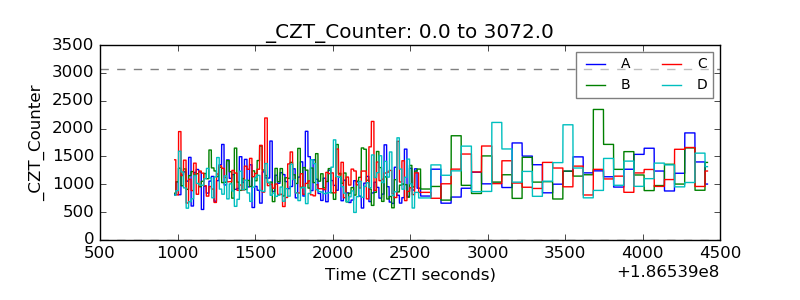 |
| +2.5 Volts monitor |  |
| +5 Volts monitor | 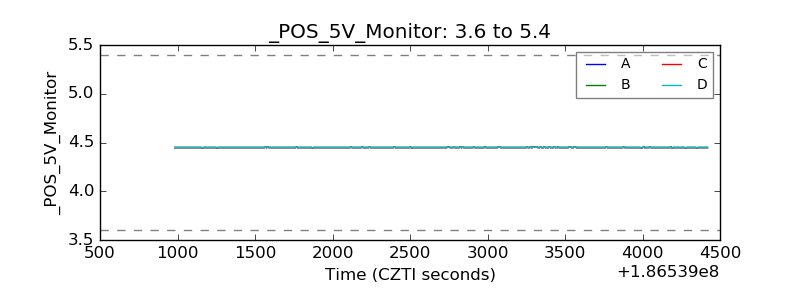 |
| _ROLL_ROT | 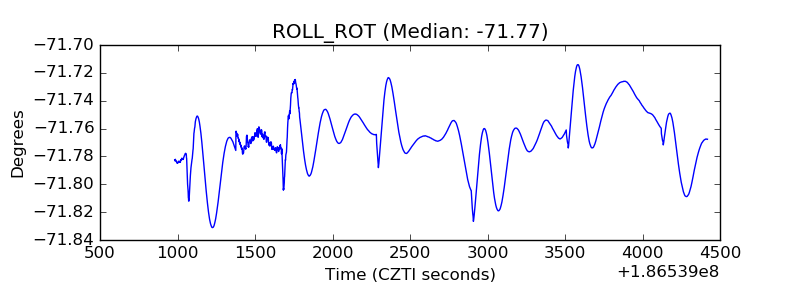 |
| _Roll_DEC | 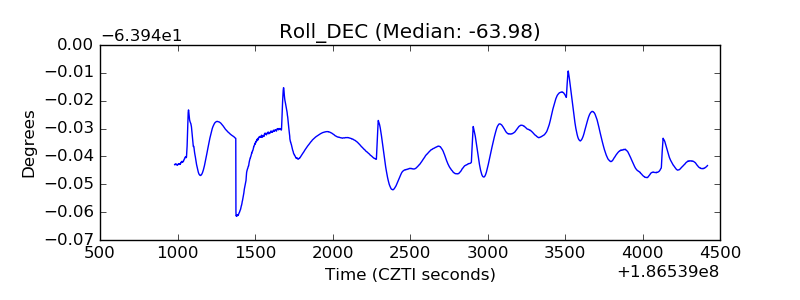 |
| _Roll_RA | 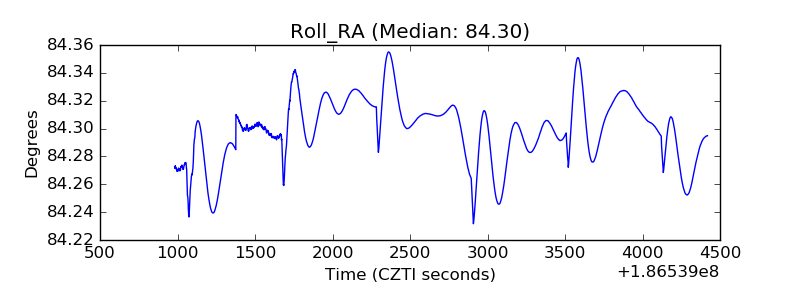 |
| Veto Counter | 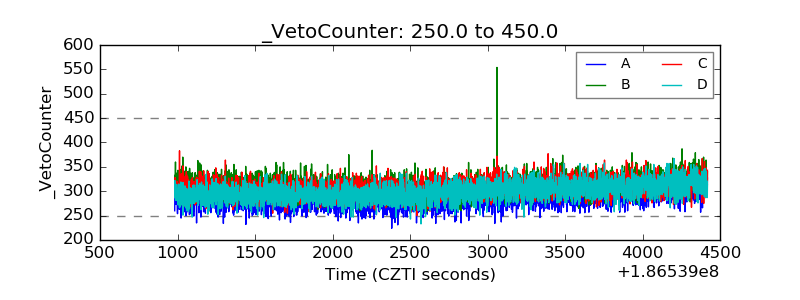 |