| Param | Original file | Final file |
|---|---|---|
| Filename | modeM0/AS1P01_998T01_9000000188_00933cztM0_level2.evt | modeM0/AS1P01_998T01_9000000188_00933cztM0_level2_quad_clean.evt |
| Size (bytes) | 1,014,966,720 | 94,415,040 |
| Size | 967.9 MB | 90.0 MB |
| Events in quadrant A | 7,506,905 | 614,569 |
| Events in quadrant B | 7,933,384 | 614,114 |
| Events in quadrant C | 7,401,781 | 603,397 |
| Events in quadrant D | 7,472,695 | 582,021 |
| Mode M0 | |||
|---|---|---|---|
| Quadrant | BADHDUFLAG | Total packets | Discarded packets |
| A | 0 | 26818 | 0 |
| B | 0 | 28087 | 0 |
| C | 0 | 26504 | 0 |
| D | 0 | 26745 | 0 |
| Mode M9 | |||
|---|---|---|---|
| Quadrant | BADHDUFLAG | Total packets | Discarded packets |
| A | 0 | 5 | 0 |
| B | 0 | 5 | 0 |
| C | 0 | 5 | 0 |
| D | 0 | 5 | 0 |
| Mode SS | |||
|---|---|---|---|
| Quadrant | BADHDUFLAG | Total packets | Discarded packets |
| A | 0 | 130 | 0 |
| B | 0 | 130 | 0 |
| C | 0 | 130 | 0 |
| D | 0 | 130 | 0 |
| Quadrant | Total seconds | Saturated seconds | Saturation percentage |
|---|---|---|---|
| A | 6380 | 2 | 0.031348% |
| B | 6380 | 10 | 0.156740% |
| C | 6380 | 4 | 0.062696% |
| D | 6379 | 149 | 2.335789% |
Noise dominated data is calculated using 1-second bins in cleaned event files. If a bin has >2000 counts, and if more than 50% of those come from <1% of pixels, then it is considered to be noise-dominated and hence unusable.
| Quadrant | # 1 sec bins | Bins with >0 counts | Bins with >2000 counts | High rate bins dominated by noise | Noise dominated (total time) | Noise dominated (detector-on time) | Marked lightcurve |
|---|---|---|---|---|---|---|---|
| A | 6855 | 6381 | 125 | 125 | 1.82% | 1.96% | 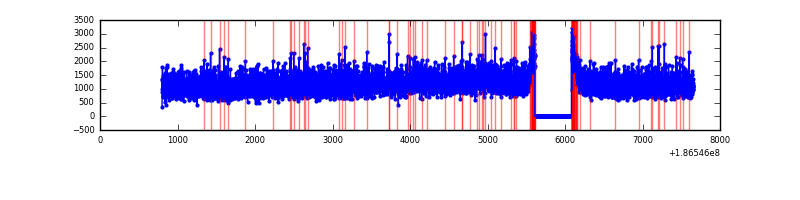 |
| B | 6855 | 6381 | 184 | 184 | 2.68% | 2.88% | 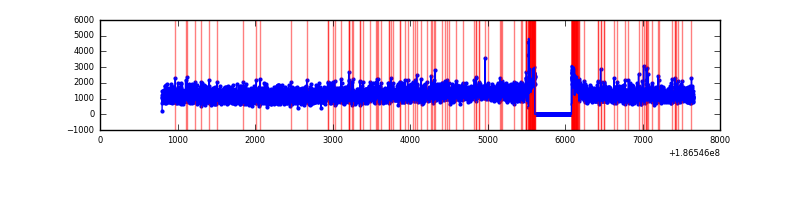 |
| C | 6855 | 6381 | 113 | 113 | 1.65% | 1.77% | 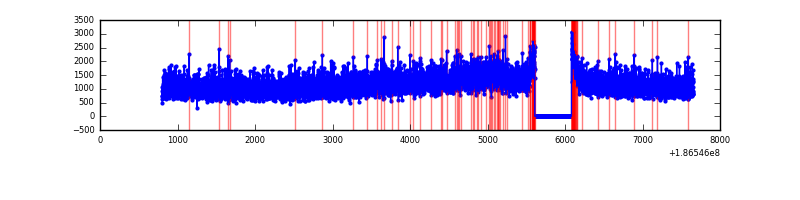 |
| D | 6854 | 6380 | 298 | 298 | 4.35% | 4.67% | 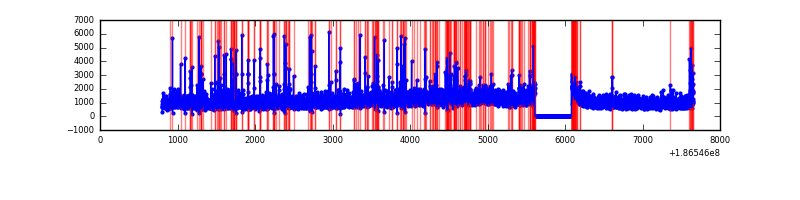 |
Top three noisy pixels from each quadrant. If the there are fewer than three noisy pixels in the level2.evt file, extra rows are filled as -1
| Pixel properties | Quadrant properties | ||||||
|---|---|---|---|---|---|---|---|
| Quadrant | DetID | PixID | Counts | Sigma | Mean | Median | Sigma |
| A | 14 | 170 | 28968 | 57.66 | 1947 | 1965 | 468.3 |
| A | 15 | 233 | 9907 | 16.96 | 1947 | 1965 | 468.3 |
| A | 11 | 79 | 7259 | 11.3 | 1947 | 1965 | 468.3 |
| B | 15 | 22 | 50375 | 101.24 | 2026 | 2036 | 477.5 |
| B | 12 | 52 | 45378 | 90.78 | 2026 | 2036 | 477.5 |
| B | 5 | 249 | 35897 | 70.92 | 2026 | 2036 | 477.5 |
| C | 15 | 241 | 225228 | 441.85 | 1818 | 1882 | 505.5 |
| C | 3 | 111 | 23220 | 42.21 | 1818 | 1882 | 505.5 |
| C | 9 | 144 | 22382 | 40.56 | 1818 | 1882 | 505.5 |
| D | 12 | 188 | 815354 | 1513.55 | 1739 | 1803 | 537.5 |
| D | 1 | 4 | 144388 | 265.27 | 1739 | 1803 | 537.5 |
| D | 13 | 252 | 14495 | 23.61 | 1739 | 1803 | 537.5 |
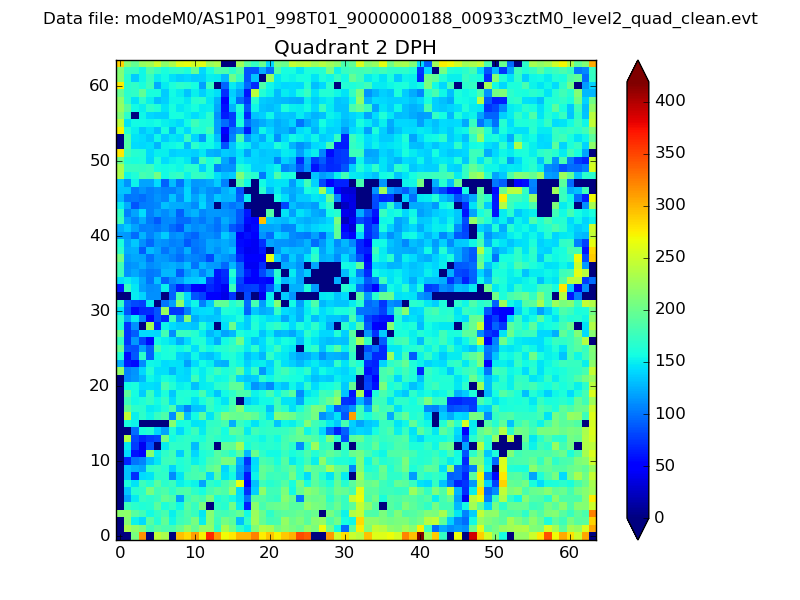
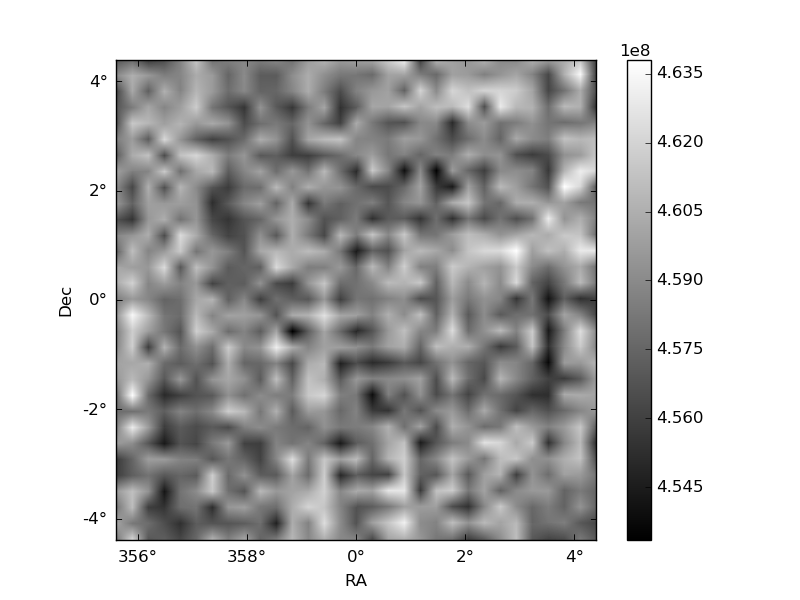
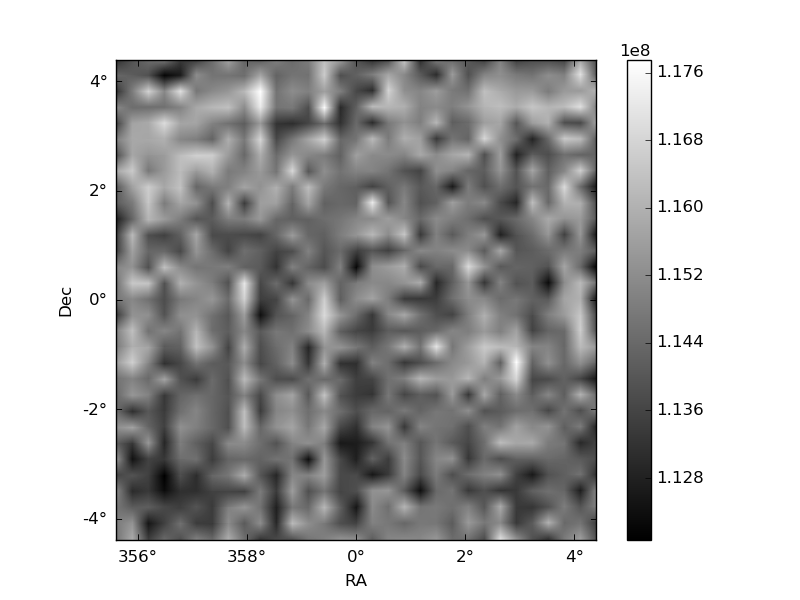
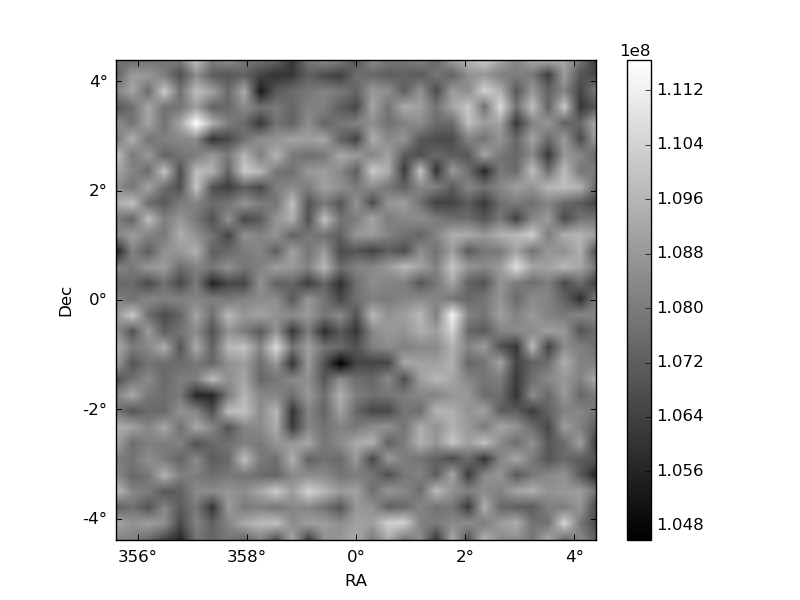
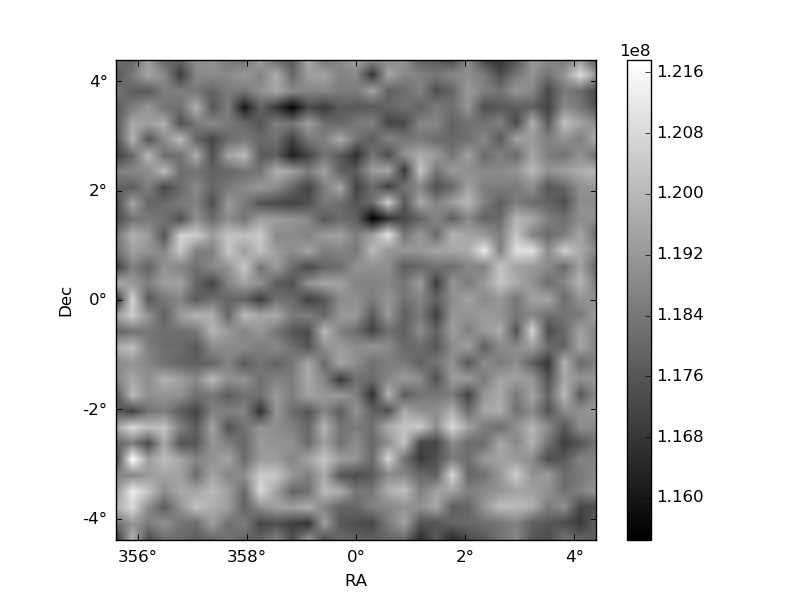
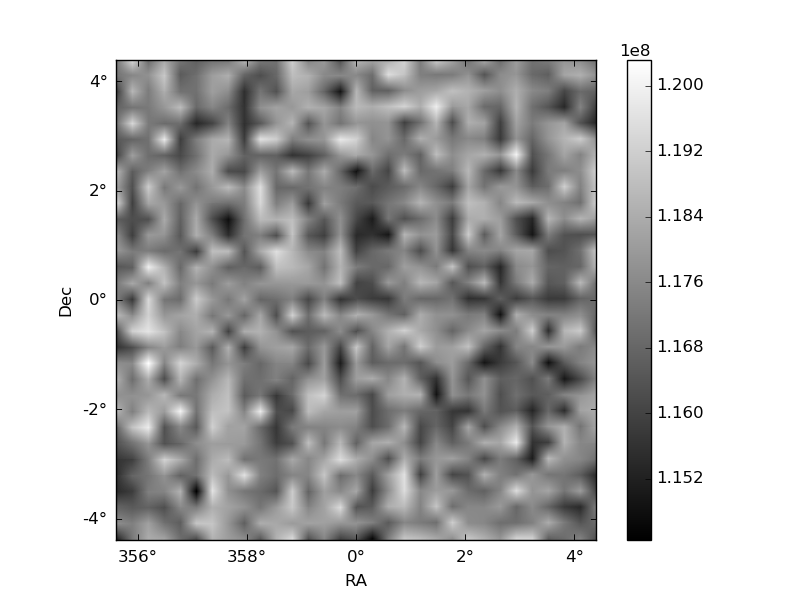
Histogram calculated using DETX and DETY for each event in the final _common_clean file
| Quadrant A | 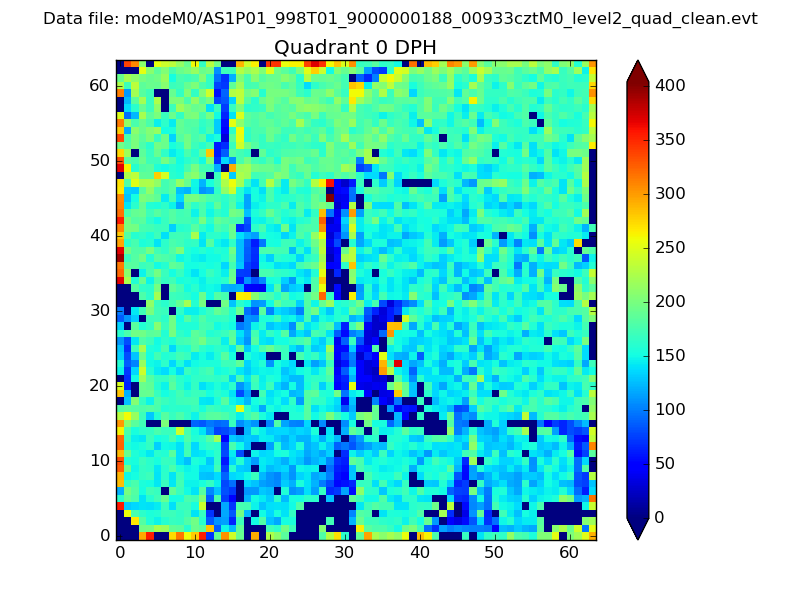 |
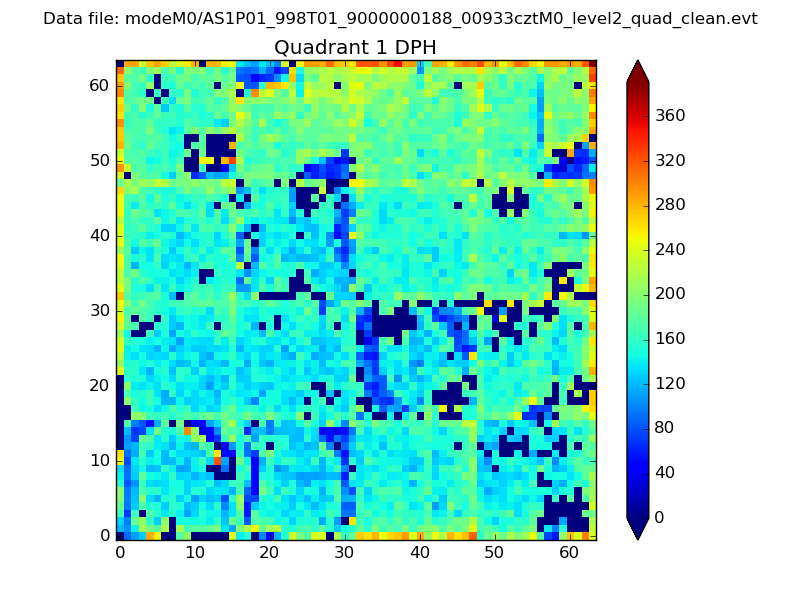 |
Quadrant B |
|---|---|---|---|
| Quadrant D | 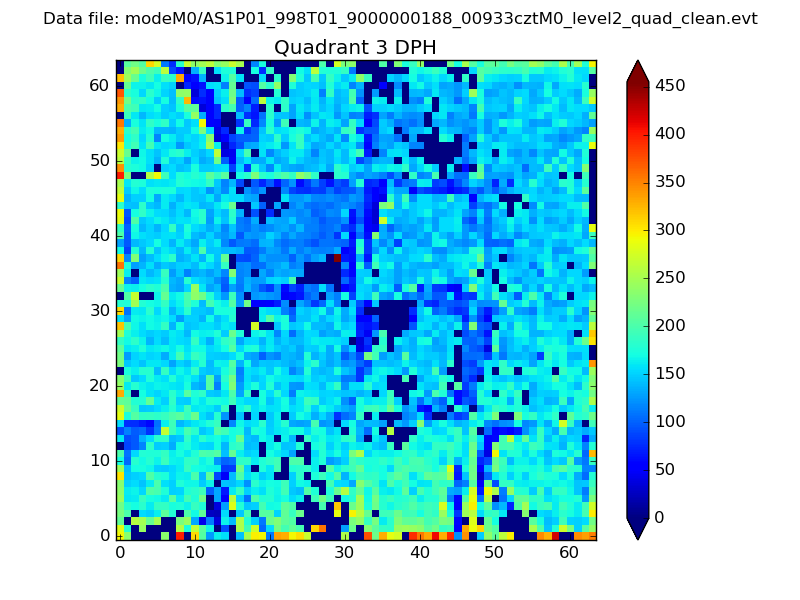 |
 |
Quadrant C |
| Plot type | Count rate plots | Images |
|---|---|---|
| Comparison with Poisson distribution Blue bars denote a histogram of data divided into 1 sec bins. Red curve is a Poisson curve with rate = median count rate of data. |
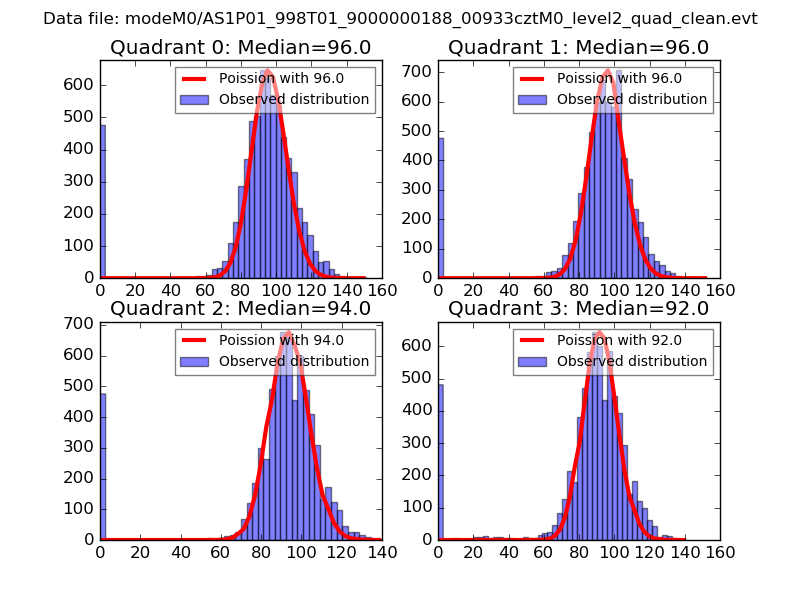 |
 |
| Quadrant-wise count rates Data is divided into 100 sec bins |
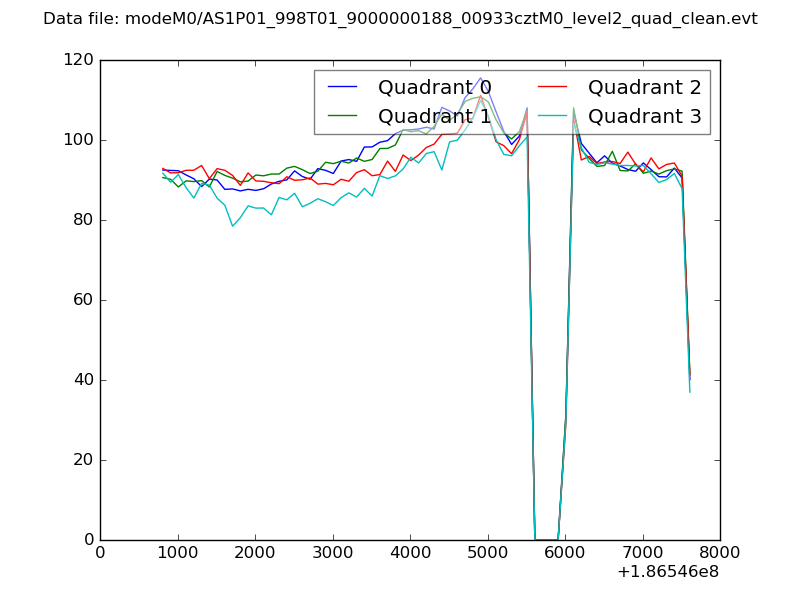 |
|
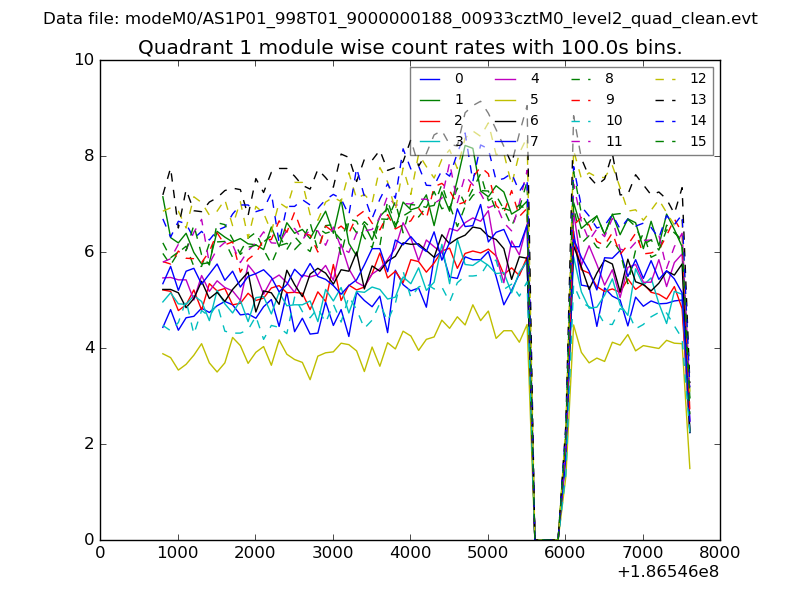
| Module-wise count rates for Quadrant A Data is divided into 100 sec bins |
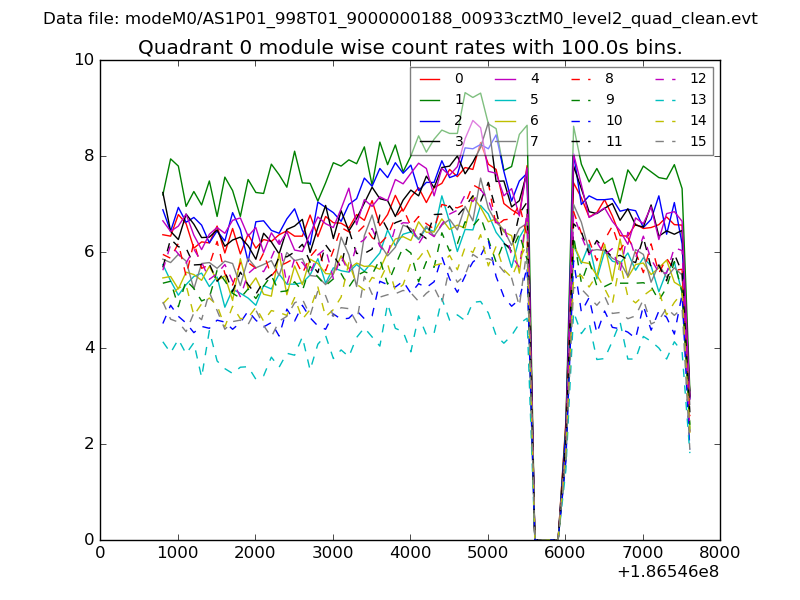 |
 |
| Module-wise count rates for Quadrant B Data is divided into 100 sec bins |
 |
 |
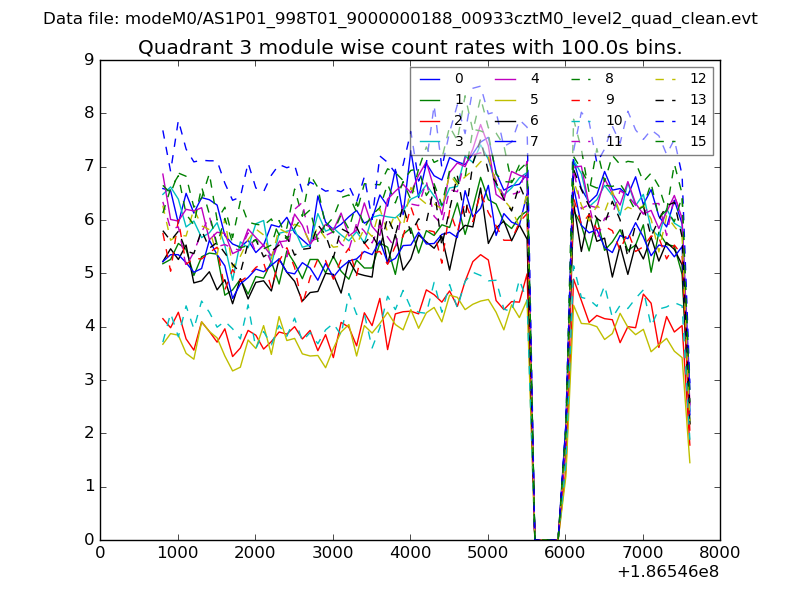
| Module-wise count rates for Quadrant C Data is divided into 100 sec bins |
 |
 |
| Module-wise count rates for Quadrant D Data is divided into 100 sec bins |
 |
 |
| Parameter | Plot |
|---|---|
| CZT HV Monitor |  |
| D_VDD |  |
| Temperature 1 | 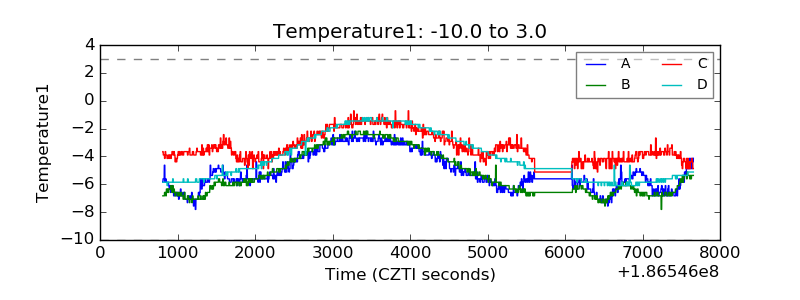 |
| Veto HV Monitor | 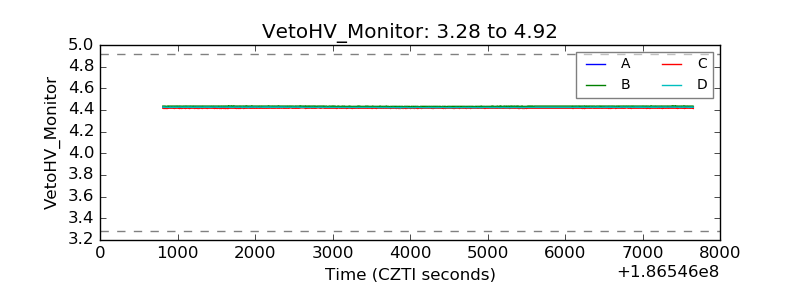 |
| Veto LLD | 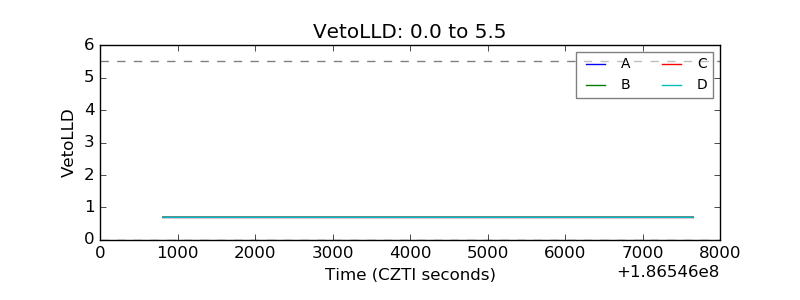 |
| Alpha Counter | 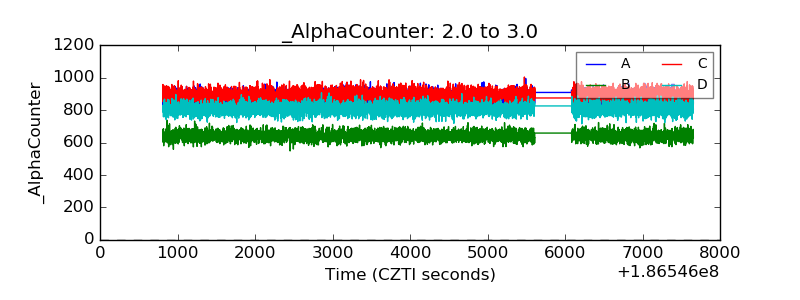 |
| _CPM_Rate | 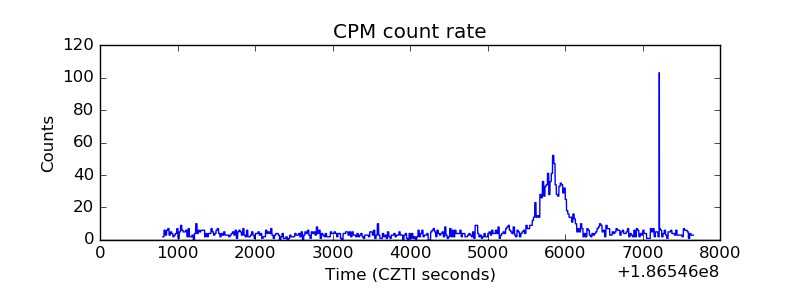 |
| CZT Counter | 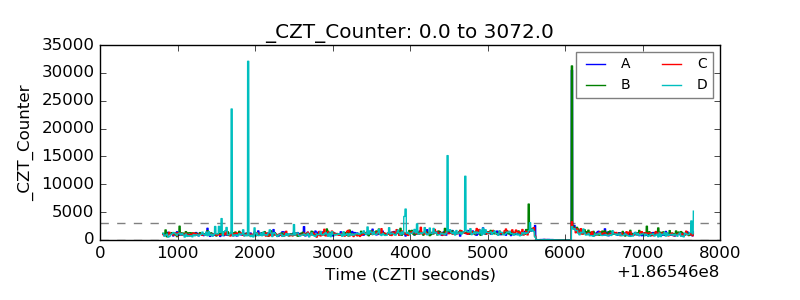 |
| +2.5 Volts monitor |  |
| +5 Volts monitor |  |
| _ROLL_ROT | 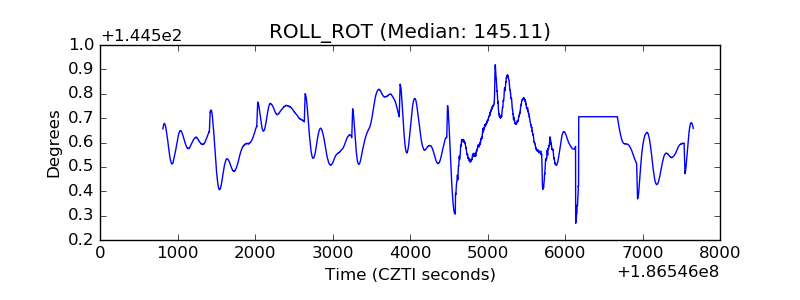 |
| _Roll_DEC | 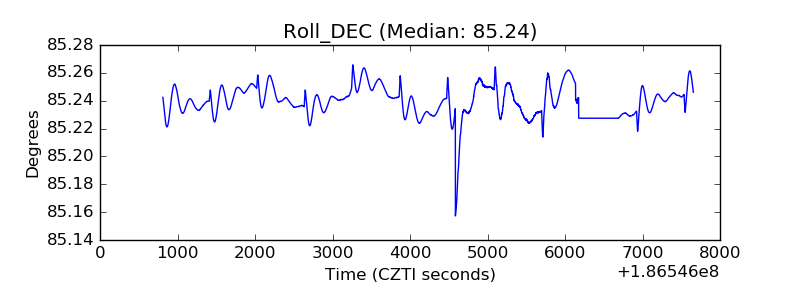 |
| _Roll_RA | 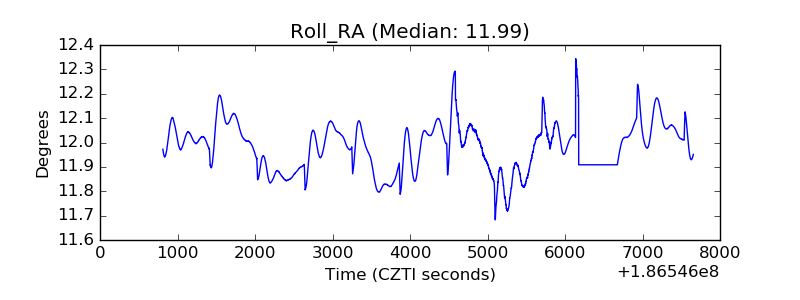 |
| Veto Counter | 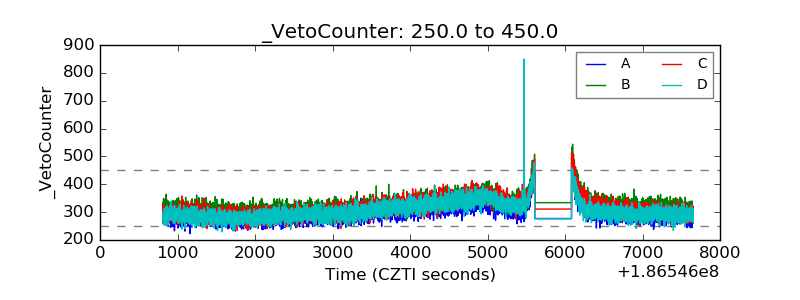 |