| Param | Original file | Final file |
|---|---|---|
| Filename | modeM0/AS1P01_998T01_9000000188_00934cztM0_level2.evt | modeM0/AS1P01_998T01_9000000188_00934cztM0_level2_quad_clean.evt |
| Size (bytes) | 1,041,215,040 | 97,058,880 |
| Size | 993.0 MB | 92.6 MB |
| Events in quadrant A | 7,768,371 | 631,344 |
| Events in quadrant B | 8,265,009 | 630,797 |
| Events in quadrant C | 7,624,428 | 618,568 |
| Events in quadrant D | 7,440,130 | 601,118 |
| Mode M0 | |||
|---|---|---|---|
| Quadrant | BADHDUFLAG | Total packets | Discarded packets |
| A | 0 | 27710 | 0 |
| B | 0 | 29179 | 0 |
| C | 0 | 27271 | 0 |
| D | 0 | 26830 | 0 |
| Mode M9 | |||
|---|---|---|---|
| Quadrant | BADHDUFLAG | Total packets | Discarded packets |
| A | 0 | 6 | 0 |
| B | 0 | 6 | 0 |
| C | 0 | 6 | 0 |
| D | 0 | 6 | 0 |
| Mode SS | |||
|---|---|---|---|
| Quadrant | BADHDUFLAG | Total packets | Discarded packets |
| A | 0 | 134 | 0 |
| B | 0 | 134 | 0 |
| C | 0 | 134 | 0 |
| D | 0 | 134 | 0 |
| Quadrant | Total seconds | Saturated seconds | Saturation percentage |
|---|---|---|---|
| A | 6560 | 19 | 0.289634% |
| B | 6560 | 21 | 0.320122% |
| C | 6560 | 8 | 0.121951% |
| D | 6560 | 87 | 1.326220% |
Noise dominated data is calculated using 1-second bins in cleaned event files. If a bin has >2000 counts, and if more than 50% of those come from <1% of pixels, then it is considered to be noise-dominated and hence unusable.
| Quadrant | # 1 sec bins | Bins with >0 counts | Bins with >2000 counts | High rate bins dominated by noise | Noise dominated (total time) | Noise dominated (detector-on time) | Marked lightcurve |
|---|---|---|---|---|---|---|---|
| A | 7225 | 6561 | 138 | 138 | 1.91% | 2.10% | 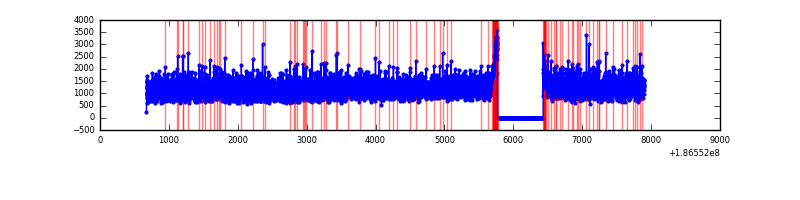 |
| B | 7225 | 6561 | 195 | 195 | 2.70% | 2.97% | 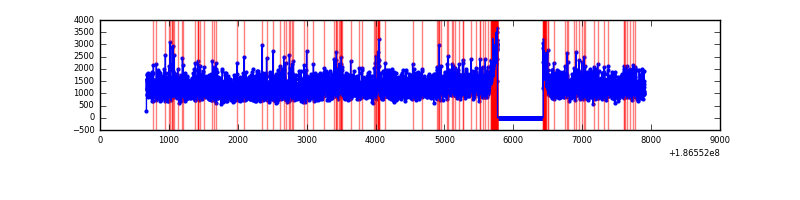 |
| C | 7225 | 6561 | 140 | 140 | 1.94% | 2.13% | 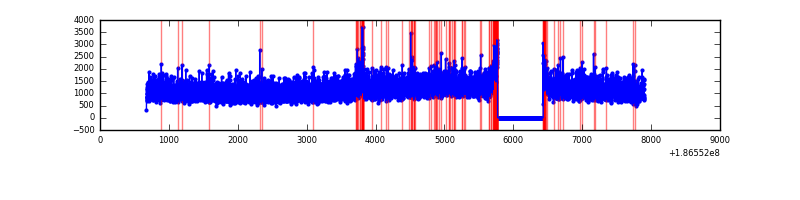 |
| D | 7225 | 6561 | 213 | 213 | 2.95% | 3.25% | 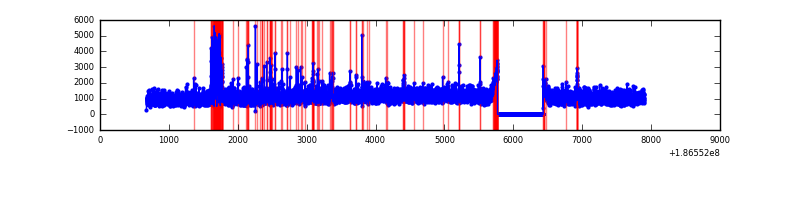 |
Top three noisy pixels from each quadrant. If the there are fewer than three noisy pixels in the level2.evt file, extra rows are filled as -1
| Pixel properties | Quadrant properties | ||||||
|---|---|---|---|---|---|---|---|
| Quadrant | DetID | PixID | Counts | Sigma | Mean | Median | Sigma |
| A | 14 | 170 | 61226 | 122.24 | 2006 | 2022 | 484.3 |
| A | 15 | 233 | 8072 | 12.49 | 2006 | 2022 | 484.3 |
| A | 3 | 111 | 6478 | 9.2 | 2006 | 2022 | 484.3 |
| B | 0 | 182 | 100793 | 199.71 | 2091 | 2100 | 494.2 |
| B | 15 | 22 | 60122 | 117.41 | 2091 | 2100 | 494.2 |
| B | 4 | 232 | 35935 | 68.47 | 2091 | 2100 | 494.2 |
| C | 15 | 241 | 216458 | 412.42 | 1867 | 1929 | 520.2 |
| C | 9 | 144 | 63035 | 117.47 | 1867 | 1929 | 520.2 |
| C | 3 | 111 | 28368 | 50.83 | 1867 | 1929 | 520.2 |
| D | 12 | 188 | 505883 | 900.34 | 1802 | 1871 | 559.8 |
| D | 1 | 4 | 125760 | 221.31 | 1802 | 1871 | 559.8 |
| D | 2 | 33 | 35391 | 59.88 | 1802 | 1871 | 559.8 |
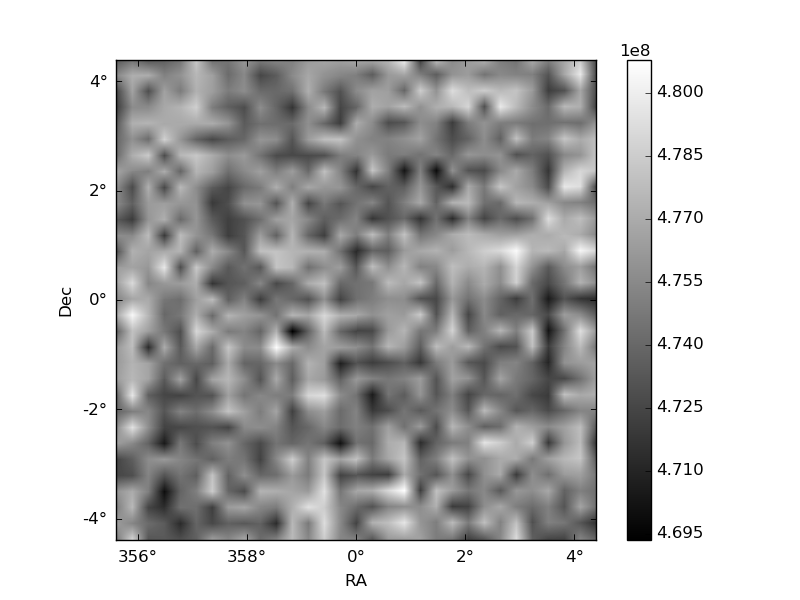
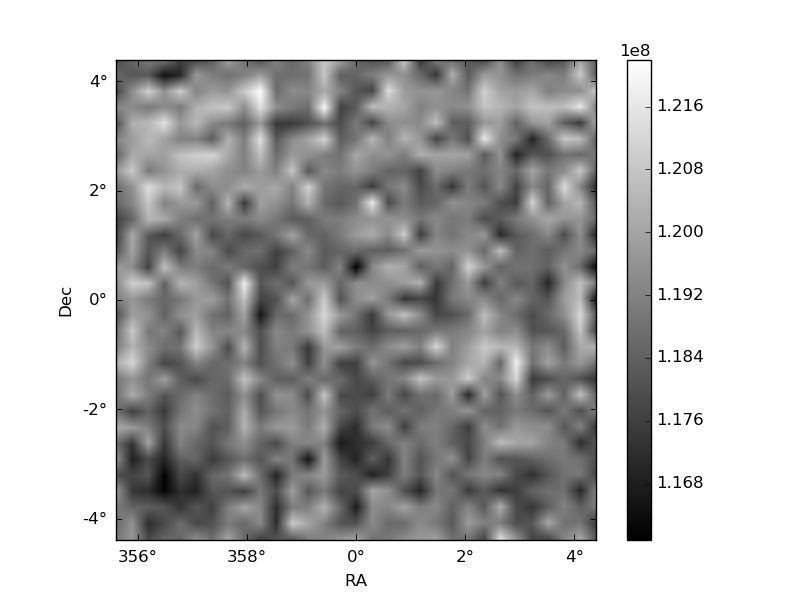
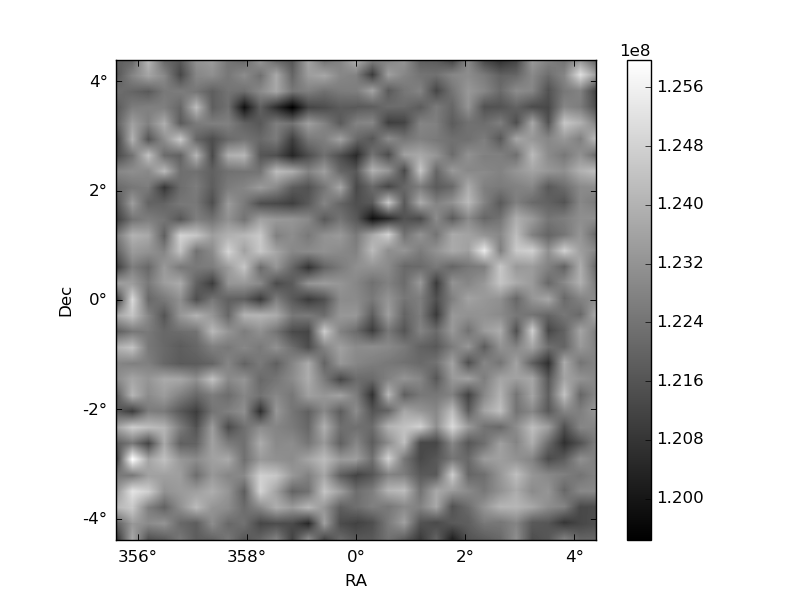
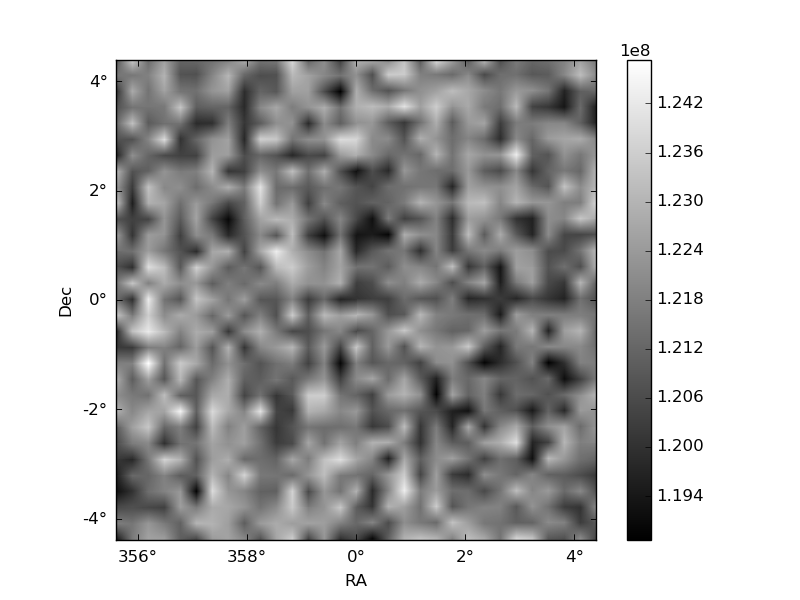
Histogram calculated using DETX and DETY for each event in the final _common_clean file
| Quadrant A | 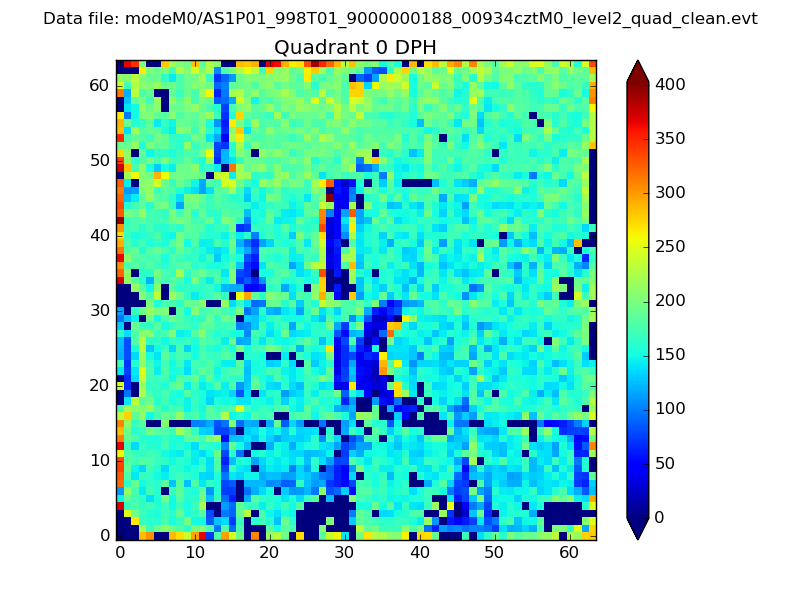 |
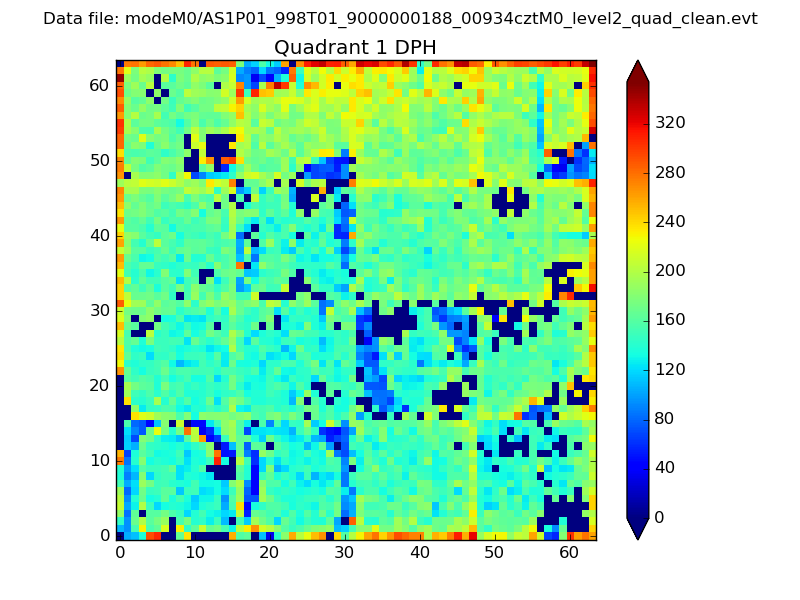 |
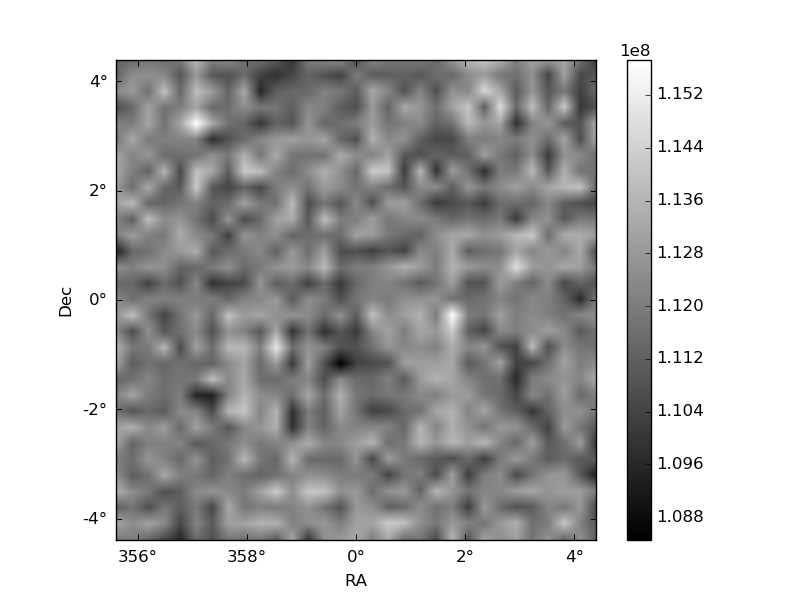
Quadrant B |
|---|---|---|---|
| Quadrant D | 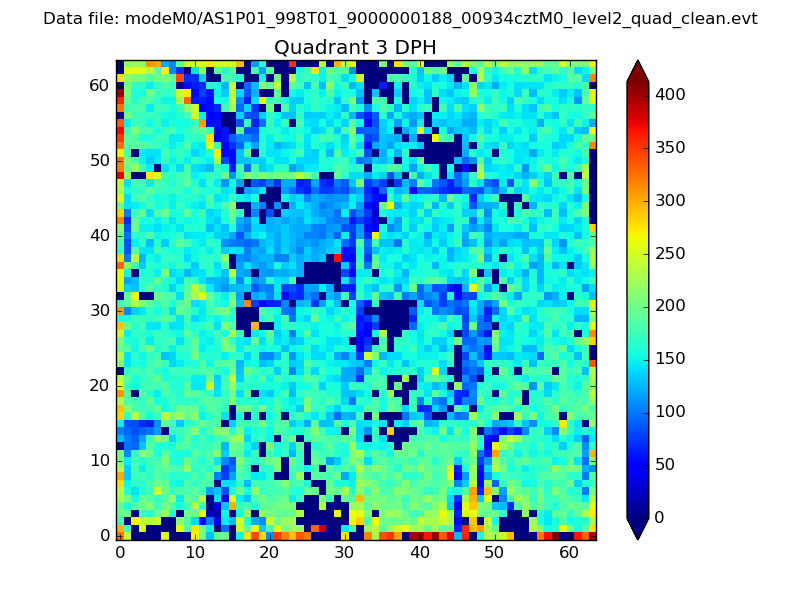 |
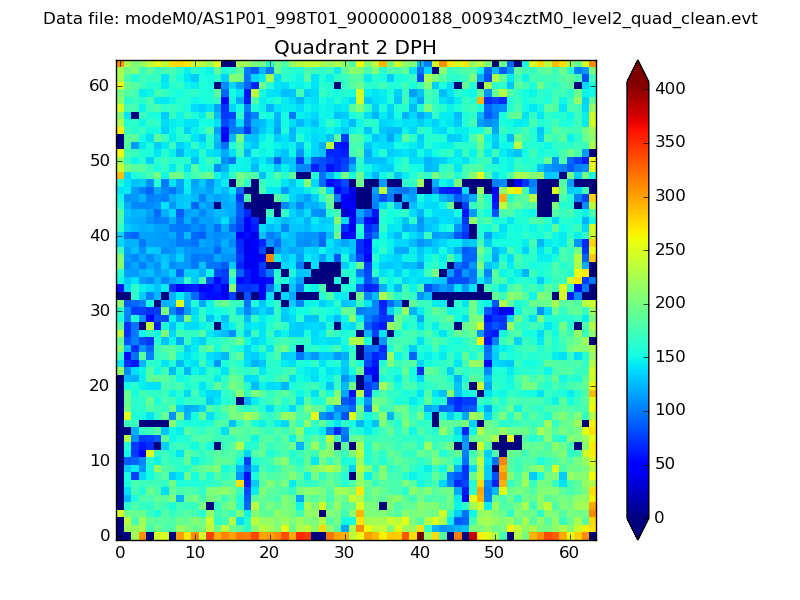 |
Quadrant C |
| Plot type | Count rate plots | Images |
|---|---|---|
| Comparison with Poisson distribution Blue bars denote a histogram of data divided into 1 sec bins. Red curve is a Poisson curve with rate = median count rate of data. |
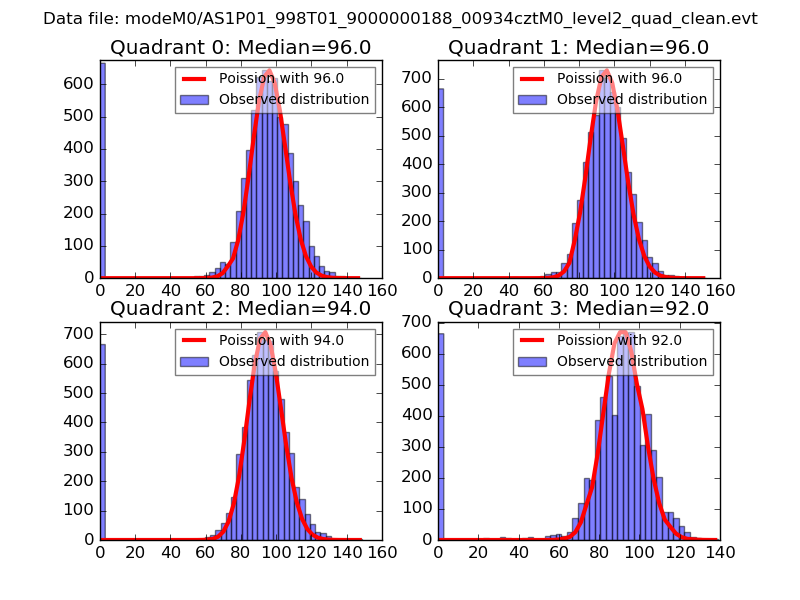 |
 |
| Quadrant-wise count rates Data is divided into 100 sec bins |
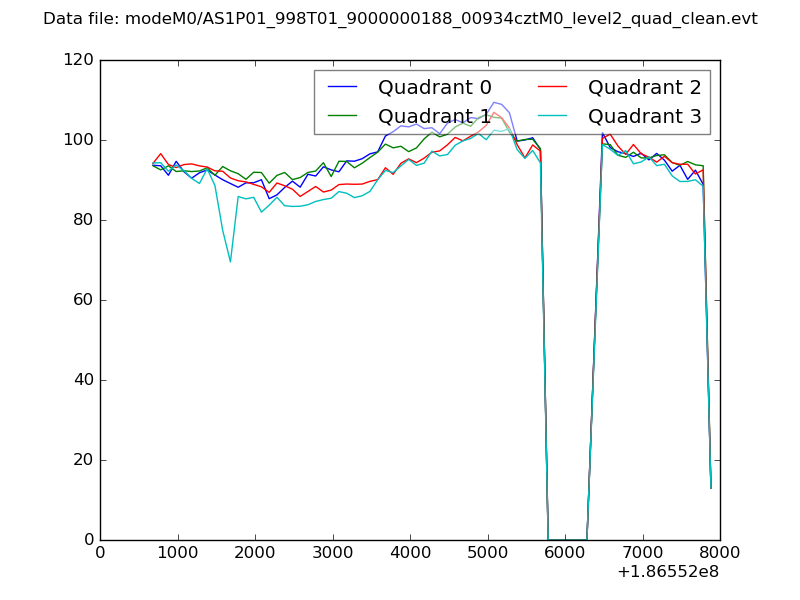 |
|
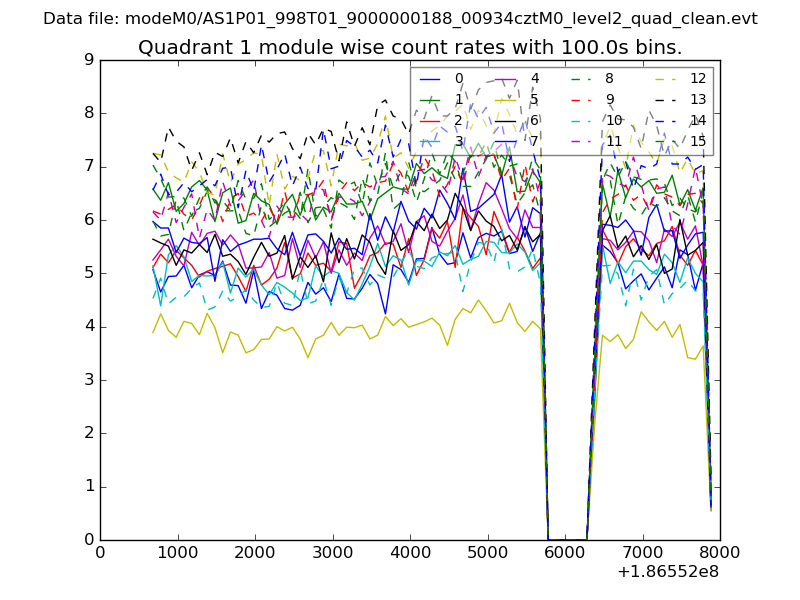
| Module-wise count rates for Quadrant A Data is divided into 100 sec bins |
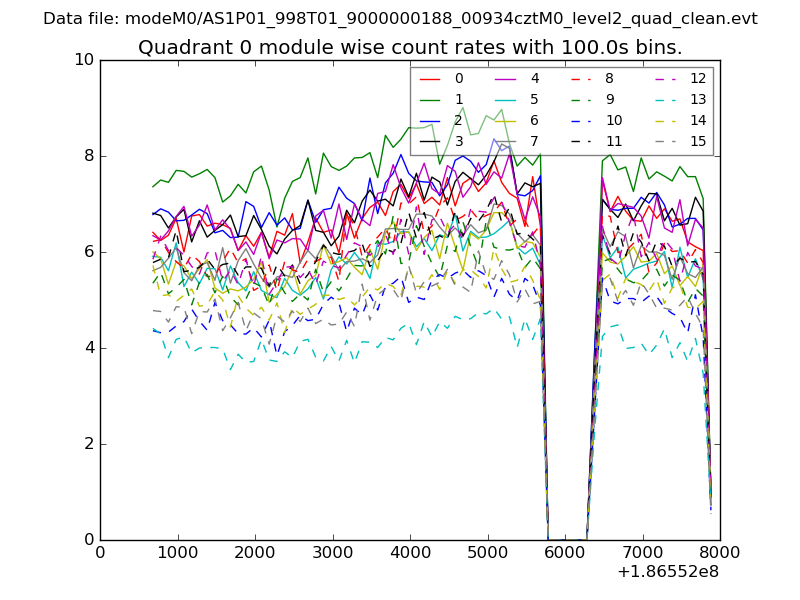 |
 |
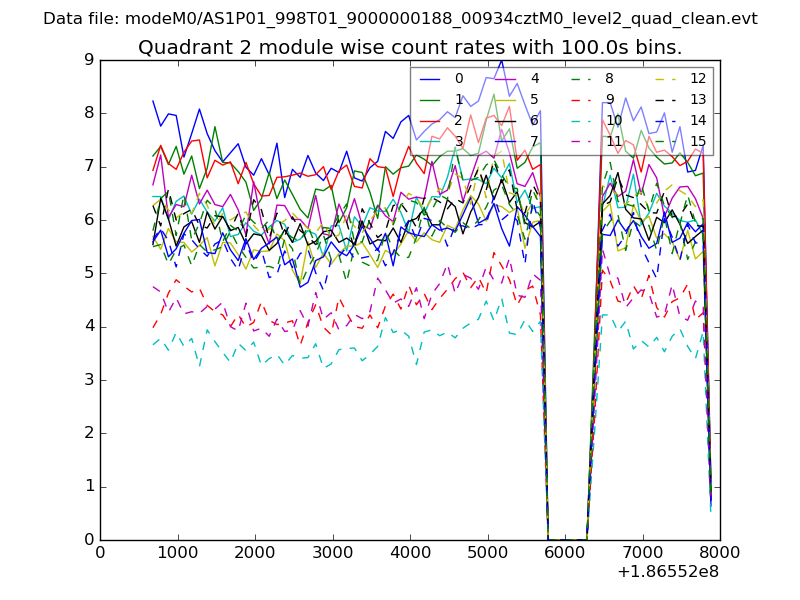
| Module-wise count rates for Quadrant B Data is divided into 100 sec bins |
 |
 |
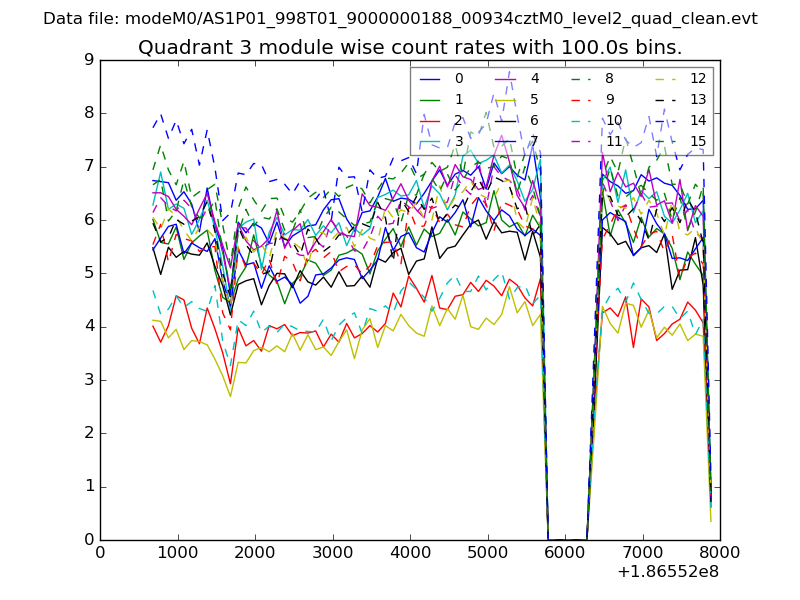
| Module-wise count rates for Quadrant C Data is divided into 100 sec bins |
 |
 |
| Module-wise count rates for Quadrant D Data is divided into 100 sec bins |
 |
 |
| Parameter | Plot |
|---|---|
| CZT HV Monitor | 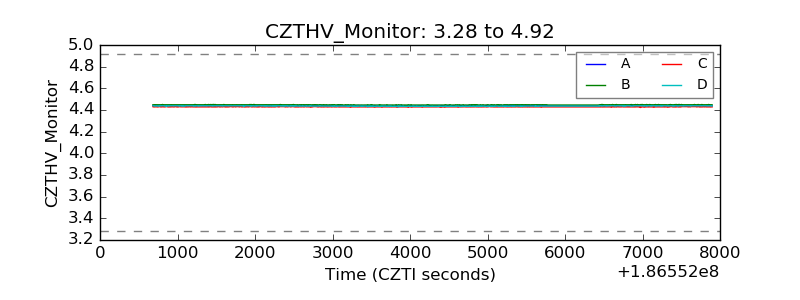 |
| D_VDD | 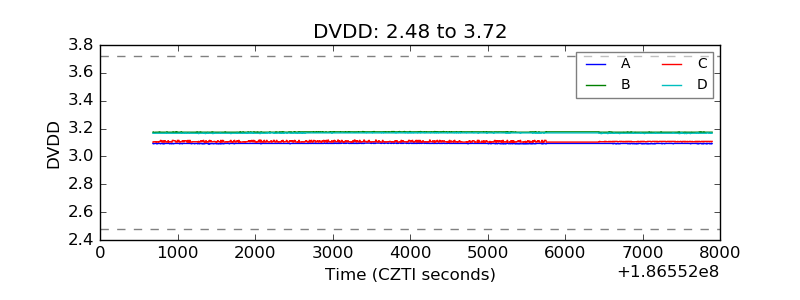 |
| Temperature 1 | 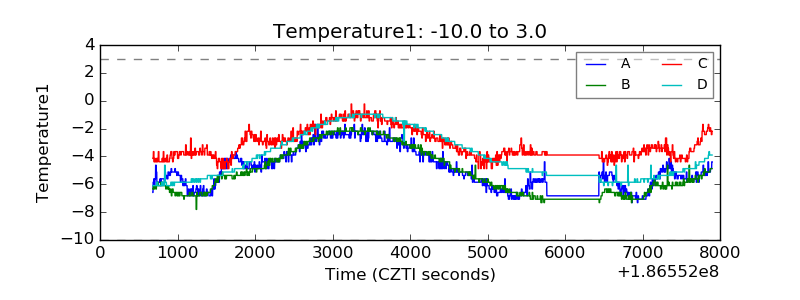 |
| Veto HV Monitor | 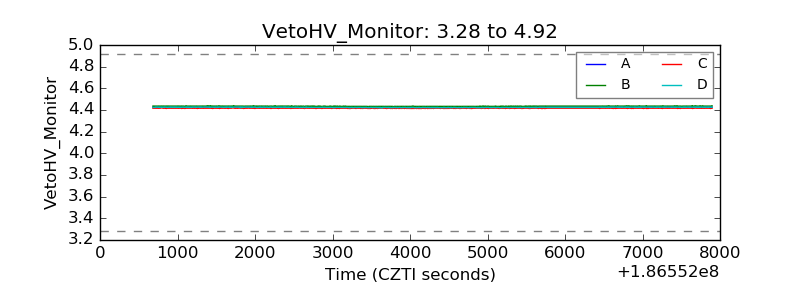 |
| Veto LLD | 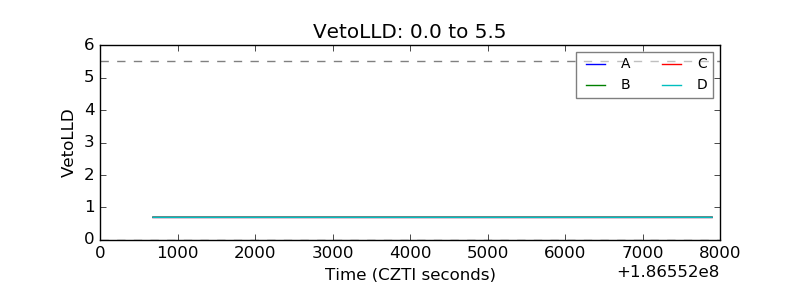 |
| Alpha Counter | 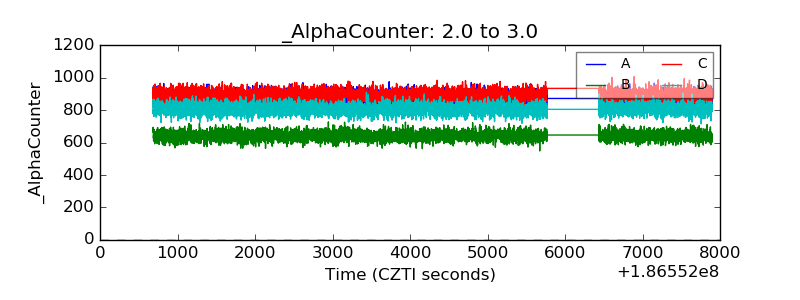 |
| _CPM_Rate | 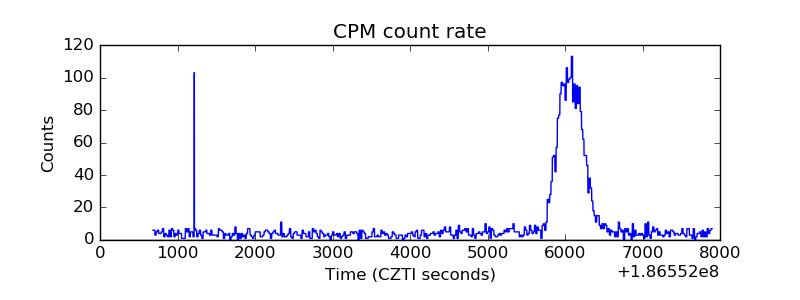 |
| CZT Counter | 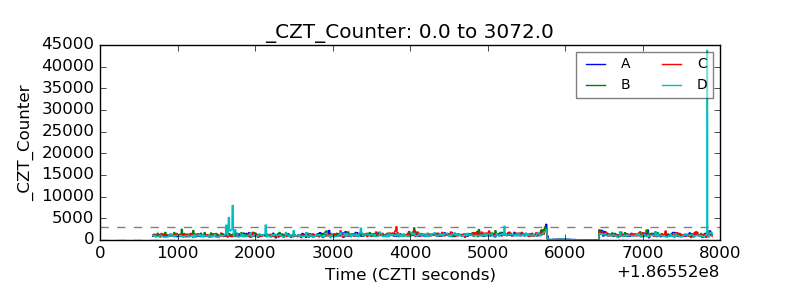 |
| +2.5 Volts monitor |  |
| +5 Volts monitor |  |
| _ROLL_ROT | 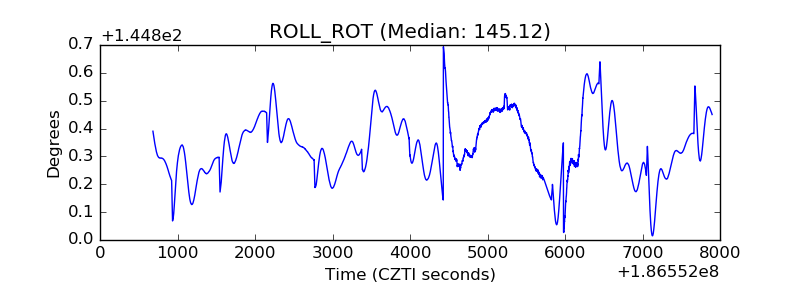 |
| _Roll_DEC |  |
| _Roll_RA | 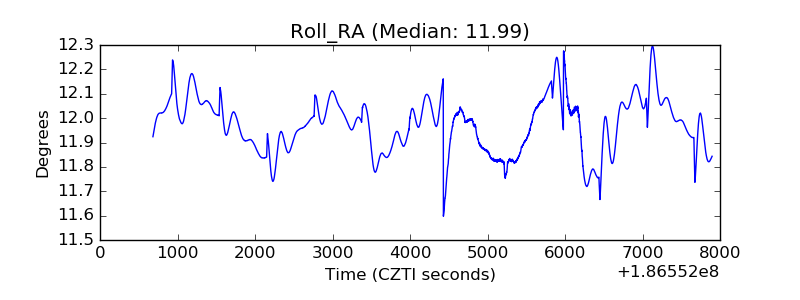 |
| Veto Counter | 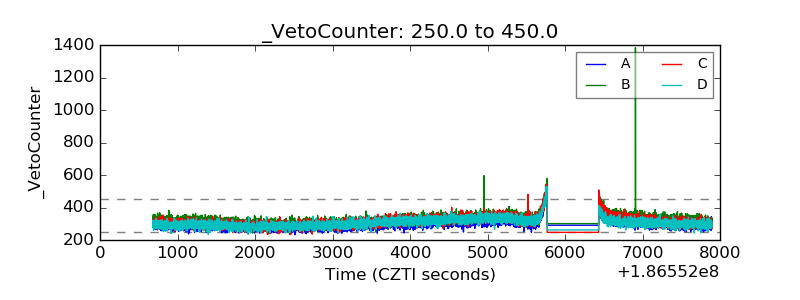 |