| Param | Original file | Final file |
|---|---|---|
| Filename | modeM0/AS1P01_998T01_9000000188_00938cztM0_level2.evt | modeM0/AS1P01_998T01_9000000188_00938cztM0_level2_quad_clean.evt |
| Size (bytes) | 2,750,918,400 | 102,767,040 |
| Size | 2.6 GB | 98.0 MB |
| Events in quadrant A | 19,528,082 | 508,213 |
| Events in quadrant B | 20,958,514 | 502,626 |
| Events in quadrant C | 19,236,433 | 491,719 |
| Events in quadrant D | 22,502,480 | 471,231 |
| Mode M0 | |||
|---|---|---|---|
| Quadrant | BADHDUFLAG | Total packets | Discarded packets |
| A | 0 | 69702 | 0 |
| B | 0 | 74020 | 0 |
| C | 0 | 68850 | 0 |
| D | 0 | 78580 | 0 |
| Mode M9 | |||
|---|---|---|---|
| Quadrant | BADHDUFLAG | Total packets | Discarded packets |
| A | 0 | 29 | 0 |
| B | 0 | 29 | 0 |
| C | 0 | 29 | 0 |
| D | 0 | 29 | 0 |
| Mode SS | |||
|---|---|---|---|
| Quadrant | BADHDUFLAG | Total packets | Discarded packets |
| A | 0 | 336 | 0 |
| B | 0 | 336 | 0 |
| C | 0 | 336 | 0 |
| D | 0 | 336 | 0 |
| Quadrant | Total seconds | Saturated seconds | Saturation percentage |
|---|---|---|---|
| A | 16488 | 90 | 0.545852% |
| B | 16488 | 130 | 0.788452% |
| C | 16488 | 33 | 0.200146% |
| D | 16488 | 518 | 3.141679% |
Noise dominated data is calculated using 1-second bins in cleaned event files. If a bin has >2000 counts, and if more than 50% of those come from <1% of pixels, then it is considered to be noise-dominated and hence unusable.
| Quadrant | # 1 sec bins | Bins with >0 counts | Bins with >2000 counts | High rate bins dominated by noise | Noise dominated (total time) | Noise dominated (detector-on time) | Marked lightcurve |
|---|---|---|---|---|---|---|---|
| A | 19378 | 16491 | 420 | 420 | 2.17% | 2.55% |  |
| B | 19378 | 16491 | 638 | 638 | 3.29% | 3.87% | 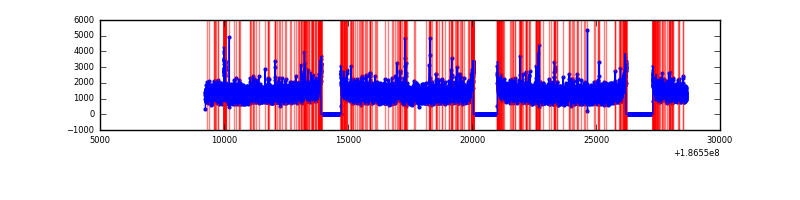 |
| C | 19378 | 16491 | 312 | 312 | 1.61% | 1.89% | 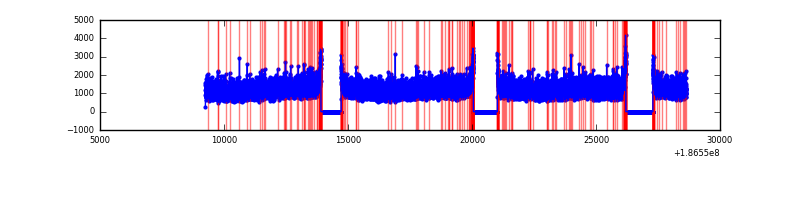 |
| D | 19378 | 16491 | 1742 | 1742 | 8.99% | 10.56% | 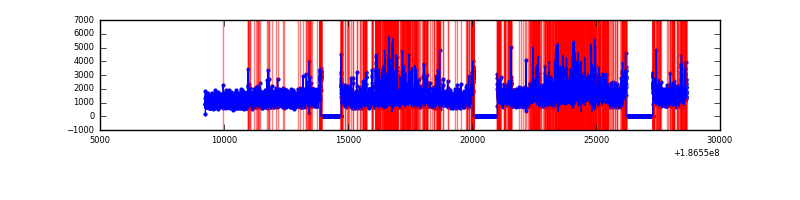 |
Top three noisy pixels from each quadrant. If the there are fewer than three noisy pixels in the level2.evt file, extra rows are filled as -1
| Pixel properties | Quadrant properties | ||||||
|---|---|---|---|---|---|---|---|
| Quadrant | DetID | PixID | Counts | Sigma | Mean | Median | Sigma |
| A | 14 | 170 | 121645 | 96.21 | 5056 | 5090 | 1211.5 |
| A | 11 | 79 | 20652 | 12.84 | 5056 | 5090 | 1211.5 |
| A | 3 | 111 | 15849 | 8.88 | 5056 | 5090 | 1211.5 |
| B | 0 | 182 | 246004 | 195.39 | 5238 | 5254 | 1232.2 |
| B | 15 | 22 | 188644 | 148.83 | 5238 | 5254 | 1232.2 |
| B | 7 | 221 | 126450 | 98.36 | 5238 | 5254 | 1232.2 |
| C | 15 | 241 | 608660 | 458.17 | 4740 | 4903 | 1317.7 |
| C | 3 | 111 | 64181 | 44.98 | 4740 | 4903 | 1317.7 |
| C | 3 | 79 | 46708 | 31.72 | 4740 | 4903 | 1317.7 |
| D | 12 | 188 | 3889062 | 2726.22 | 4621 | 4800 | 1424.8 |
| D | 1 | 4 | 796455 | 555.63 | 4621 | 4800 | 1424.8 |
| D | 12 | 22 | 156880 | 106.74 | 4621 | 4800 | 1424.8 |
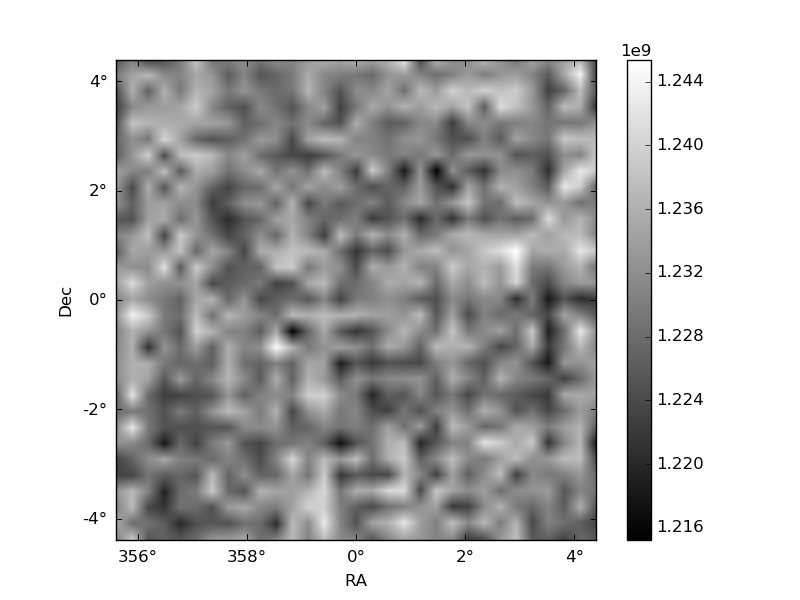
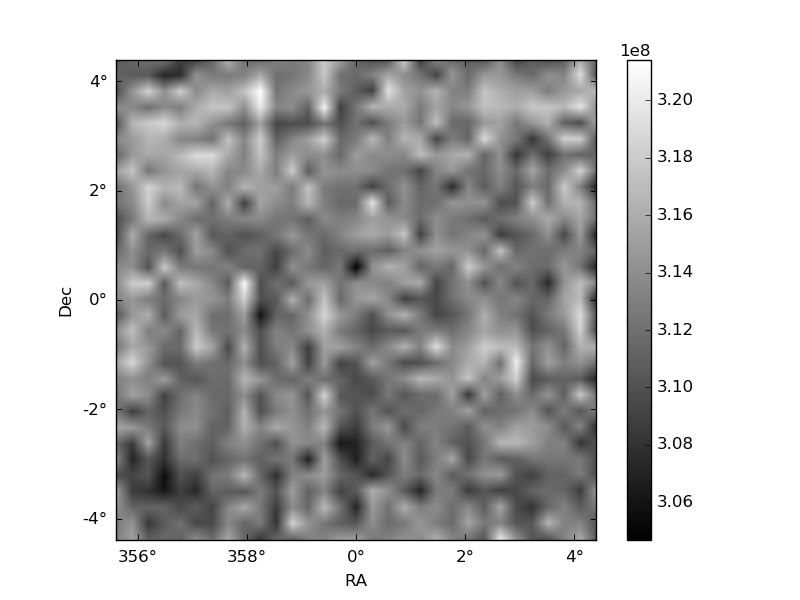
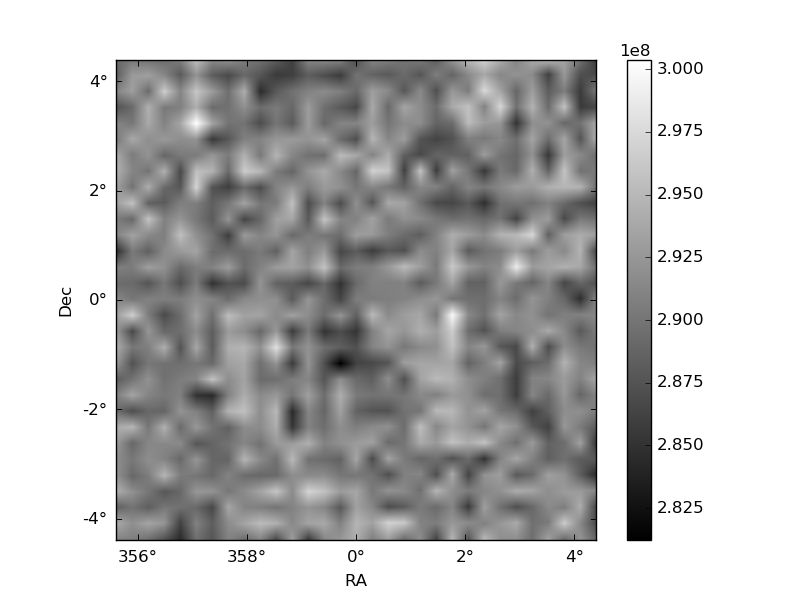
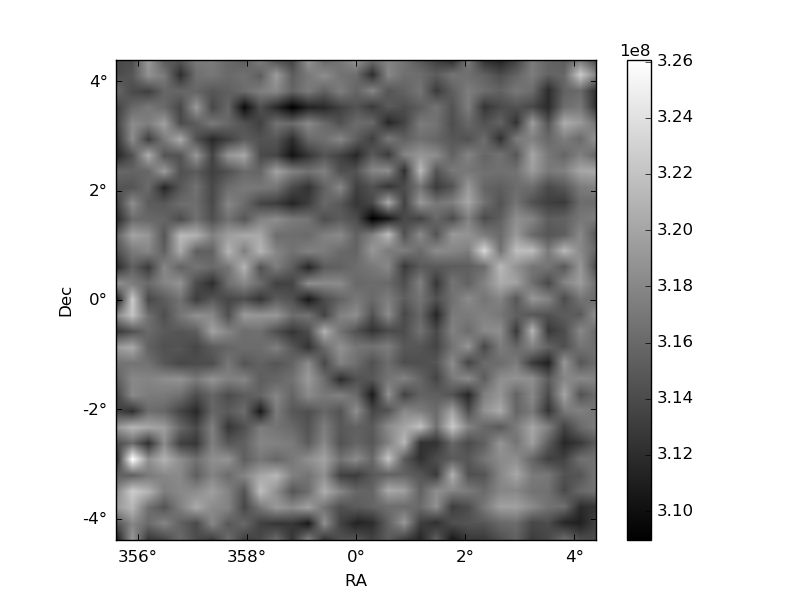
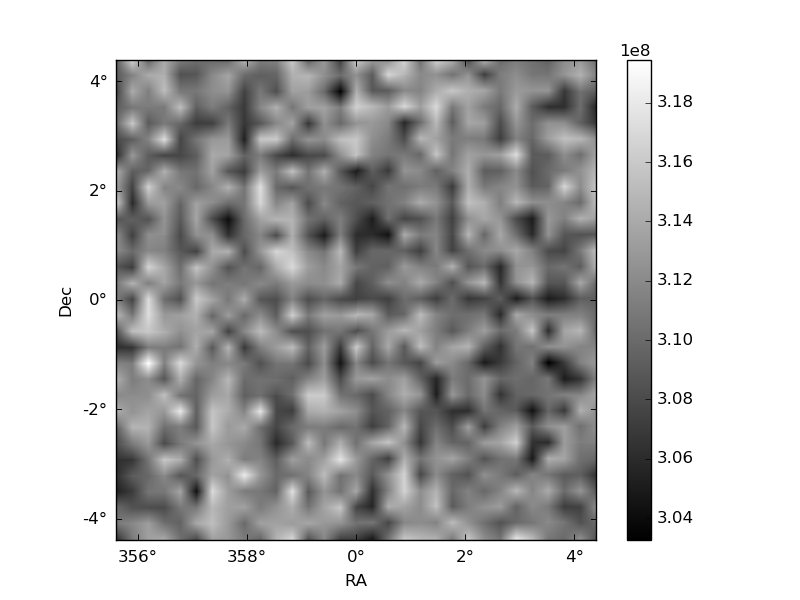
Histogram calculated using DETX and DETY for each event in the final _common_clean file
| Quadrant A | 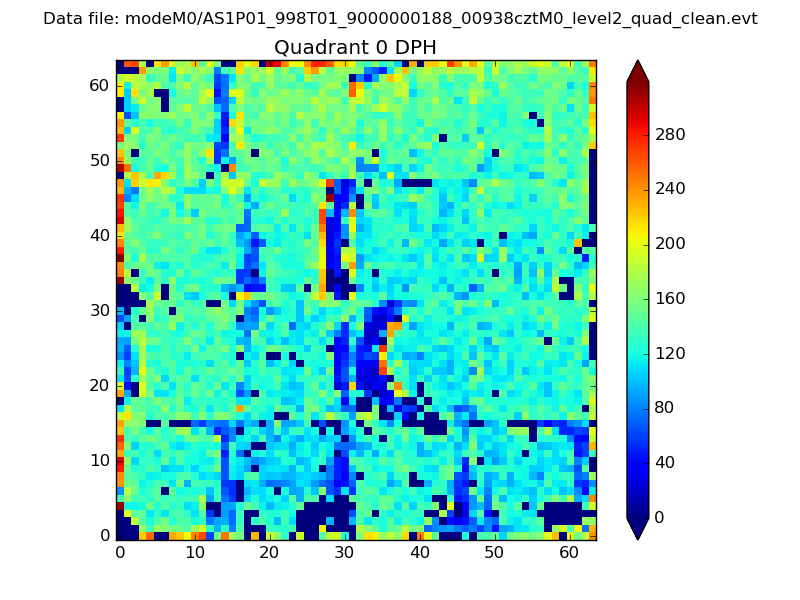 |
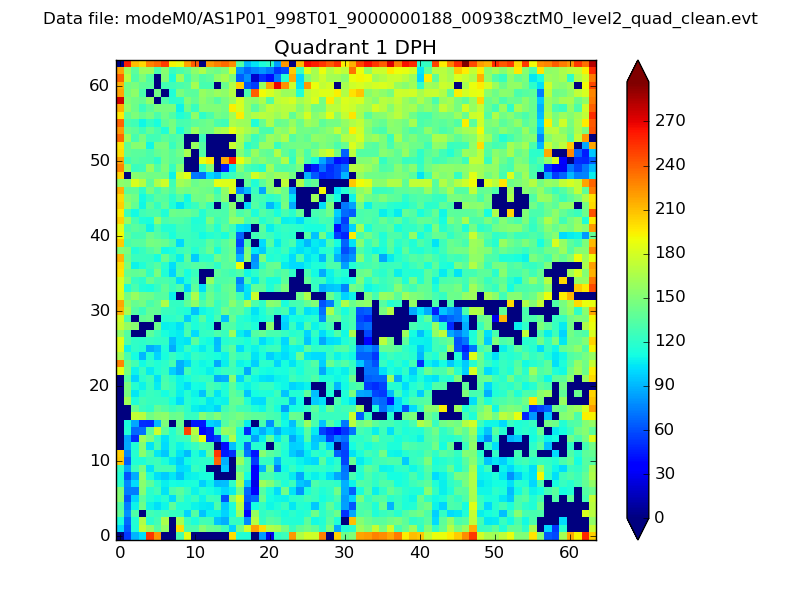 |
Quadrant B |
|---|---|---|---|
| Quadrant D | 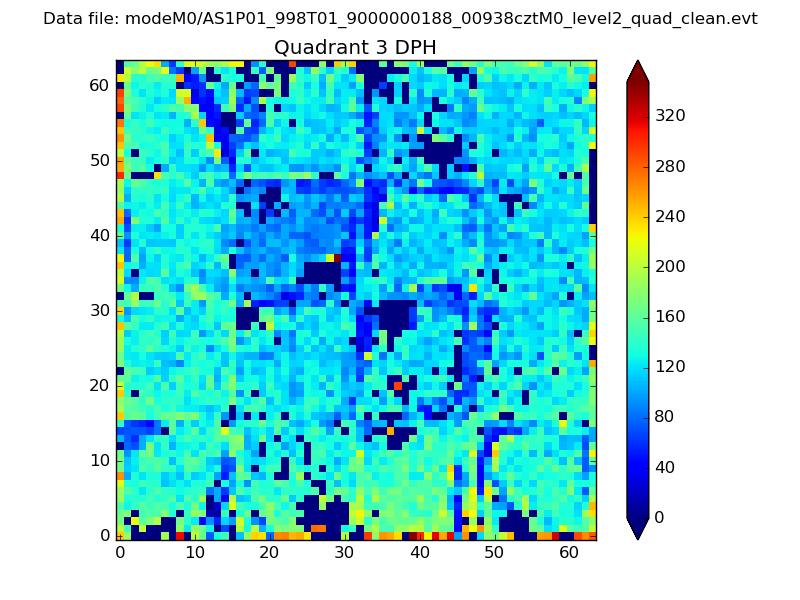 |
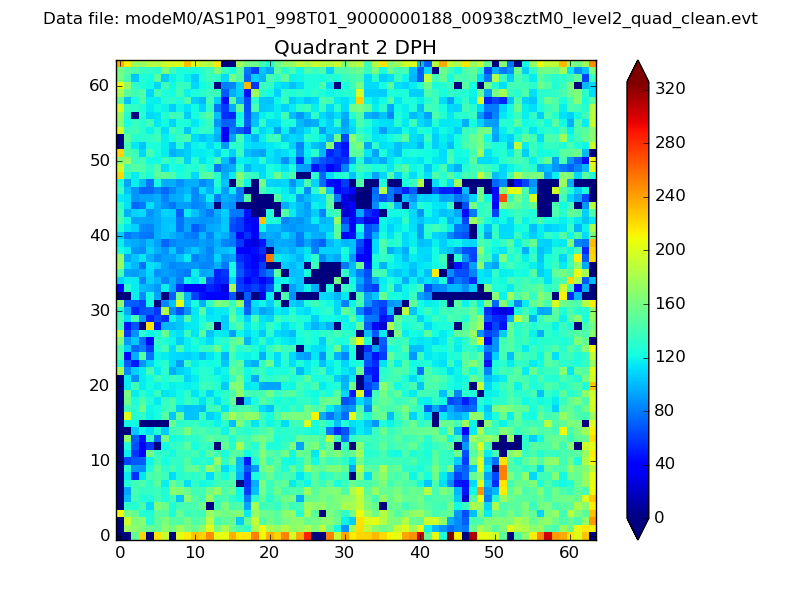 |
Quadrant C |
| Plot type | Count rate plots | Images |
|---|---|---|
| Comparison with Poisson distribution Blue bars denote a histogram of data divided into 1 sec bins. Red curve is a Poisson curve with rate = median count rate of data. |
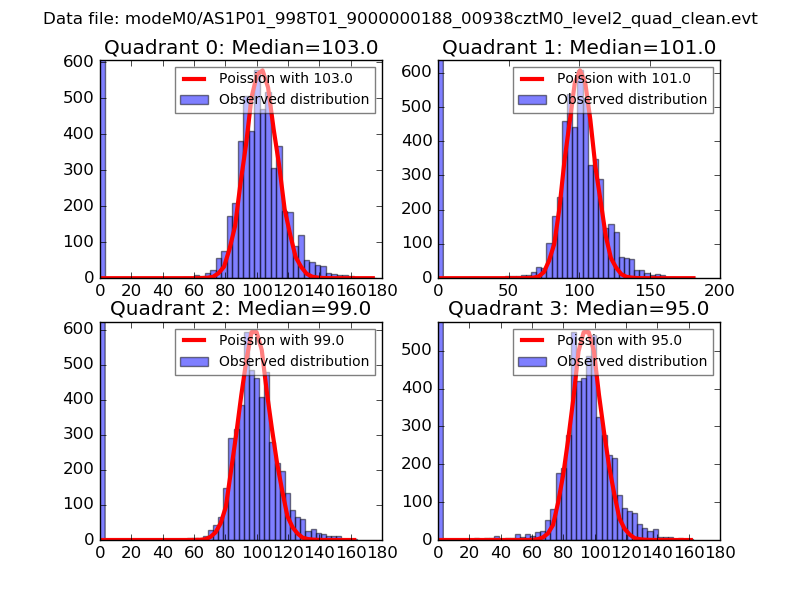 |
 |
| Quadrant-wise count rates Data is divided into 100 sec bins |
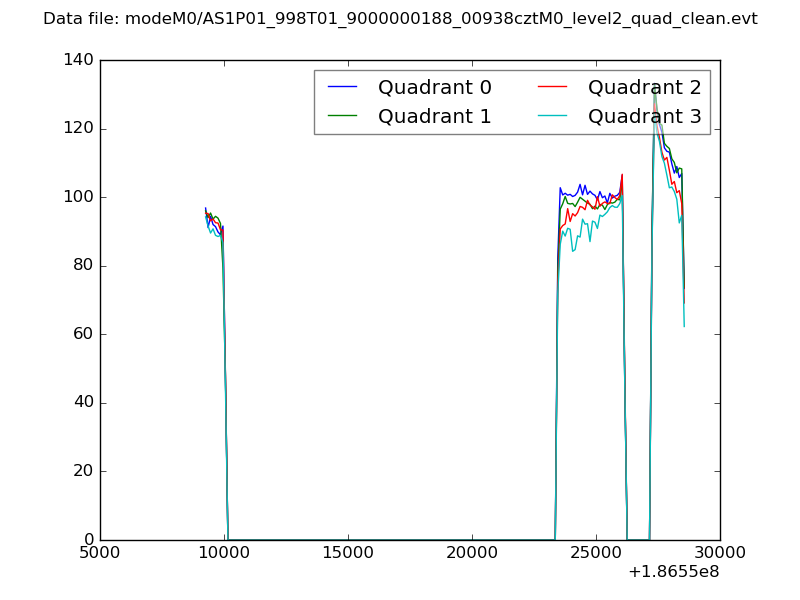 |
|
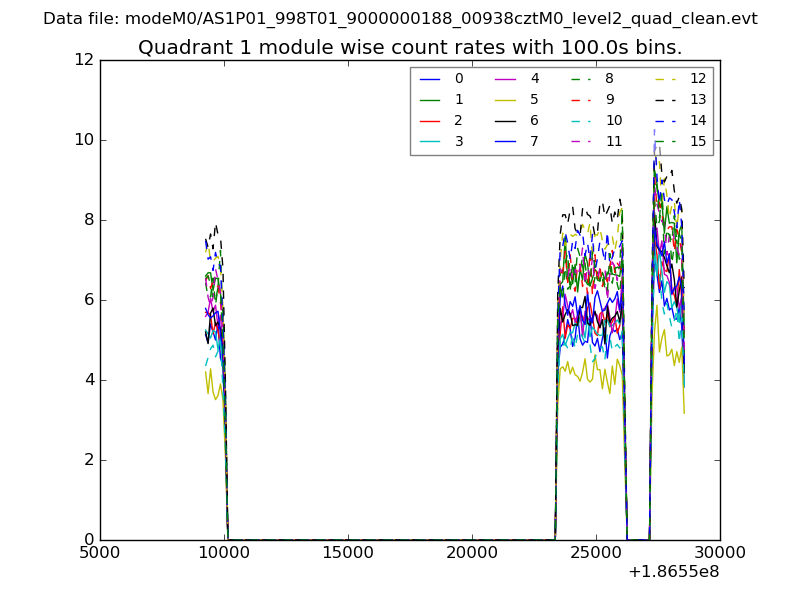
| Module-wise count rates for Quadrant A Data is divided into 100 sec bins |
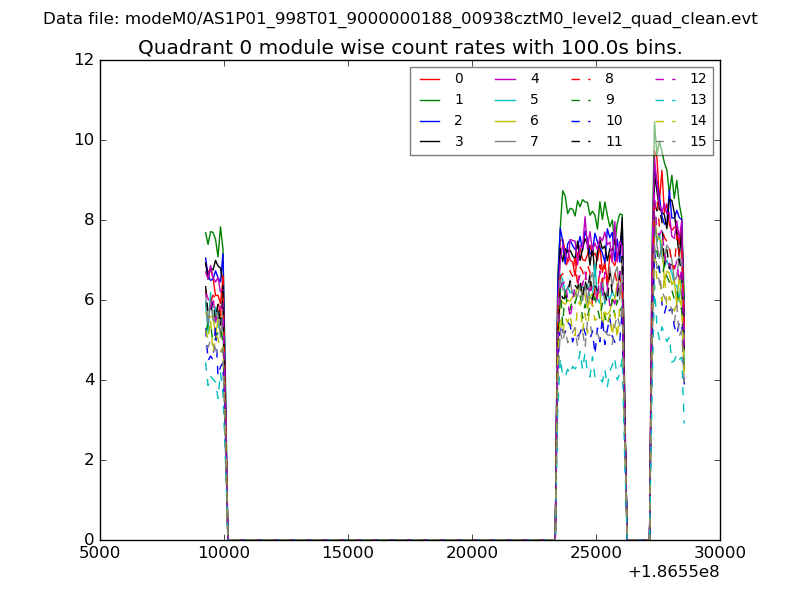 |
 |
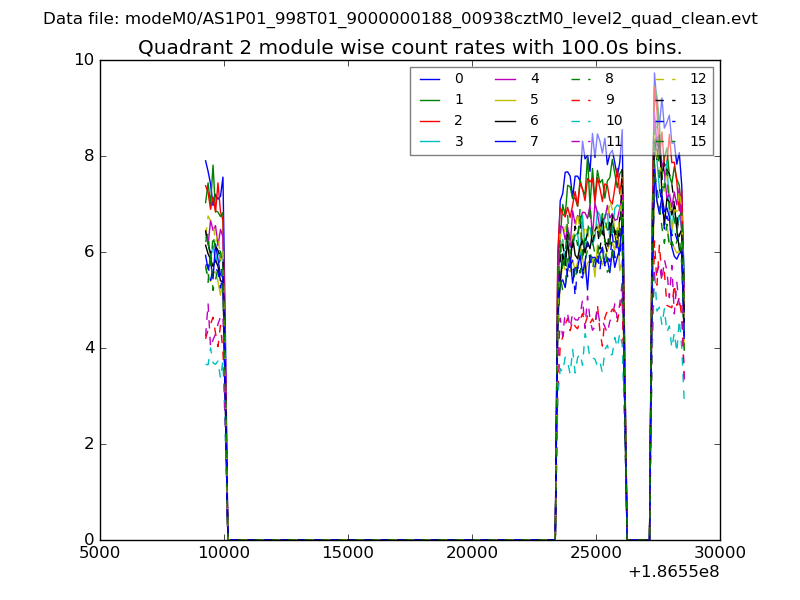
| Module-wise count rates for Quadrant B Data is divided into 100 sec bins |
 |
 |
| Module-wise count rates for Quadrant C Data is divided into 100 sec bins |
 |
 |
| Module-wise count rates for Quadrant D Data is divided into 100 sec bins |
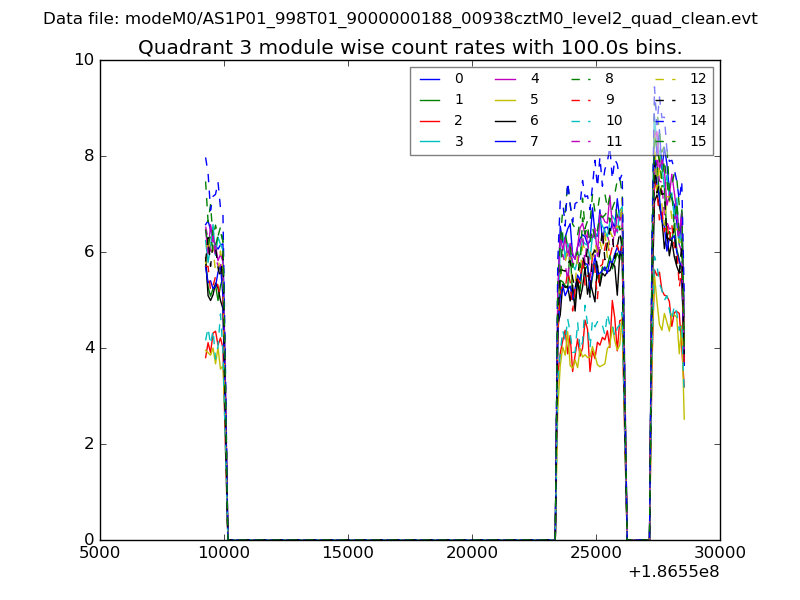 |
 |
| Parameter | Plot |
|---|---|
| CZT HV Monitor | 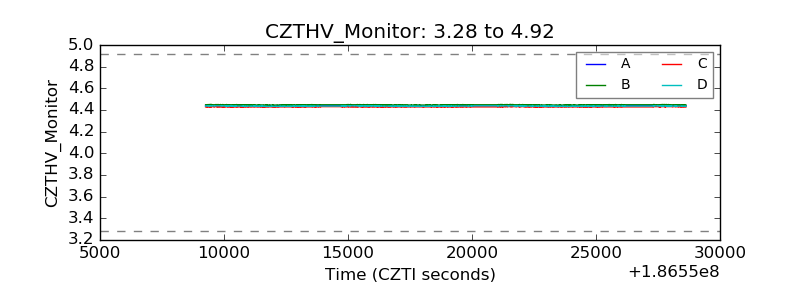 |
| D_VDD |  |
| Temperature 1 | 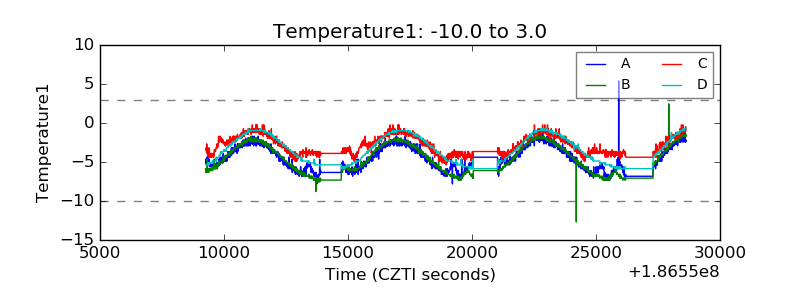 |
| Veto HV Monitor | 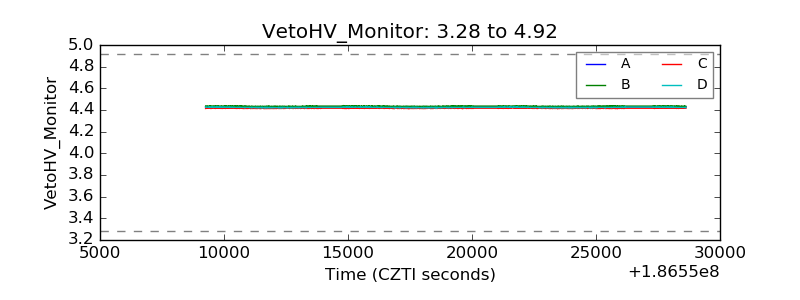 |
| Veto LLD | 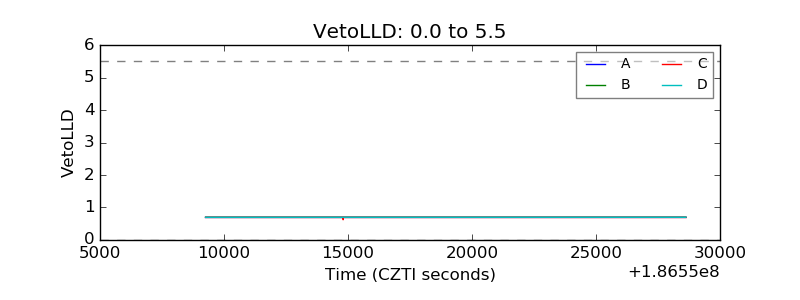 |
| Alpha Counter | 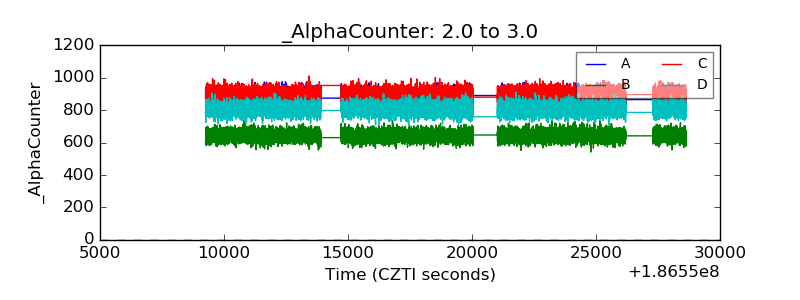 |
| _CPM_Rate | 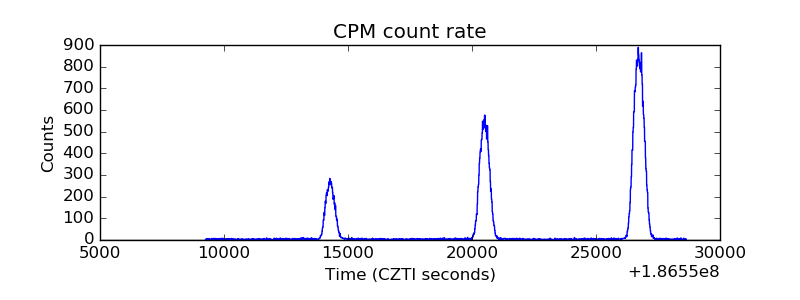 |
| CZT Counter | 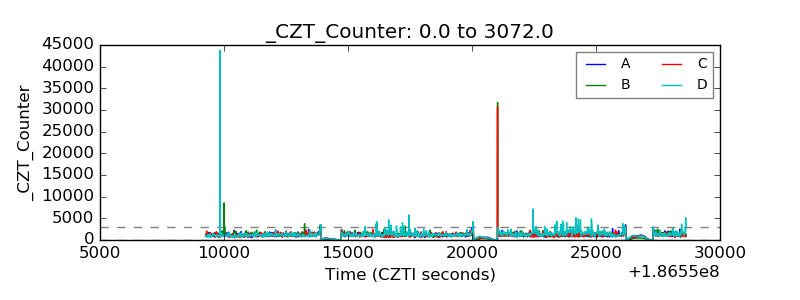 |
| +2.5 Volts monitor |  |
| +5 Volts monitor |  |
| _ROLL_ROT | 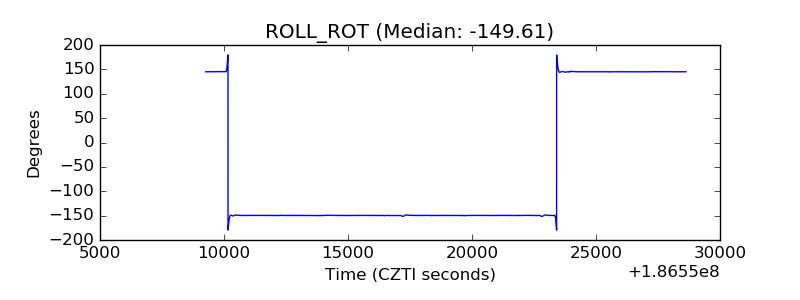 |
| _Roll_DEC | 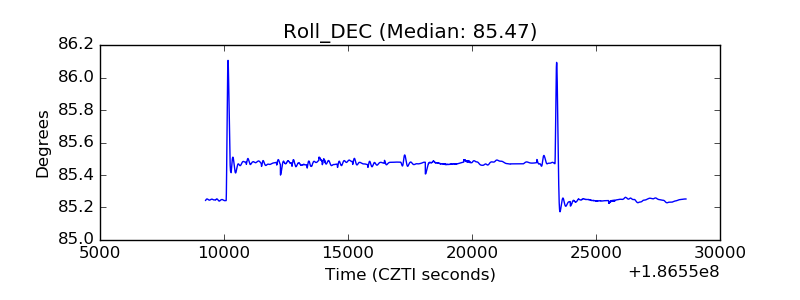 |
| _Roll_RA | 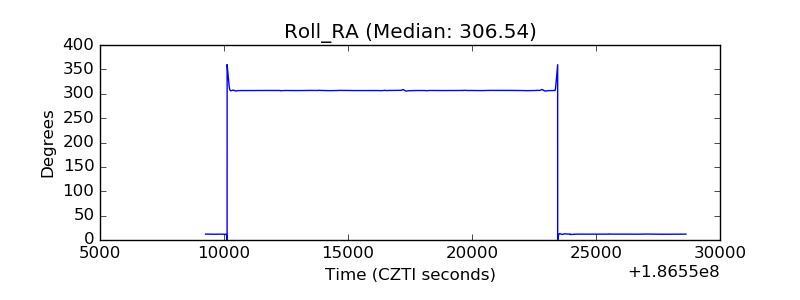 |
| Veto Counter | 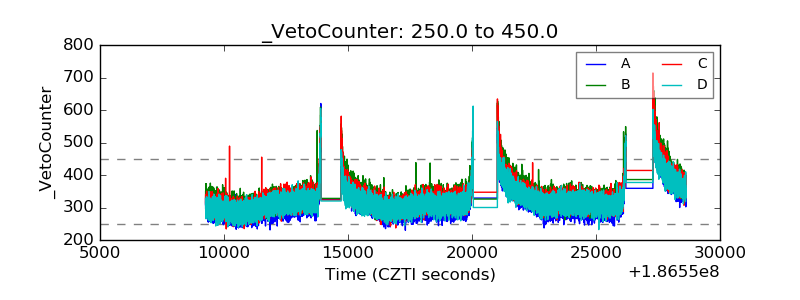 |