| Param | Original file | Final file |
|---|---|---|
| Filename | modeM0/AS1P01_998T01_9000000188_00939cztM0_level2.evt | modeM0/AS1P01_998T01_9000000188_00939cztM0_level2_quad_clean.evt |
| Size (bytes) | 1,036,074,240 | 97,392,960 |
| Size | 988.1 MB | 92.9 MB |
| Events in quadrant A | 7,214,921 | 655,126 |
| Events in quadrant B | 7,556,998 | 647,179 |
| Events in quadrant C | 7,239,932 | 623,941 |
| Events in quadrant D | 8,962,595 | 598,045 |
| Mode M0 | |||
|---|---|---|---|
| Quadrant | BADHDUFLAG | Total packets | Discarded packets |
| A | 0 | 25704 | 0 |
| B | 0 | 26743 | 0 |
| C | 0 | 25811 | 0 |
| D | 0 | 31011 | 0 |
| Mode M9 | |||
|---|---|---|---|
| Quadrant | BADHDUFLAG | Total packets | Discarded packets |
| A | 0 | 12 | 0 |
| B | 0 | 12 | 0 |
| C | 0 | 12 | 0 |
| D | 0 | 12 | 0 |
| Mode SS | |||
|---|---|---|---|
| Quadrant | BADHDUFLAG | Total packets | Discarded packets |
| A | 0 | 124 | 0 |
| B | 0 | 124 | 0 |
| C | 0 | 124 | 0 |
| D | 0 | 124 | 0 |
| Quadrant | Total seconds | Saturated seconds | Saturation percentage |
|---|---|---|---|
| A | 6088 | 17 | 0.279238% |
| B | 6088 | 24 | 0.394218% |
| C | 6088 | 10 | 0.164258% |
| D | 6089 | 287 | 4.713418% |
Noise dominated data is calculated using 1-second bins in cleaned event files. If a bin has >2000 counts, and if more than 50% of those come from <1% of pixels, then it is considered to be noise-dominated and hence unusable.
| Quadrant | # 1 sec bins | Bins with >0 counts | Bins with >2000 counts | High rate bins dominated by noise | Noise dominated (total time) | Noise dominated (detector-on time) | Marked lightcurve |
|---|---|---|---|---|---|---|---|
| A | 7298 | 6089 | 142 | 142 | 1.95% | 2.33% | 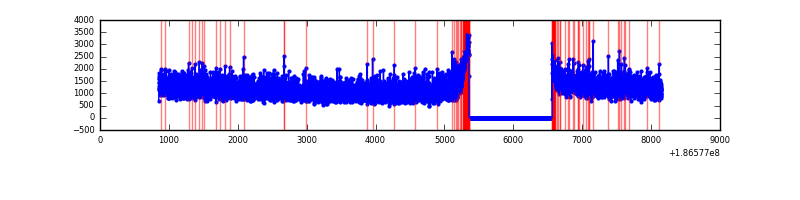 |
| B | 7298 | 6089 | 191 | 191 | 2.62% | 3.14% |  |
| C | 7298 | 6089 | 127 | 127 | 1.74% | 2.09% | 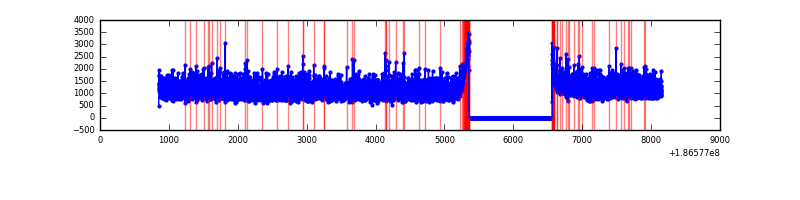 |
| D | 7299 | 6090 | 828 | 828 | 11.34% | 13.60% | 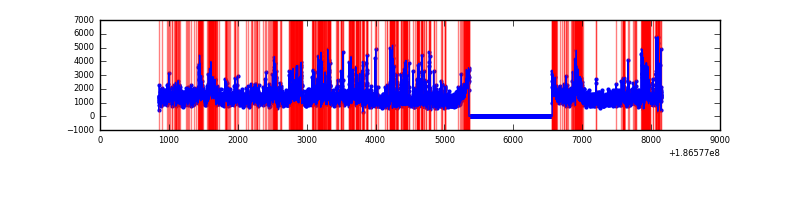 |
Top three noisy pixels from each quadrant. If the there are fewer than three noisy pixels in the level2.evt file, extra rows are filled as -1
| Pixel properties | Quadrant properties | ||||||
|---|---|---|---|---|---|---|---|
| Quadrant | DetID | PixID | Counts | Sigma | Mean | Median | Sigma |
| A | 14 | 170 | 10374 | 19.02 | 1876 | 1886 | 446.2 |
| A | 11 | 79 | 7972 | 13.64 | 1876 | 1886 | 446.2 |
| A | 12 | 189 | 6231 | 9.74 | 1876 | 1886 | 446.2 |
| B | 5 | 249 | 61601 | 132.82 | 1925 | 1931 | 449.2 |
| B | 15 | 22 | 29728 | 61.87 | 1925 | 1931 | 449.2 |
| B | 7 | 221 | 26527 | 54.75 | 1925 | 1931 | 449.2 |
| C | 15 | 241 | 239759 | 483.78 | 1776 | 1835 | 491.8 |
| C | 3 | 111 | 24734 | 46.56 | 1776 | 1835 | 491.8 |
| C | 3 | 79 | 19414 | 35.74 | 1776 | 1835 | 491.8 |
| D | 12 | 188 | 1984669 | 3785.08 | 1710 | 1773 | 523.9 |
| D | 1 | 4 | 399978 | 760.12 | 1710 | 1773 | 523.9 |
| D | 2 | 152 | 65868 | 122.35 | 1710 | 1773 | 523.9 |
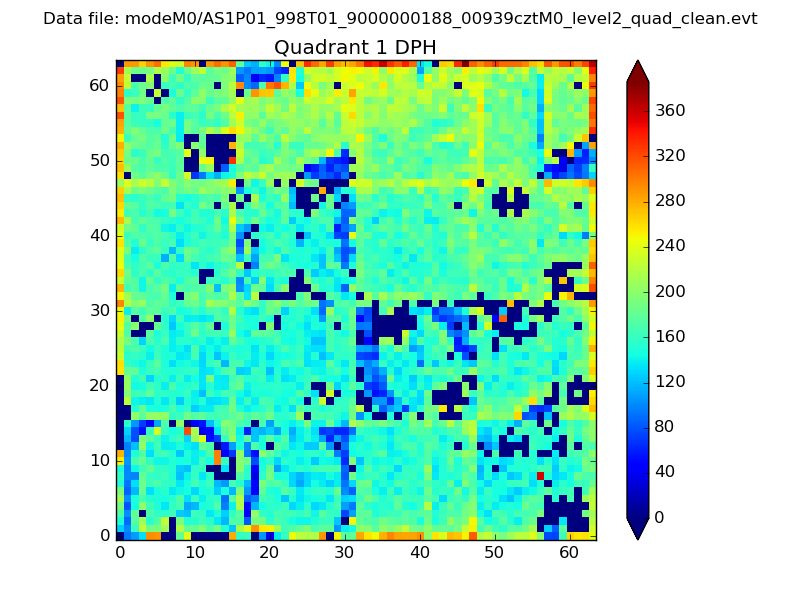
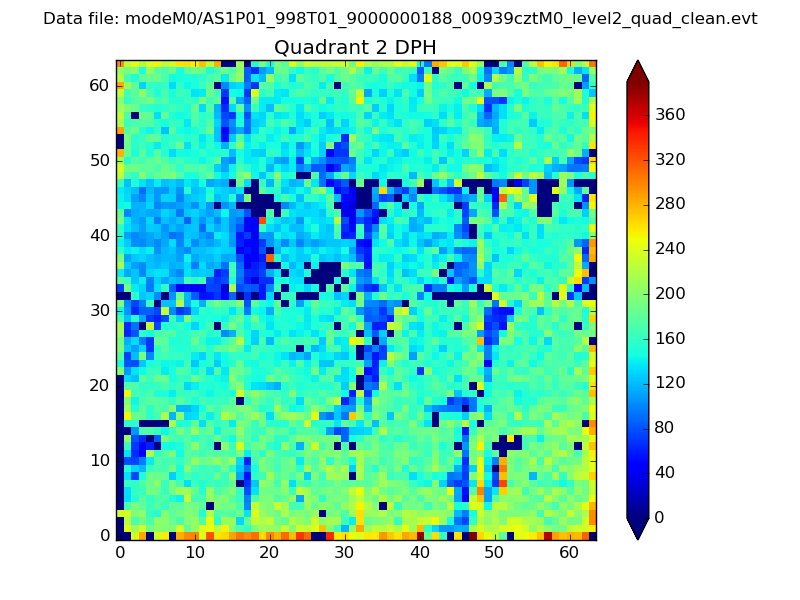
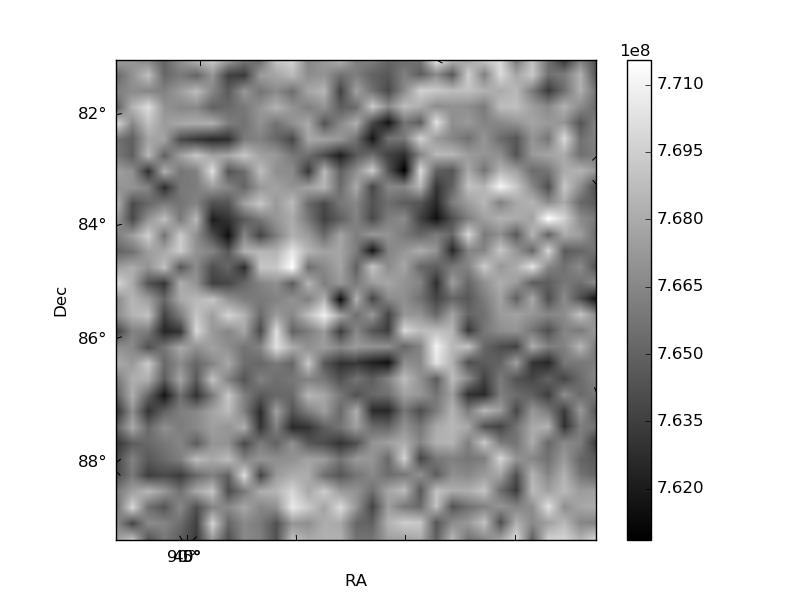
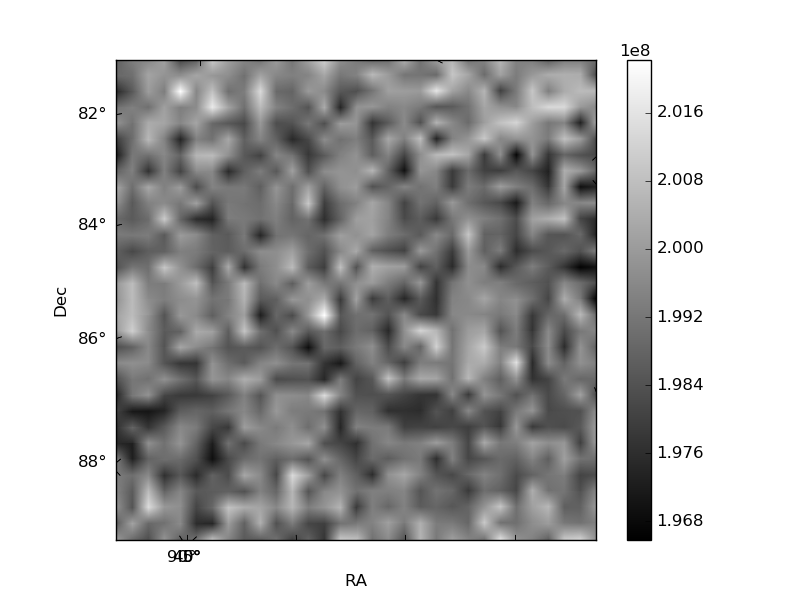
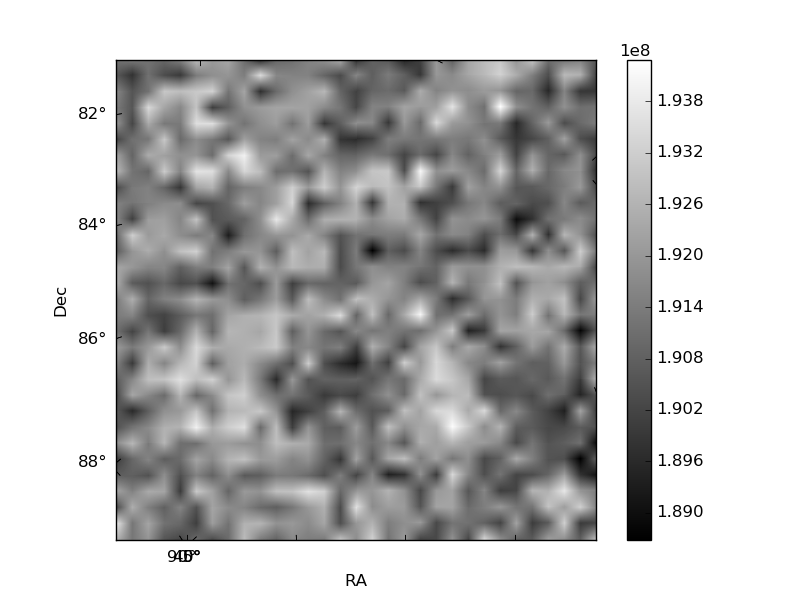
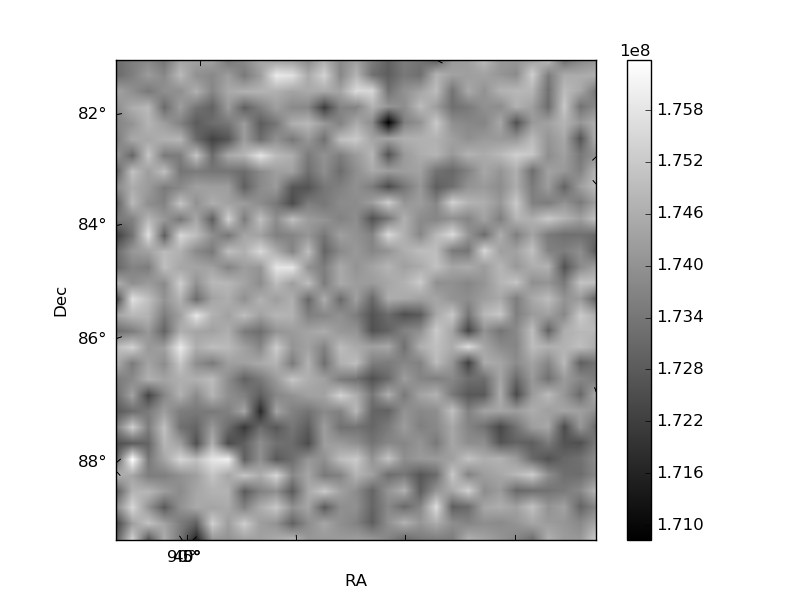
Histogram calculated using DETX and DETY for each event in the final _common_clean file
| Quadrant A | 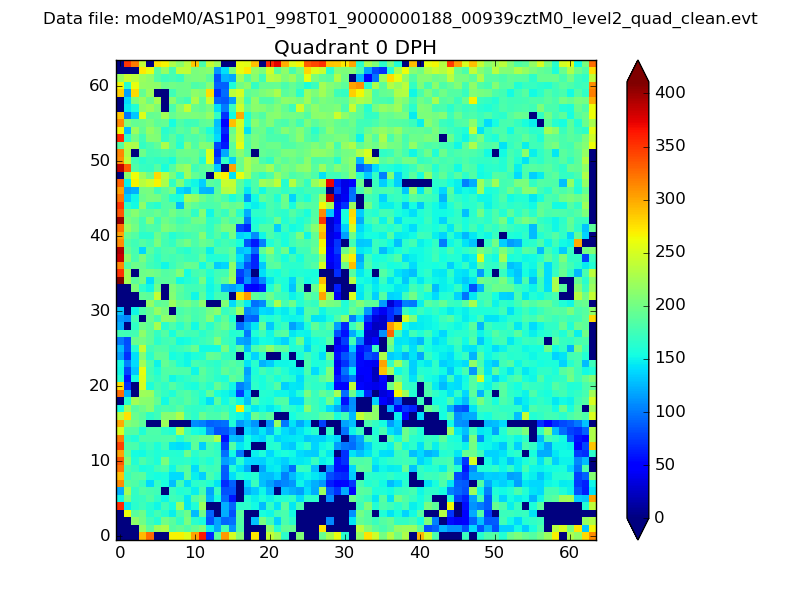 |
 |
Quadrant B |
|---|---|---|---|
| Quadrant D | 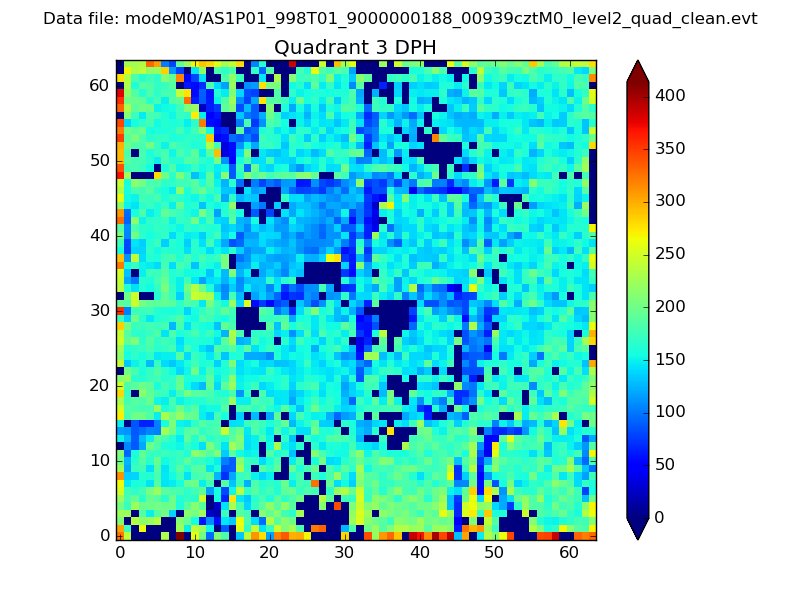 |
 |
Quadrant C |
| Plot type | Count rate plots | Images |
|---|---|---|
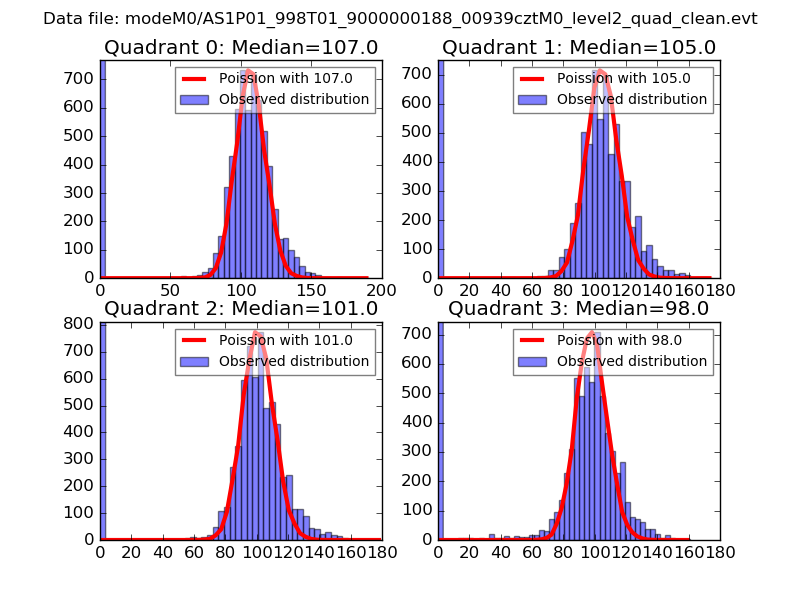
| Comparison with Poisson distribution Blue bars denote a histogram of data divided into 1 sec bins. Red curve is a Poisson curve with rate = median count rate of data. |
 |
 |
| Quadrant-wise count rates Data is divided into 100 sec bins |
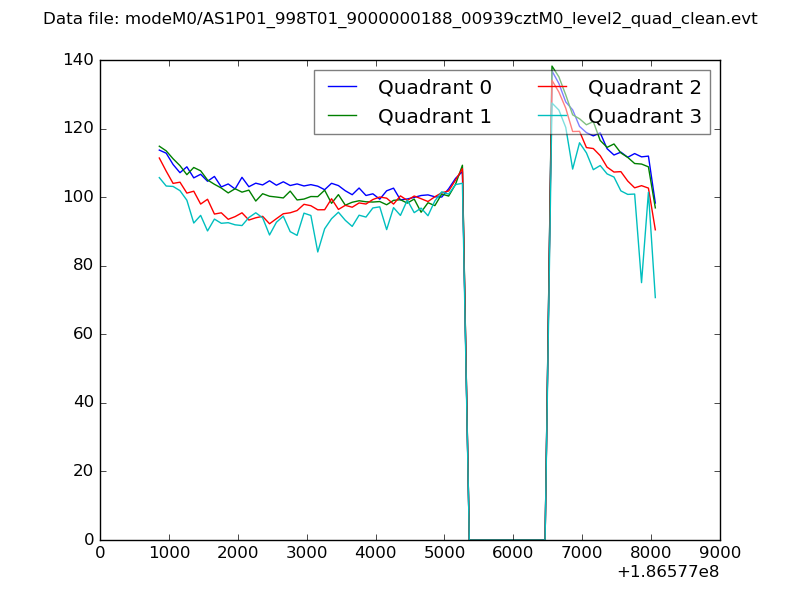 |
|
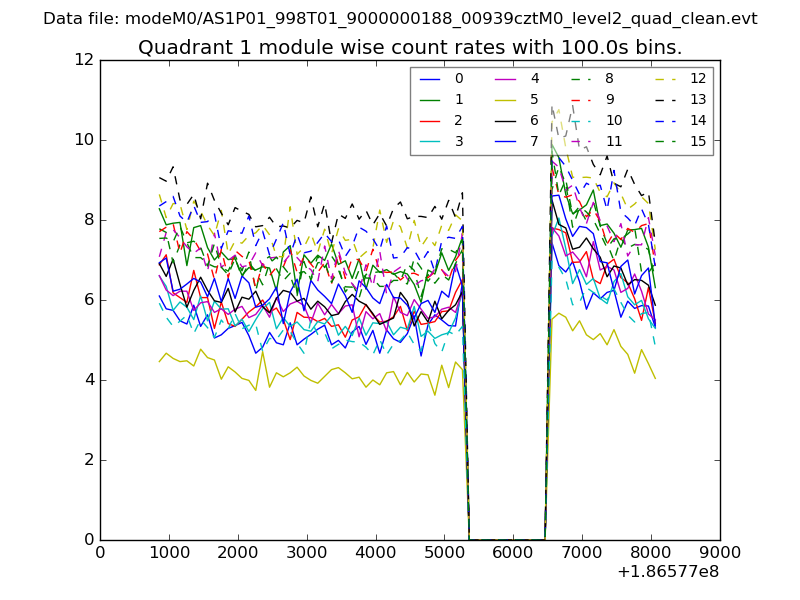
| Module-wise count rates for Quadrant A Data is divided into 100 sec bins |
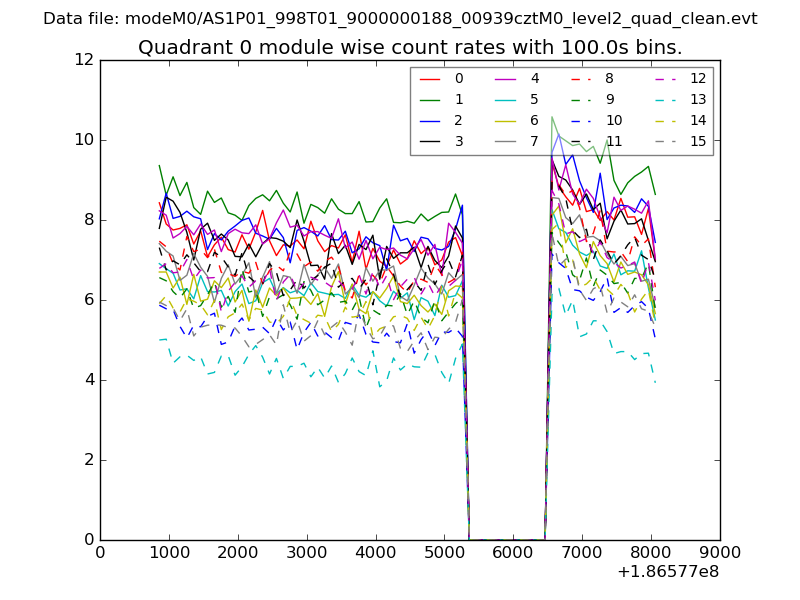 |
 |
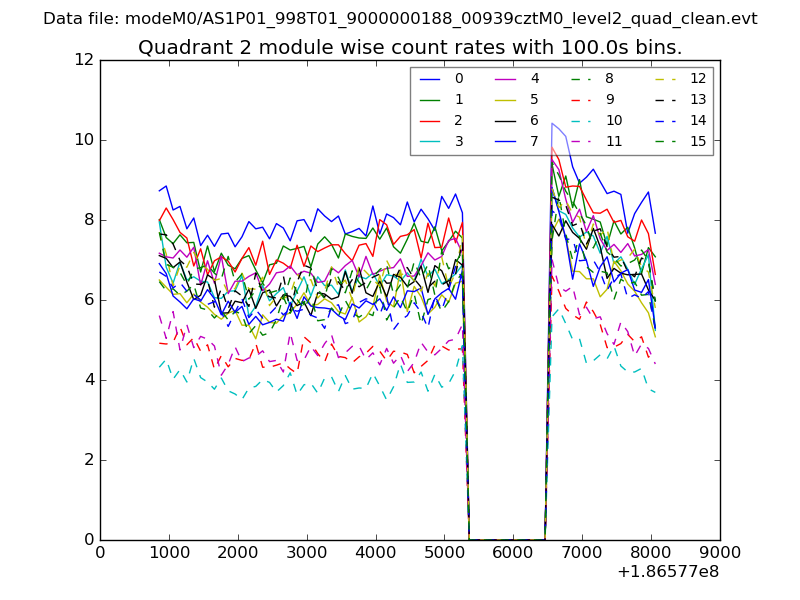
| Module-wise count rates for Quadrant B Data is divided into 100 sec bins |
 |
 |
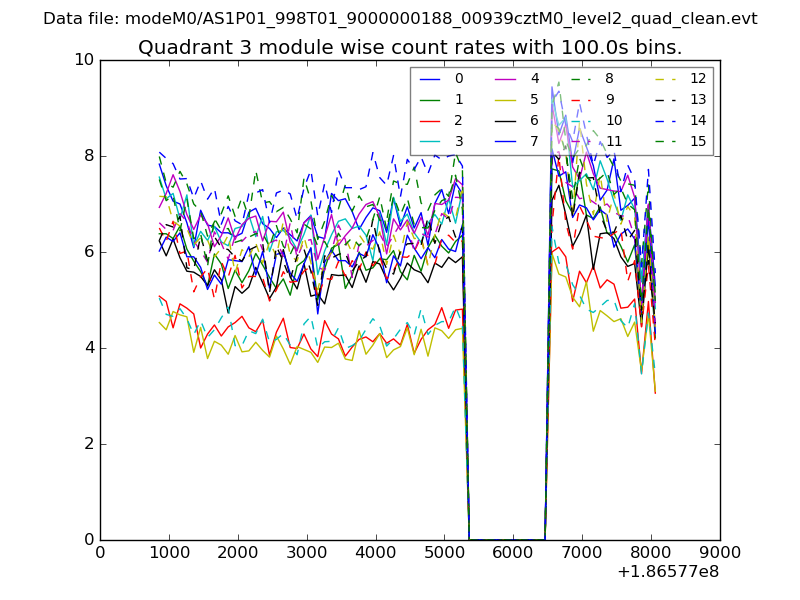
| Module-wise count rates for Quadrant C Data is divided into 100 sec bins |
 |
 |
| Module-wise count rates for Quadrant D Data is divided into 100 sec bins |
 |
 |
| Parameter | Plot |
|---|---|
| CZT HV Monitor | 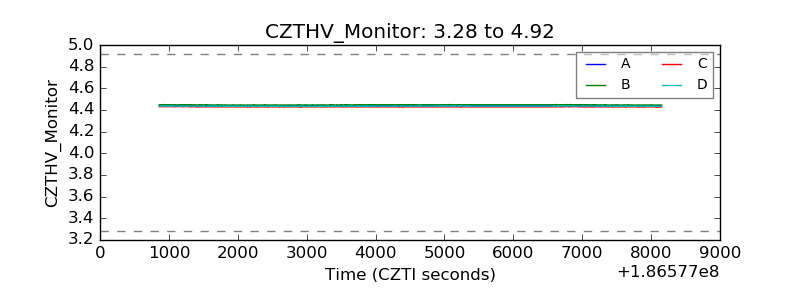 |
| D_VDD |  |
| Temperature 1 | 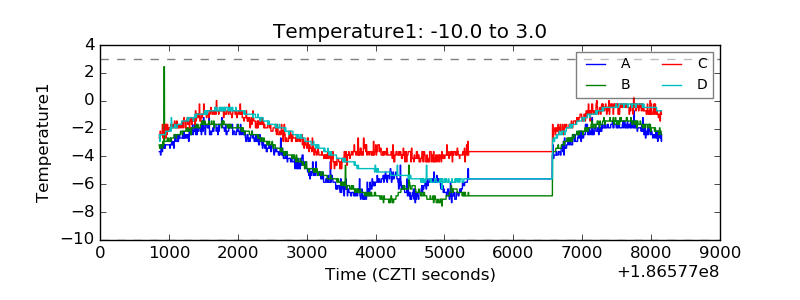 |
| Veto HV Monitor | 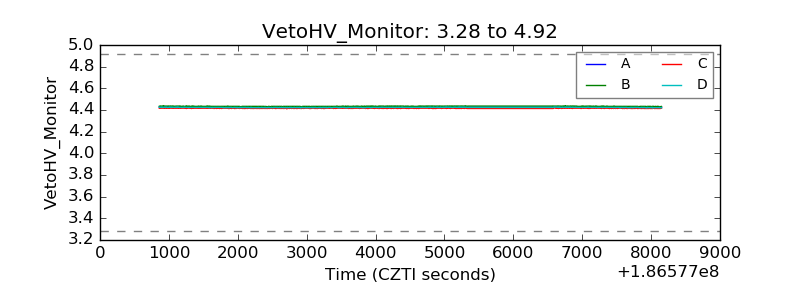 |
| Veto LLD | 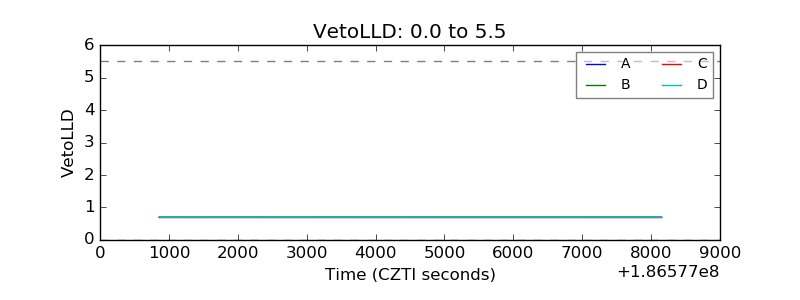 |
| Alpha Counter | 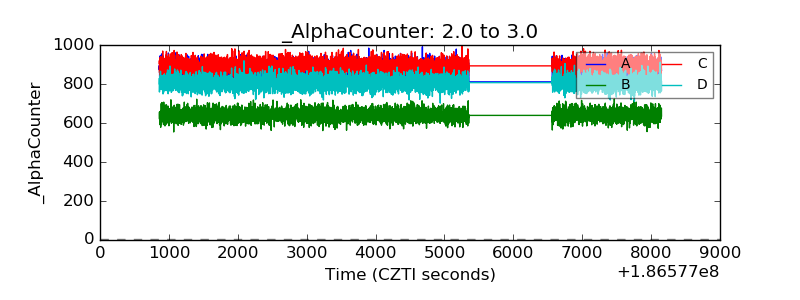 |
| _CPM_Rate | 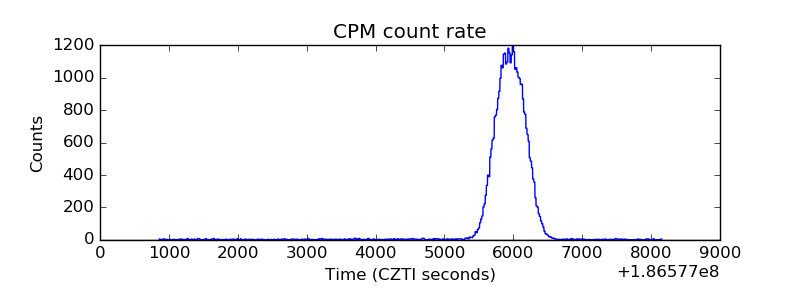 |
| CZT Counter | 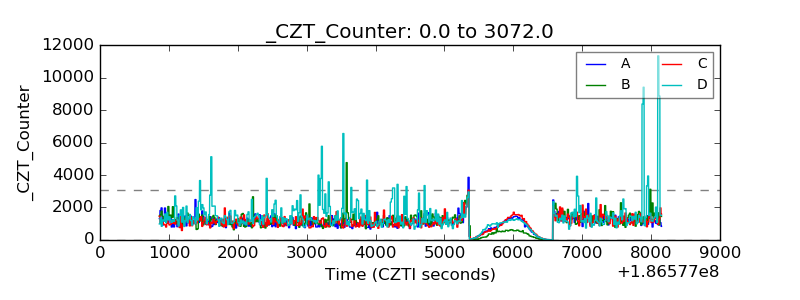 |
| +2.5 Volts monitor |  |
| +5 Volts monitor |  |
| _ROLL_ROT | 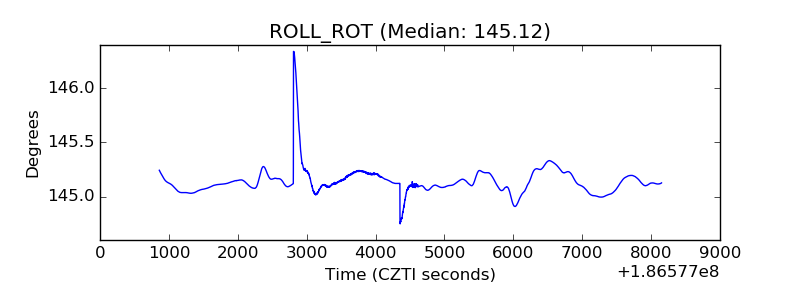 |
| _Roll_DEC |  |
| _Roll_RA | 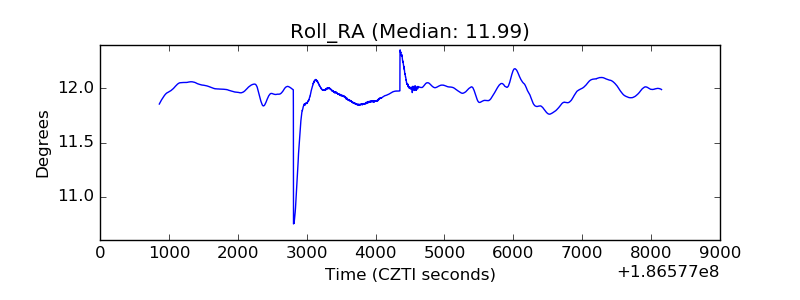 |
| Veto Counter | 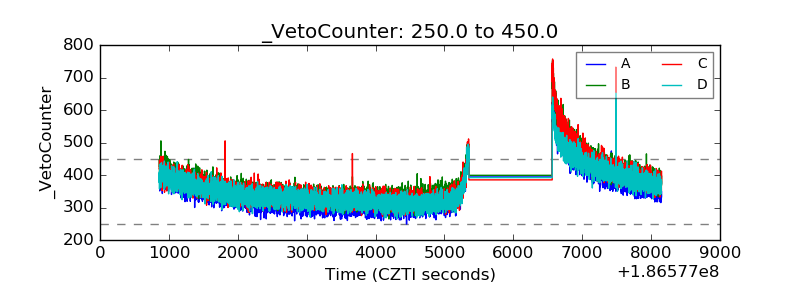 |