| Param | Original file | Final file |
|---|---|---|
| Filename | modeM0/AS1P01_998T01_9000000188_00941cztM0_level2.evt | modeM0/AS1P01_998T01_9000000188_00941cztM0_level2_quad_clean.evt |
| Size (bytes) | 1,098,279,360 | 102,121,920 |
| Size | 1.0 GB | 97.4 MB |
| Events in quadrant A | 8,339,003 | 672,267 |
| Events in quadrant B | 7,922,311 | 679,909 |
| Events in quadrant C | 7,706,931 | 665,647 |
| Events in quadrant D | 8,878,723 | 637,311 |
| Mode M0 | |||
|---|---|---|---|
| Quadrant | BADHDUFLAG | Total packets | Discarded packets |
| A | 0 | 29251 | 0 |
| B | 0 | 27966 | 0 |
| C | 0 | 27339 | 0 |
| D | 0 | 30842 | 0 |
| Mode M9 | |||
|---|---|---|---|
| Quadrant | BADHDUFLAG | Total packets | Discarded packets |
| A | 0 | 12 | 0 |
| B | 0 | 12 | 0 |
| C | 0 | 12 | 0 |
| D | 0 | 12 | 0 |
| Mode SS | |||
|---|---|---|---|
| Quadrant | BADHDUFLAG | Total packets | Discarded packets |
| A | 0 | 128 | 0 |
| B | 0 | 128 | 0 |
| C | 0 | 128 | 0 |
| D | 0 | 128 | 0 |
| Quadrant | Total seconds | Saturated seconds | Saturation percentage |
|---|---|---|---|
| A | 6266 | 205 | 3.271625% |
| B | 6267 | 21 | 0.335089% |
| C | 6266 | 26 | 0.414938% |
| D | 6266 | 181 | 2.888605% |
Noise dominated data is calculated using 1-second bins in cleaned event files. If a bin has >2000 counts, and if more than 50% of those come from <1% of pixels, then it is considered to be noise-dominated and hence unusable.
| Quadrant | # 1 sec bins | Bins with >0 counts | Bins with >2000 counts | High rate bins dominated by noise | Noise dominated (total time) | Noise dominated (detector-on time) | Marked lightcurve |
|---|---|---|---|---|---|---|---|
| A | 7511 | 6267 | 682 | 682 | 9.08% | 10.88% | 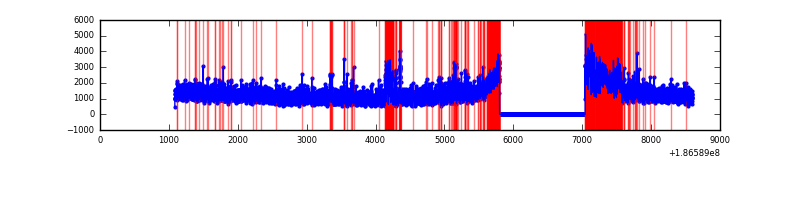 |
| B | 7512 | 6268 | 301 | 301 | 4.01% | 4.80% | 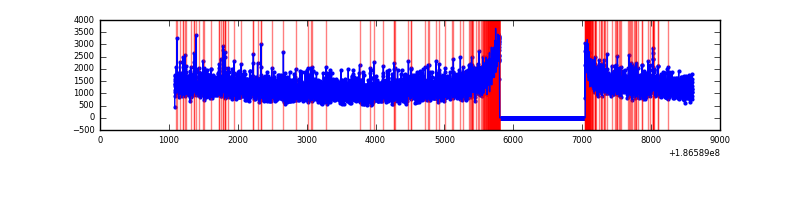 |
| C | 7511 | 6267 | 204 | 204 | 2.72% | 3.26% | 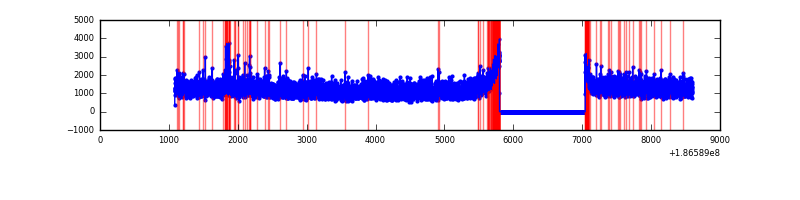 |
| D | 7511 | 6267 | 765 | 765 | 10.19% | 12.21% | 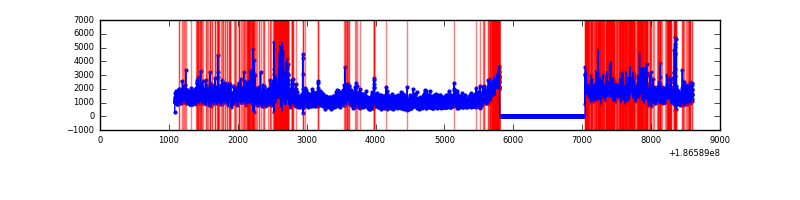 |
Top three noisy pixels from each quadrant. If the there are fewer than three noisy pixels in the level2.evt file, extra rows are filled as -1
| Pixel properties | Quadrant properties | ||||||
|---|---|---|---|---|---|---|---|
| Quadrant | DetID | PixID | Counts | Sigma | Mean | Median | Sigma |
| A | 14 | 170 | 686947 | 1509.44 | 1913 | 1922 | 453.8 |
| A | 13 | 147 | 303214 | 663.89 | 1913 | 1922 | 453.8 |
| A | 11 | 79 | 8790 | 15.13 | 1913 | 1922 | 453.8 |
| B | 0 | 220 | 47632 | 97.3 | 2018 | 2023 | 468.7 |
| B | 5 | 249 | 44189 | 89.96 | 2018 | 2023 | 468.7 |
| B | 8 | 234 | 33110 | 66.32 | 2018 | 2023 | 468.7 |
| C | 15 | 241 | 224376 | 433.37 | 1868 | 1935 | 513.3 |
| C | 9 | 144 | 66614 | 126.01 | 1868 | 1935 | 513.3 |
| C | 10 | 34 | 51089 | 95.76 | 1868 | 1935 | 513.3 |
| D | 12 | 188 | 1328911 | 2430.99 | 1796 | 1861 | 545.9 |
| D | 1 | 4 | 659391 | 1204.51 | 1796 | 1861 | 545.9 |
| D | 10 | 157 | 77365 | 138.31 | 1796 | 1861 | 545.9 |
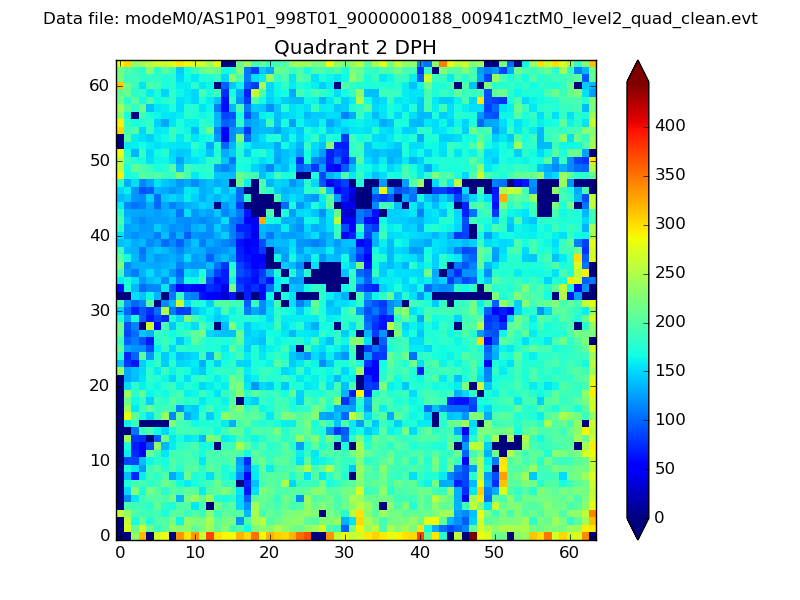
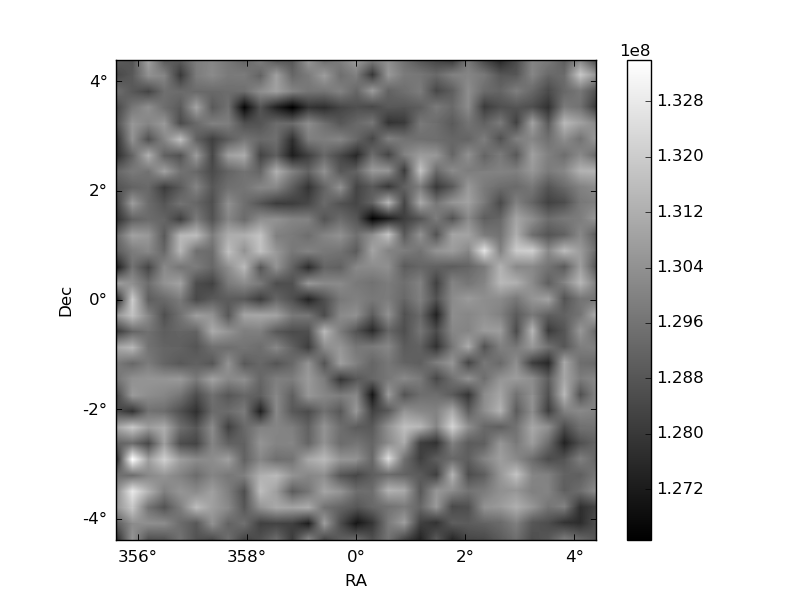
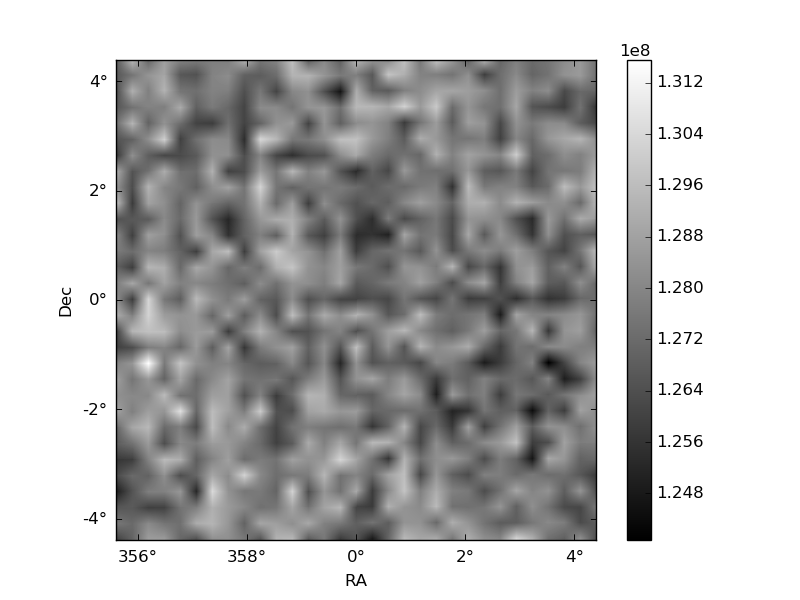
Histogram calculated using DETX and DETY for each event in the final _common_clean file
| Quadrant A | 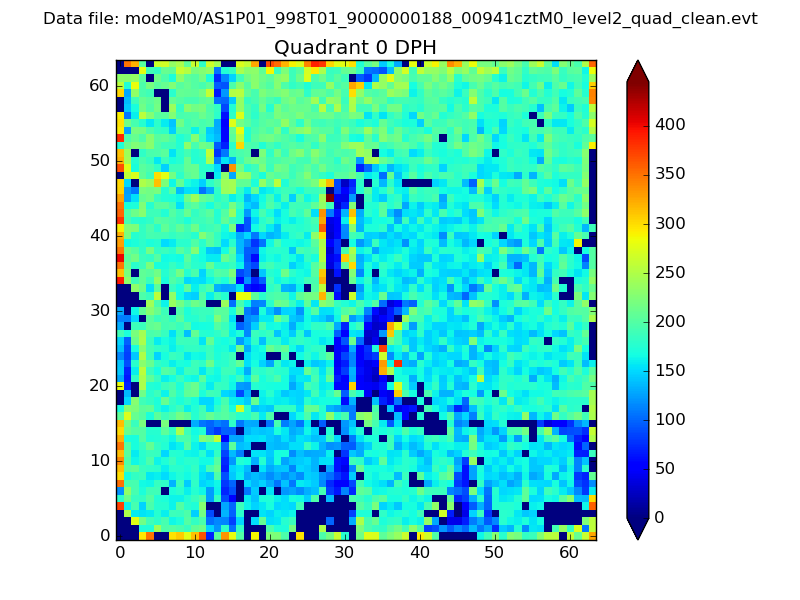 |
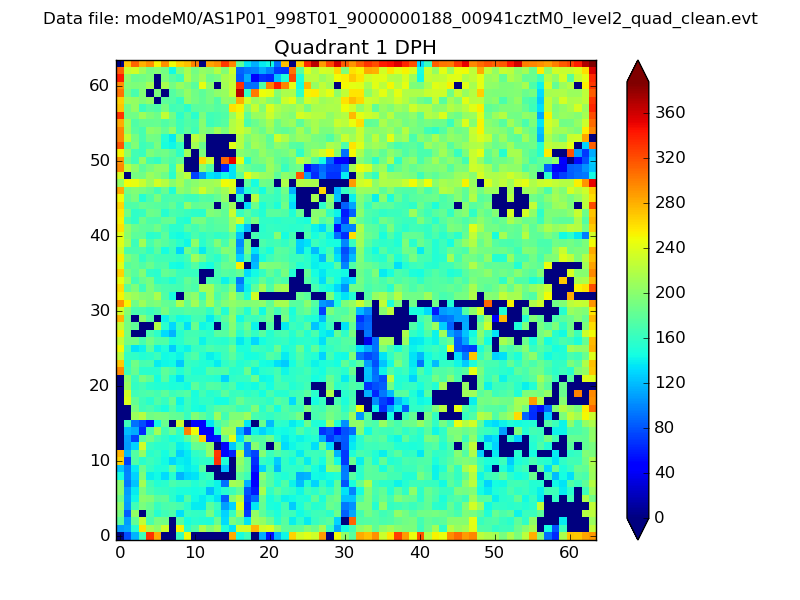 |
Quadrant B |
|---|---|---|---|
| Quadrant D | 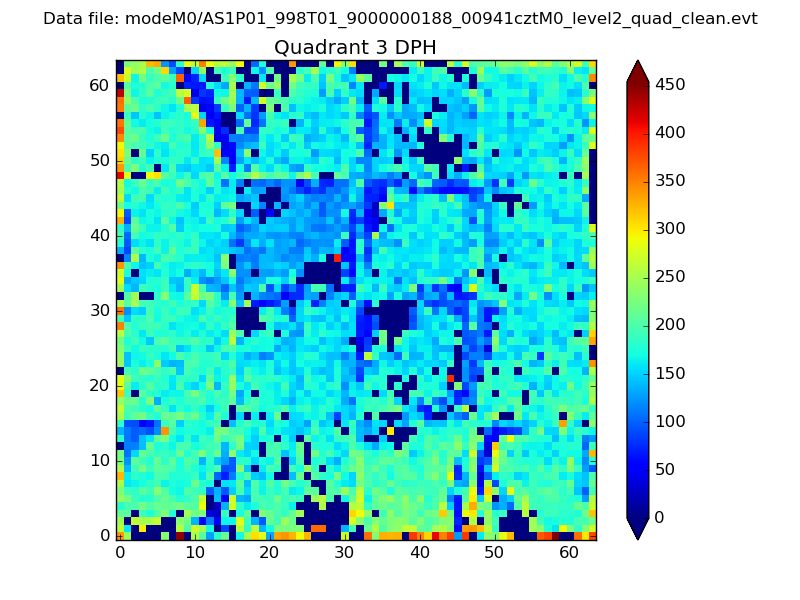 |
 |
Quadrant C |
| Plot type | Count rate plots | Images |
|---|---|---|
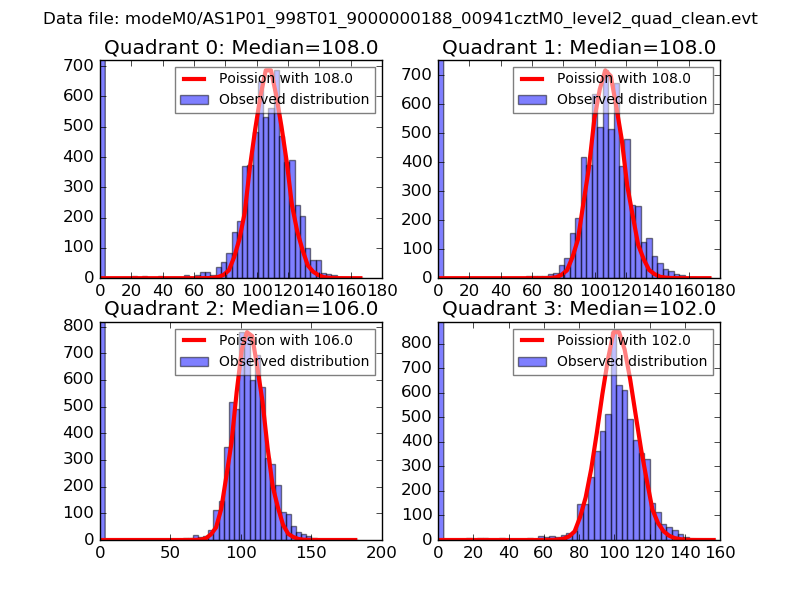
| Comparison with Poisson distribution Blue bars denote a histogram of data divided into 1 sec bins. Red curve is a Poisson curve with rate = median count rate of data. |
 |
 |
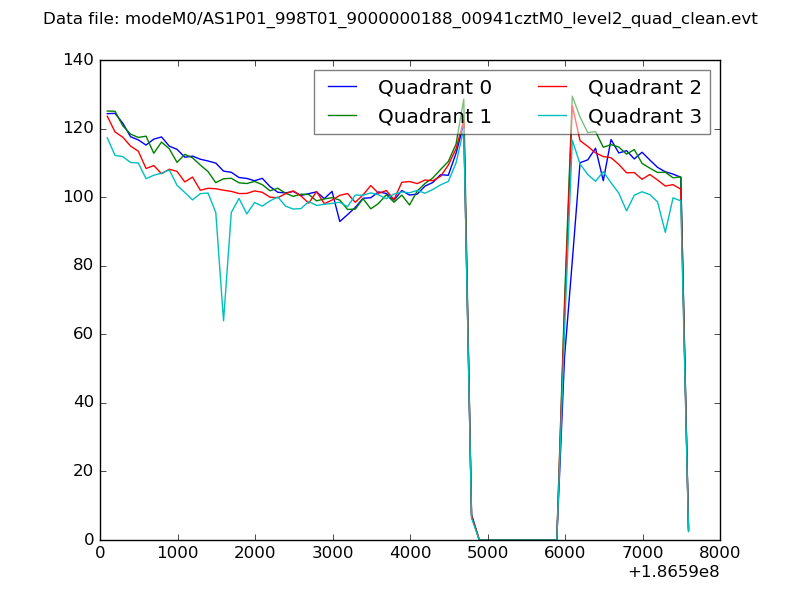
| Quadrant-wise count rates Data is divided into 100 sec bins |
 |
|
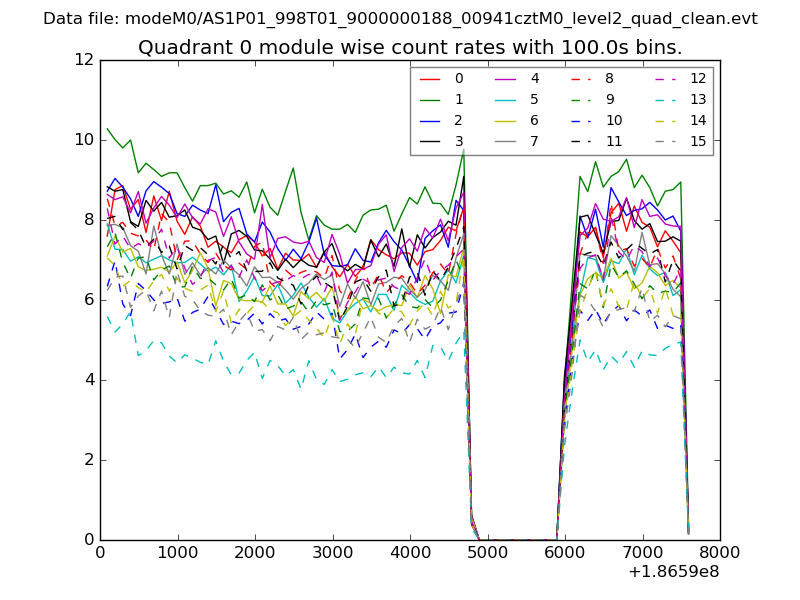
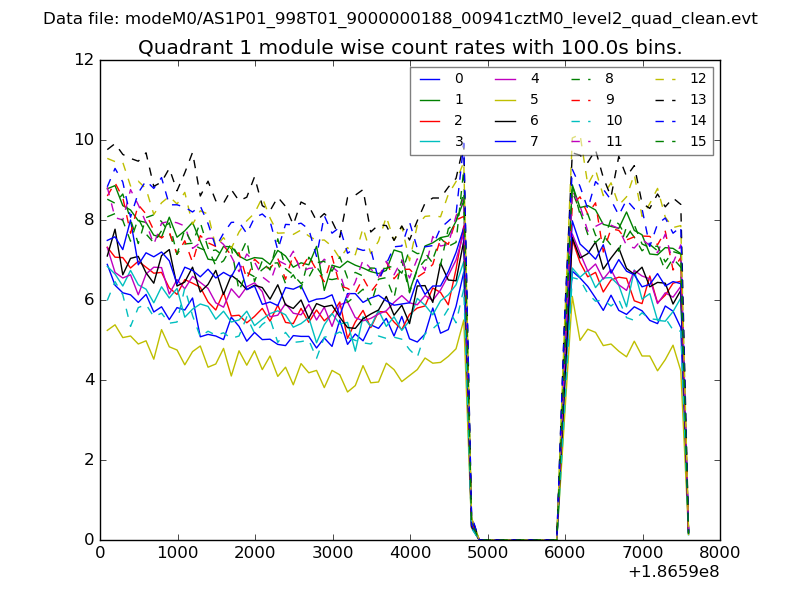
| Module-wise count rates for Quadrant A Data is divided into 100 sec bins |
 |
 |
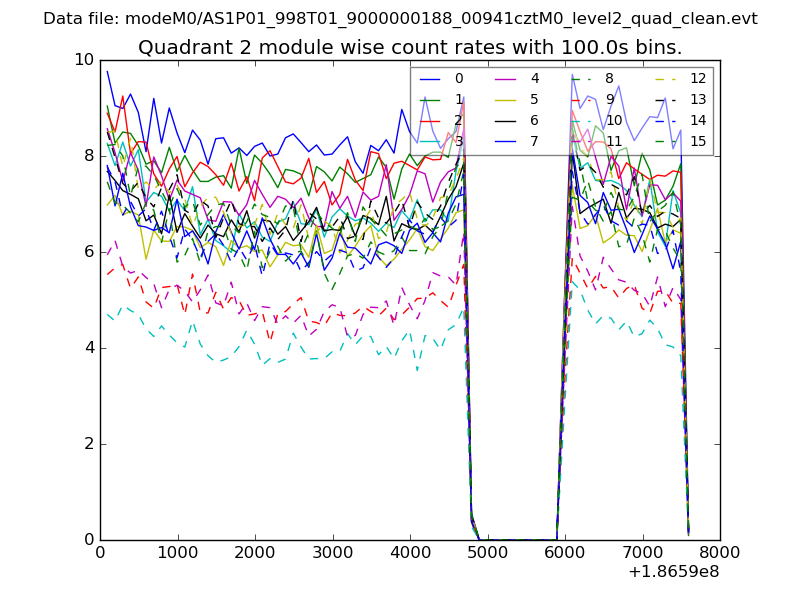
| Module-wise count rates for Quadrant B Data is divided into 100 sec bins |
 |
 |
| Module-wise count rates for Quadrant C Data is divided into 100 sec bins |
 |
 |
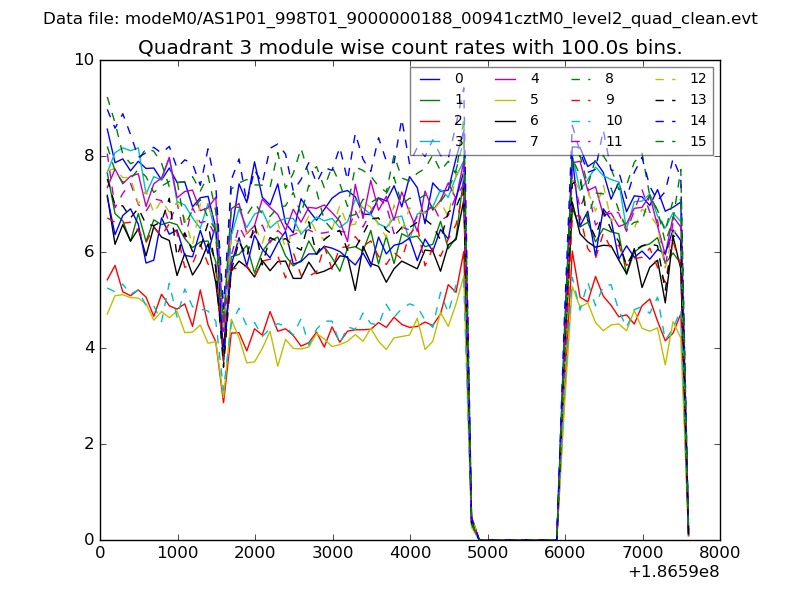
| Module-wise count rates for Quadrant D Data is divided into 100 sec bins |
 |
 |
| Parameter | Plot |
|---|---|
| CZT HV Monitor | 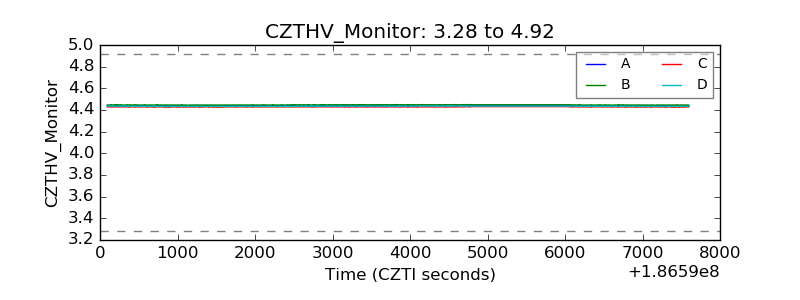 |
| D_VDD | 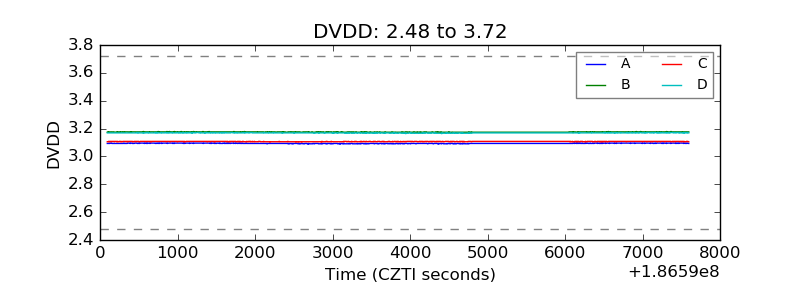 |
| Temperature 1 | 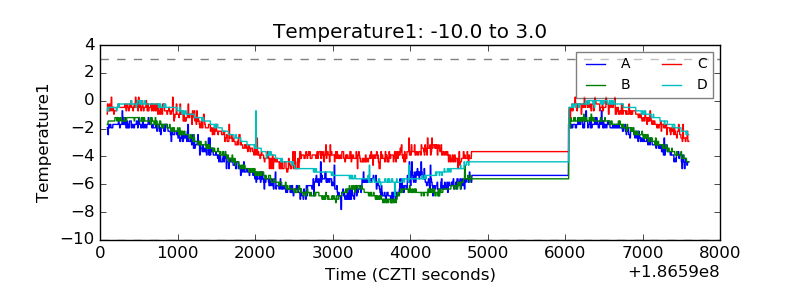 |
| Veto HV Monitor | 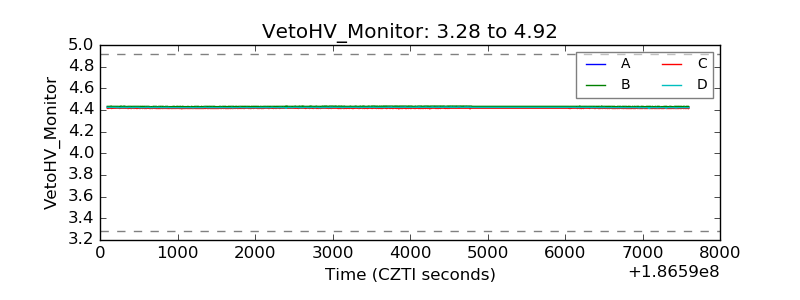 |
| Veto LLD | 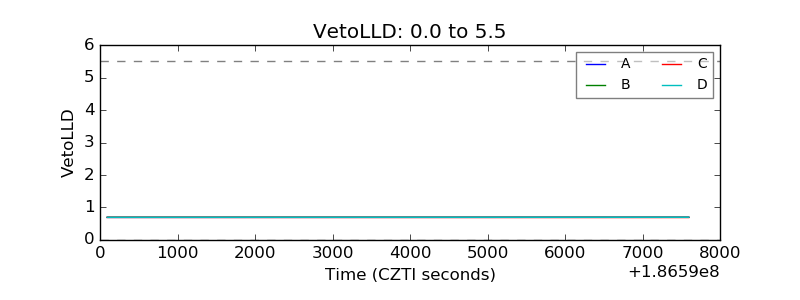 |
| Alpha Counter | 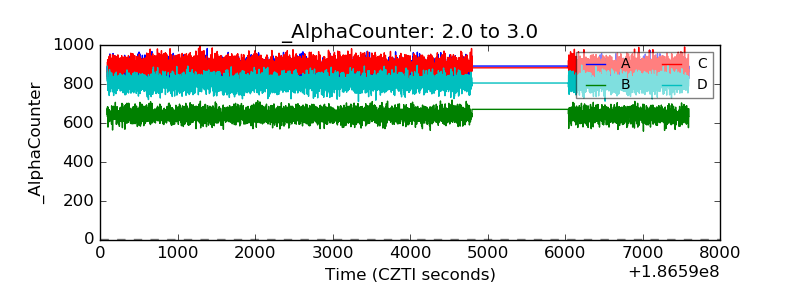 |
| _CPM_Rate | 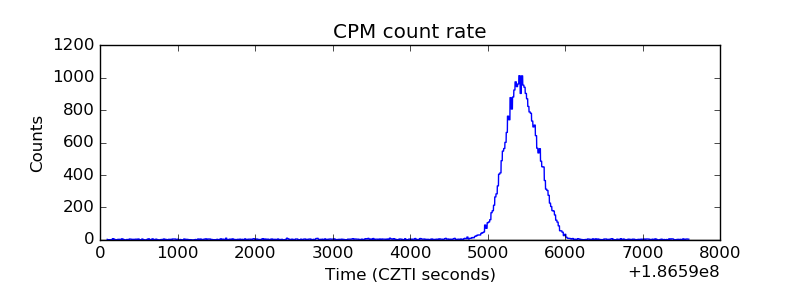 |
| CZT Counter | 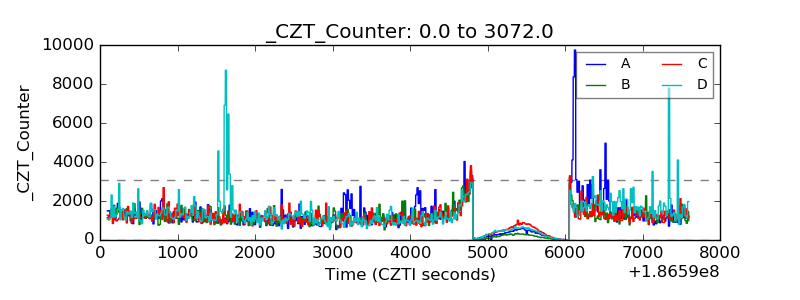 |
| +2.5 Volts monitor |  |
| +5 Volts monitor |  |
| _ROLL_ROT | 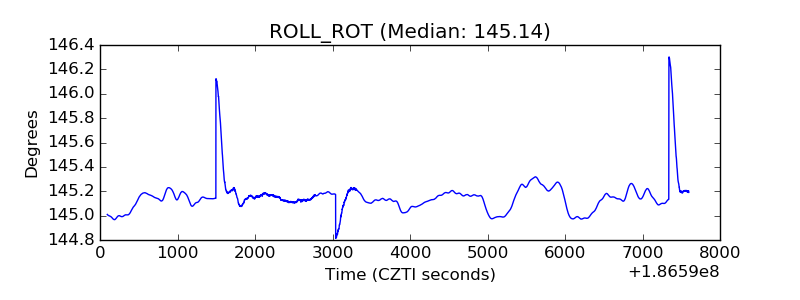 |
| _Roll_DEC | 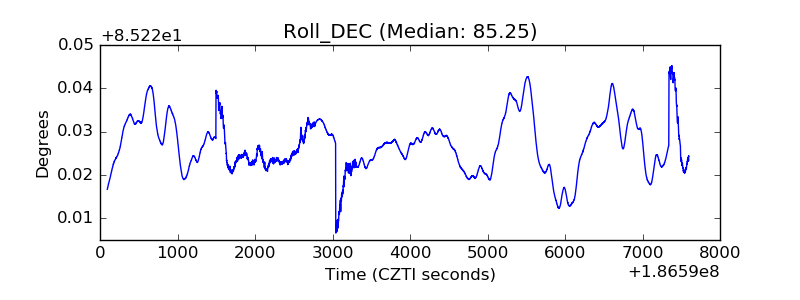 |
| _Roll_RA | 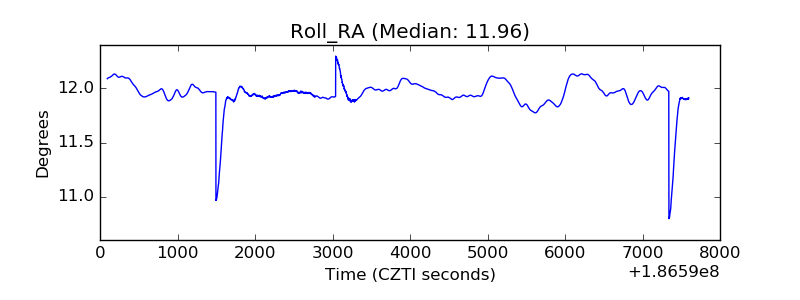 |
| Veto Counter | 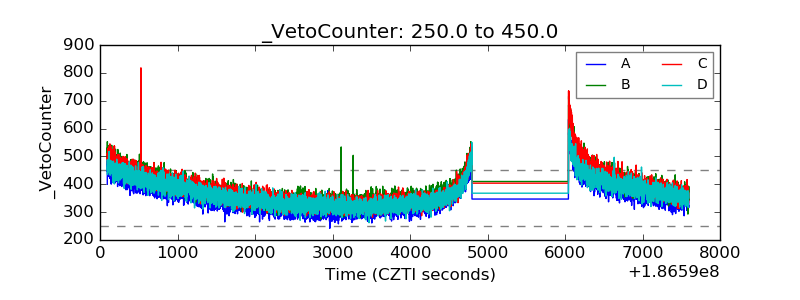 |