| Param | Original file | Final file |
|---|---|---|
| Filename | modeM0/AS1P01_998T01_9000000188_00942cztM0_level2.evt | modeM0/AS1P01_998T01_9000000188_00942cztM0_level2_quad_clean.evt |
| Size (bytes) | 1,128,081,600 | 99,570,240 |
| Size | 1.1 GB | 95.0 MB |
| Events in quadrant A | 7,932,550 | 659,483 |
| Events in quadrant B | 7,901,278 | 659,471 |
| Events in quadrant C | 7,642,626 | 648,374 |
| Events in quadrant D | 10,271,566 | 608,411 |
| Mode M0 | |||
|---|---|---|---|
| Quadrant | BADHDUFLAG | Total packets | Discarded packets |
| A | 0 | 28080 | 0 |
| B | 0 | 27941 | 0 |
| C | 0 | 27161 | 0 |
| D | 0 | 34998 | 0 |
| Mode M9 | |||
|---|---|---|---|
| Quadrant | BADHDUFLAG | Total packets | Discarded packets |
| A | 0 | 12 | 0 |
| B | 0 | 12 | 0 |
| C | 0 | 12 | 0 |
| D | 0 | 12 | 0 |
| Mode SS | |||
|---|---|---|---|
| Quadrant | BADHDUFLAG | Total packets | Discarded packets |
| A | 0 | 128 | 0 |
| B | 0 | 128 | 0 |
| C | 0 | 128 | 0 |
| D | 0 | 128 | 0 |
| Quadrant | Total seconds | Saturated seconds | Saturation percentage |
|---|---|---|---|
| A | 6298 | 60 | 0.952683% |
| B | 6298 | 6 | 0.095268% |
| C | 6299 | 16 | 0.254009% |
| D | 6299 | 378 | 6.000953% |
Noise dominated data is calculated using 1-second bins in cleaned event files. If a bin has >2000 counts, and if more than 50% of those come from <1% of pixels, then it is considered to be noise-dominated and hence unusable.
| Quadrant | # 1 sec bins | Bins with >0 counts | Bins with >2000 counts | High rate bins dominated by noise | Noise dominated (total time) | Noise dominated (detector-on time) | Marked lightcurve |
|---|---|---|---|---|---|---|---|
| A | 7473 | 6299 | 432 | 432 | 5.78% | 6.86% | 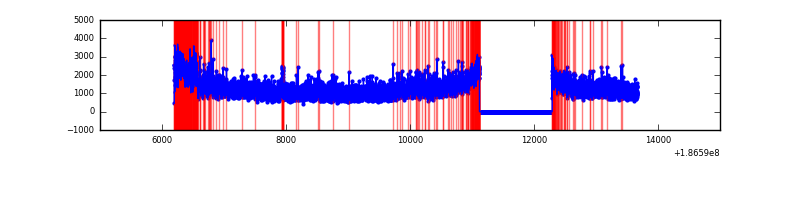 |
| B | 7473 | 6299 | 227 | 227 | 3.04% | 3.60% | 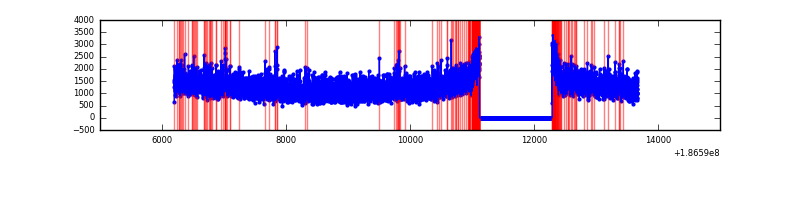 |
| C | 7474 | 6300 | 171 | 171 | 2.29% | 2.71% | 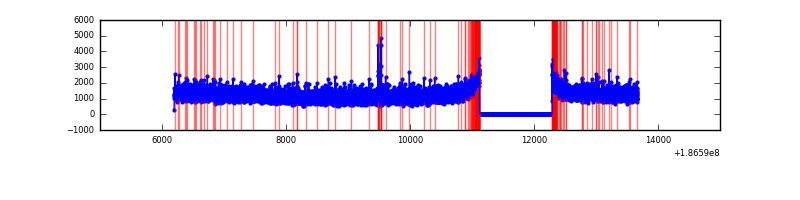 |
| D | 7474 | 6300 | 1505 | 1505 | 20.14% | 23.89% | 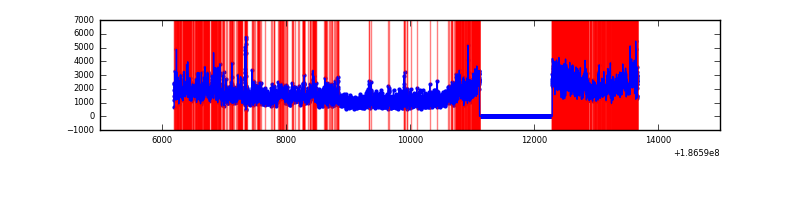 |
Top three noisy pixels from each quadrant. If the there are fewer than three noisy pixels in the level2.evt file, extra rows are filled as -1
| Pixel properties | Quadrant properties | ||||||
|---|---|---|---|---|---|---|---|
| Quadrant | DetID | PixID | Counts | Sigma | Mean | Median | Sigma |
| A | 14 | 170 | 424351 | 923.94 | 1912 | 1920 | 457.2 |
| A | 13 | 147 | 165580 | 357.96 | 1912 | 1920 | 457.2 |
| A | 13 | 193 | 6834 | 10.75 | 1912 | 1920 | 457.2 |
| B | 0 | 220 | 105898 | 223.88 | 1995 | 2002 | 464.1 |
| B | 8 | 234 | 55636 | 115.57 | 1995 | 2002 | 464.1 |
| B | 4 | 232 | 28012 | 56.05 | 1995 | 2002 | 464.1 |
| C | 15 | 241 | 240295 | 470.37 | 1848 | 1916 | 506.8 |
| C | 9 | 144 | 104656 | 202.73 | 1848 | 1916 | 506.8 |
| C | 10 | 34 | 30428 | 56.26 | 1848 | 1916 | 506.8 |
| D | 12 | 188 | 2571208 | 4764.76 | 1762 | 1825 | 539.2 |
| D | 1 | 4 | 694420 | 1284.37 | 1762 | 1825 | 539.2 |
| D | 12 | 22 | 156414 | 286.68 | 1762 | 1825 | 539.2 |
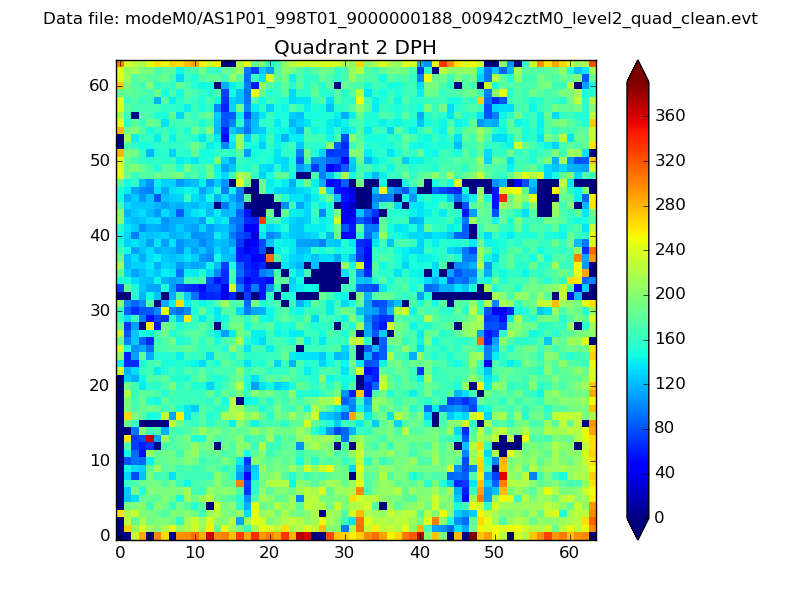
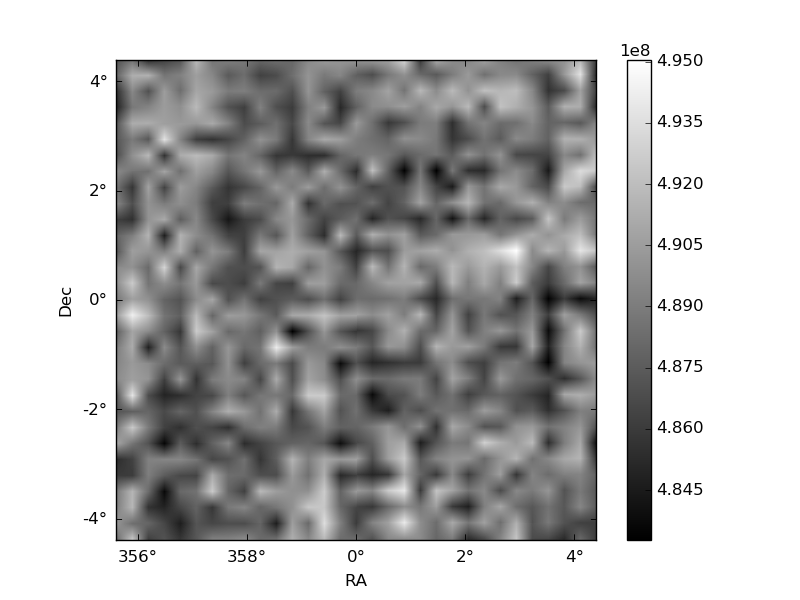
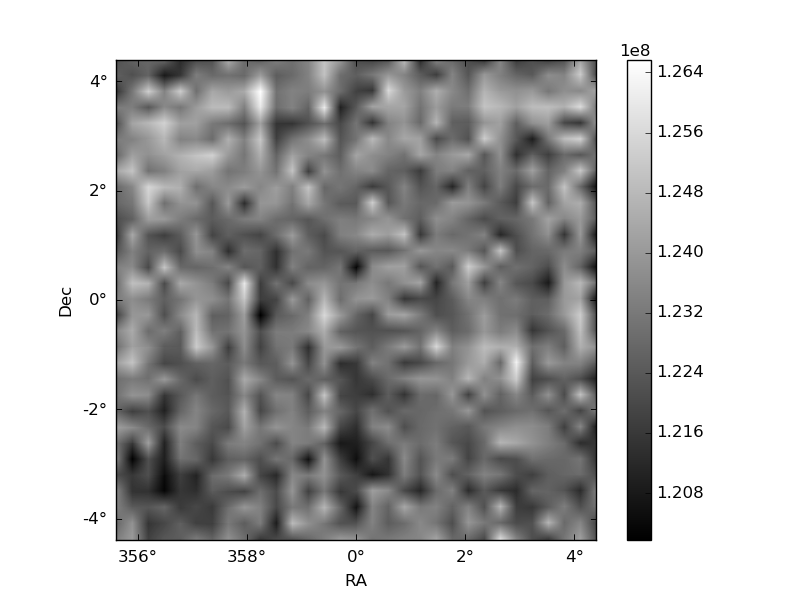
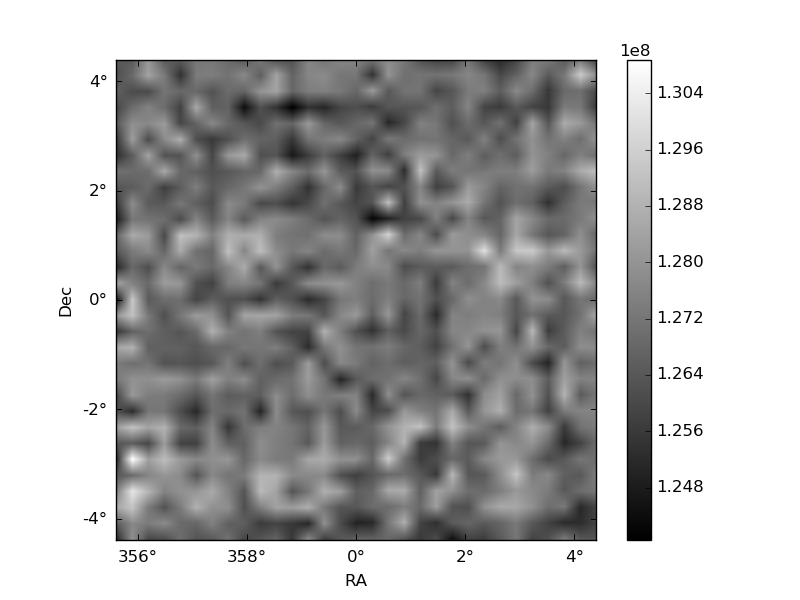
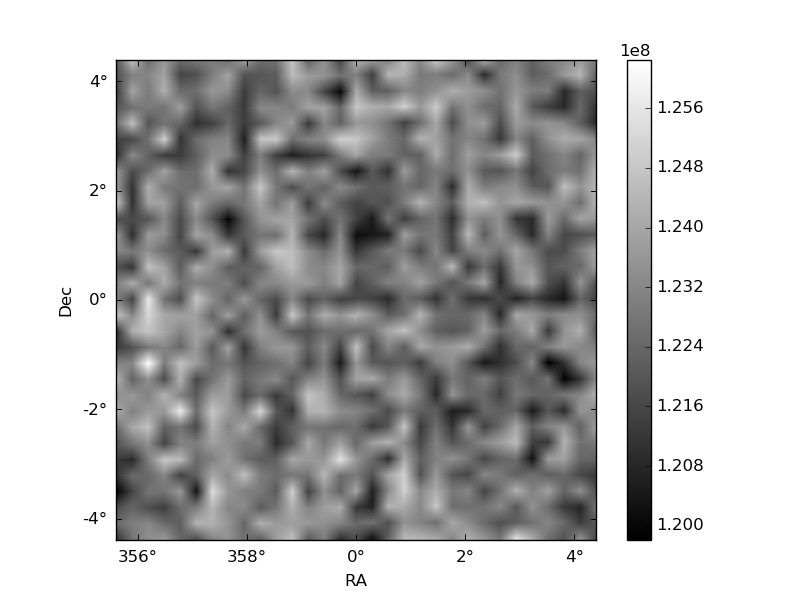
Histogram calculated using DETX and DETY for each event in the final _common_clean file
| Quadrant A | 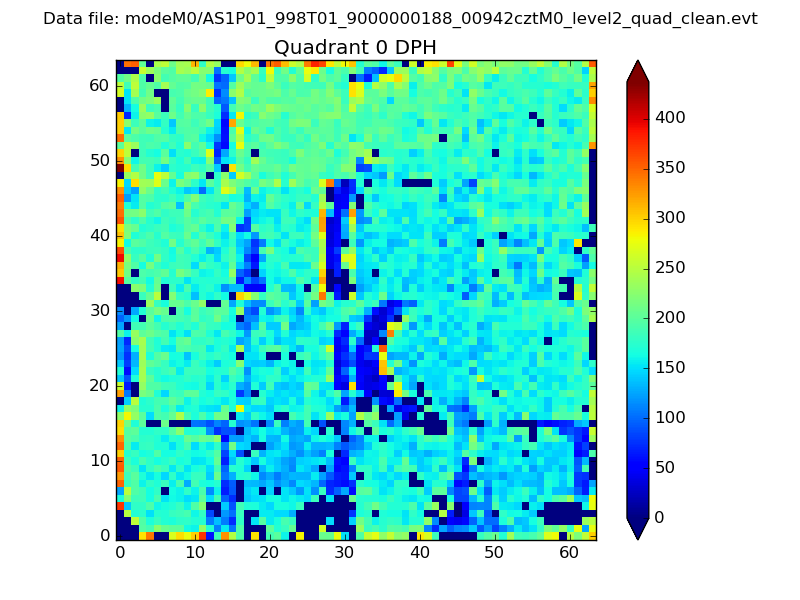 |
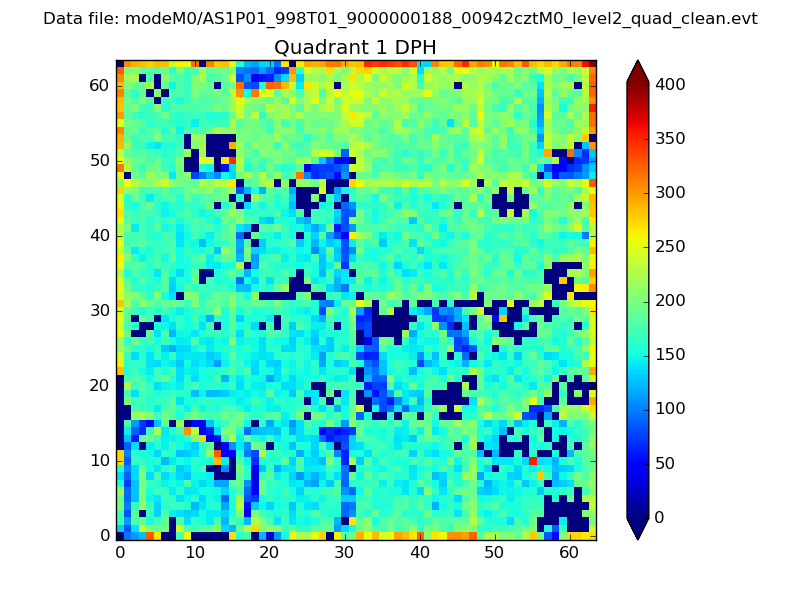 |
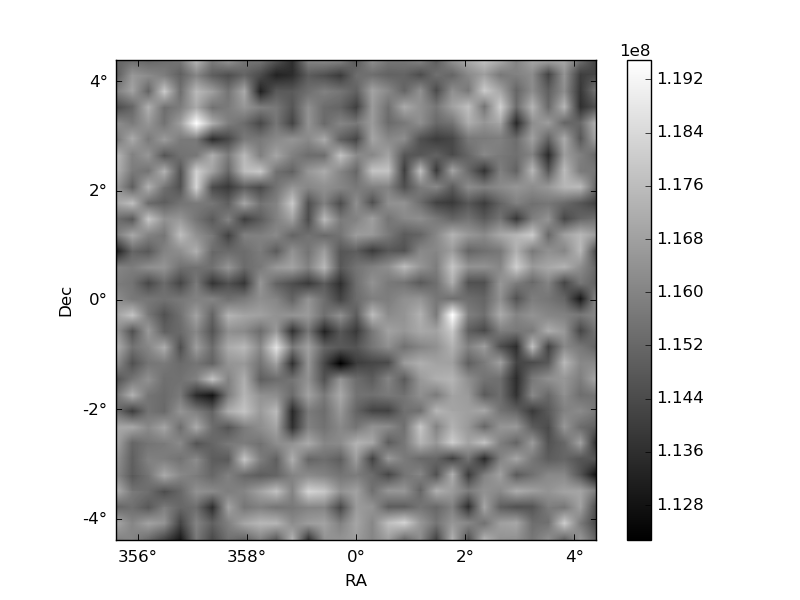
Quadrant B |
|---|---|---|---|
| Quadrant D | 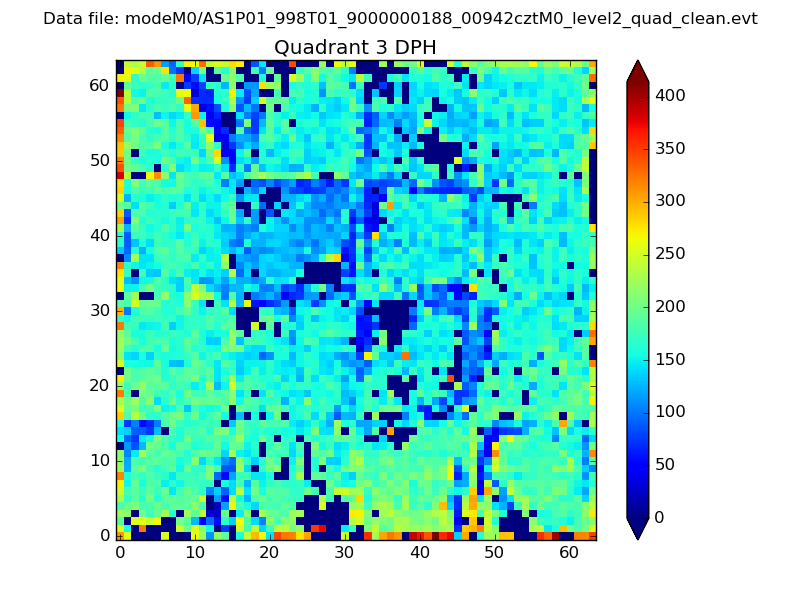 |
 |
Quadrant C |
| Plot type | Count rate plots | Images |
|---|---|---|
| Comparison with Poisson distribution Blue bars denote a histogram of data divided into 1 sec bins. Red curve is a Poisson curve with rate = median count rate of data. |
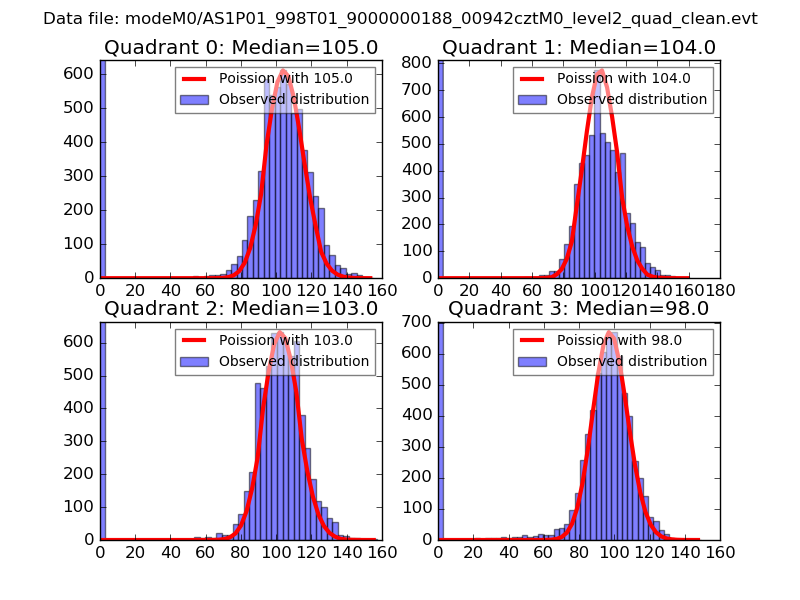 |
 |
| Quadrant-wise count rates Data is divided into 100 sec bins |
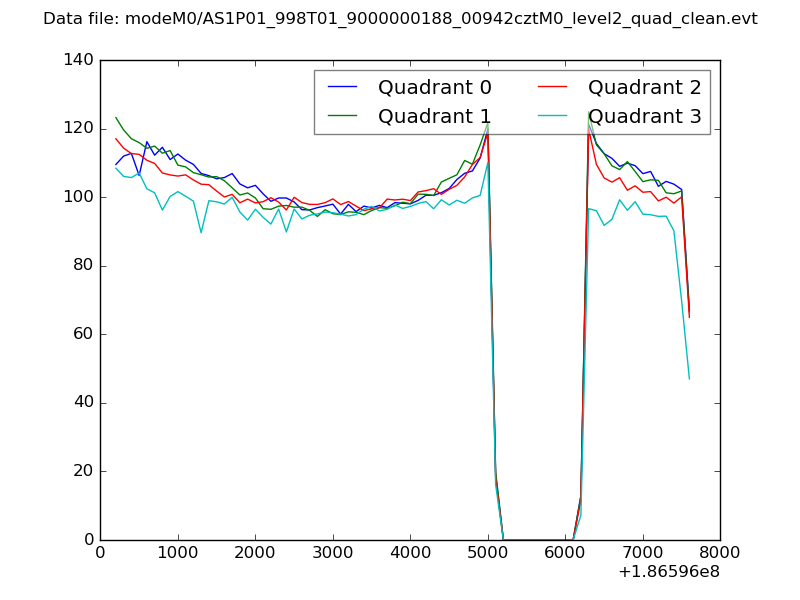 |
|
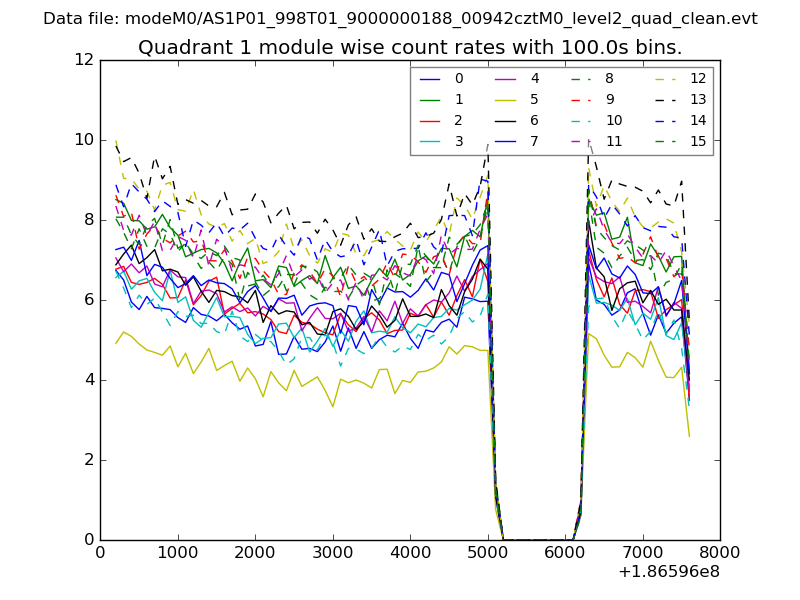
| Module-wise count rates for Quadrant A Data is divided into 100 sec bins |
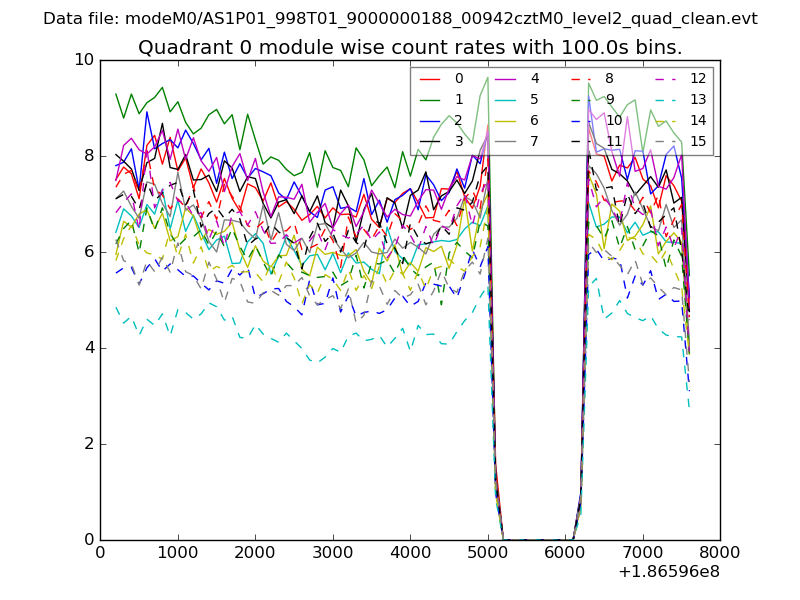 |
 |
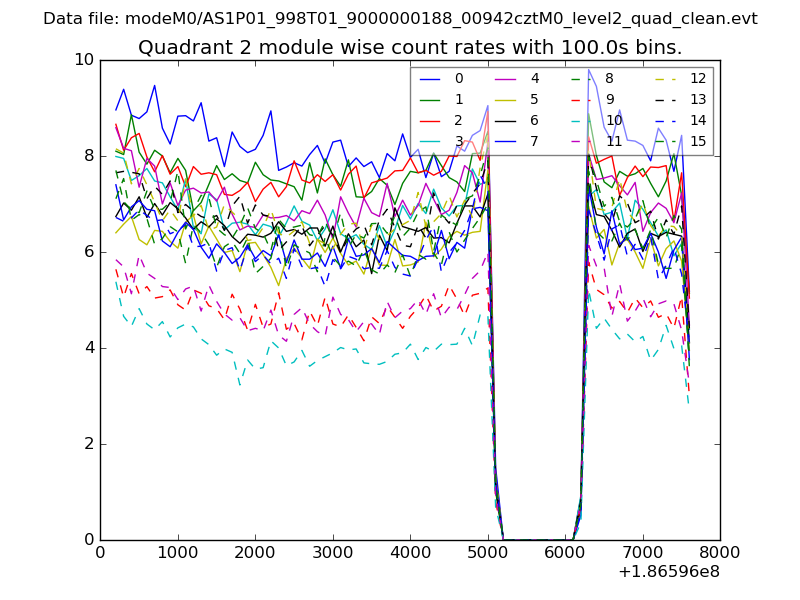
| Module-wise count rates for Quadrant B Data is divided into 100 sec bins |
 |
 |
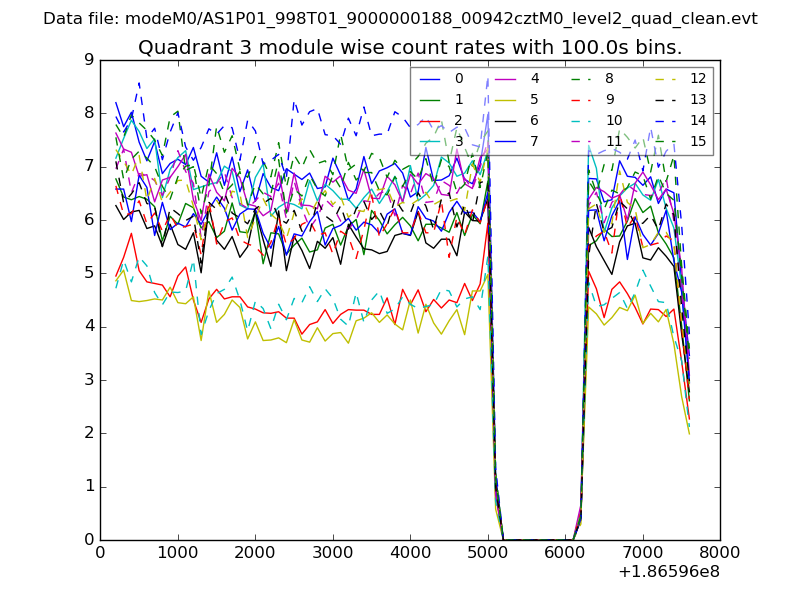
| Module-wise count rates for Quadrant C Data is divided into 100 sec bins |
 |
 |
| Module-wise count rates for Quadrant D Data is divided into 100 sec bins |
 |
 |
| Parameter | Plot |
|---|---|
| CZT HV Monitor | 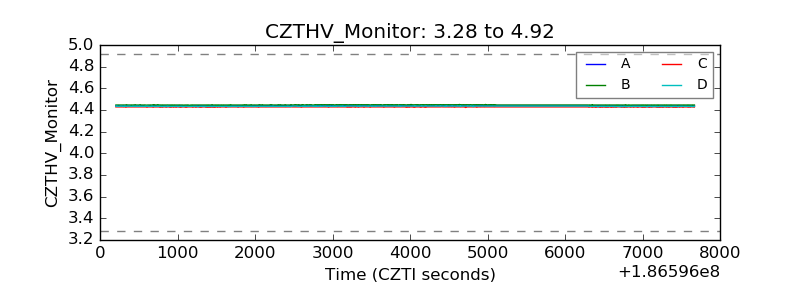 |
| D_VDD | 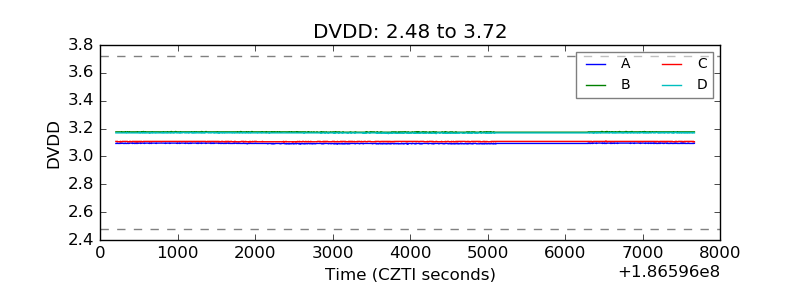 |
| Temperature 1 | 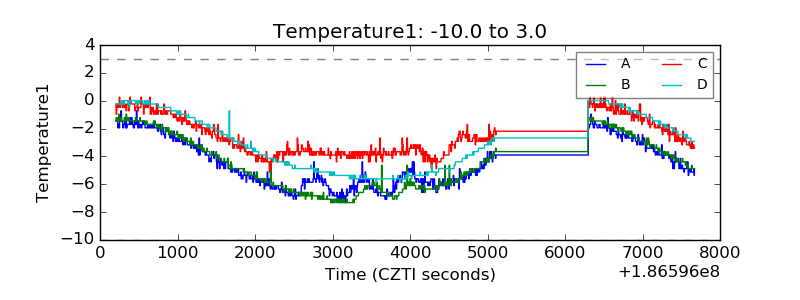 |
| Veto HV Monitor | 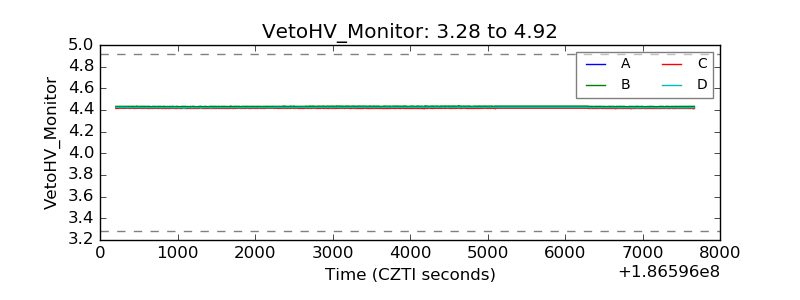 |
| Veto LLD | 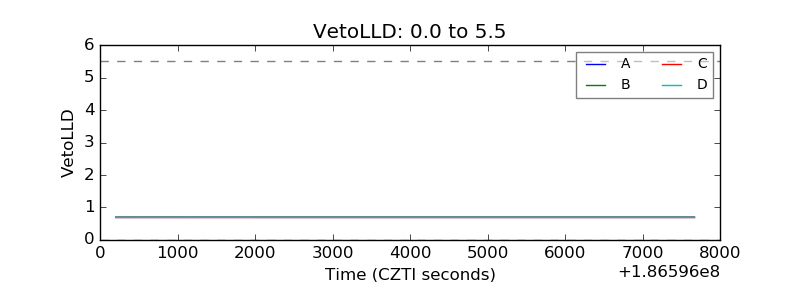 |
| Alpha Counter | 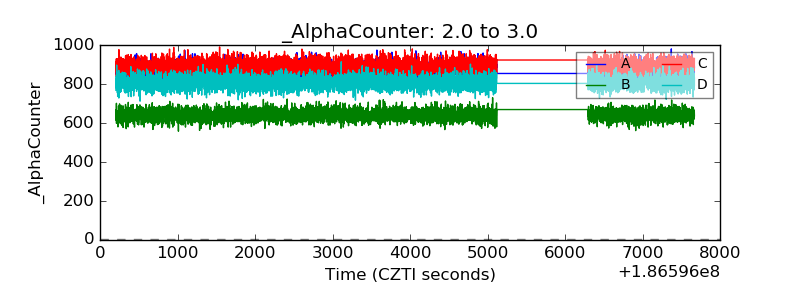 |
| _CPM_Rate | 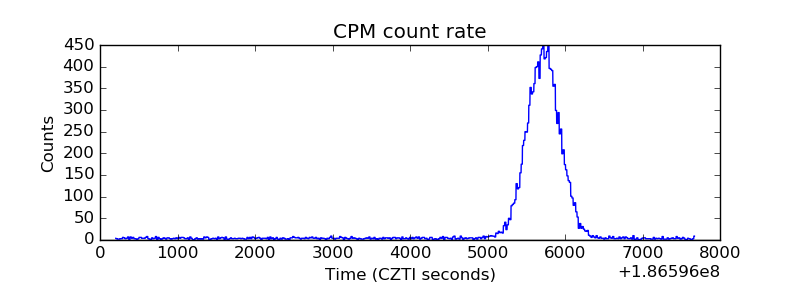 |
| CZT Counter | 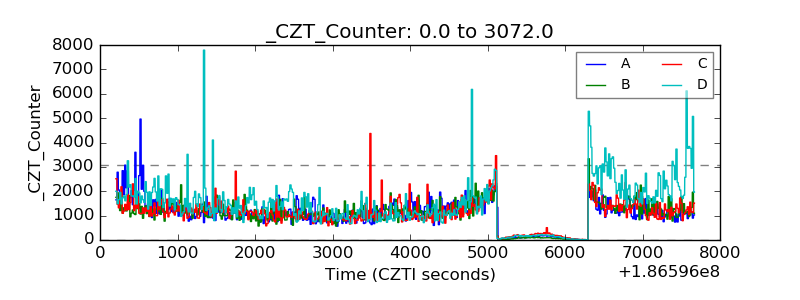 |
| +2.5 Volts monitor |  |
| +5 Volts monitor | 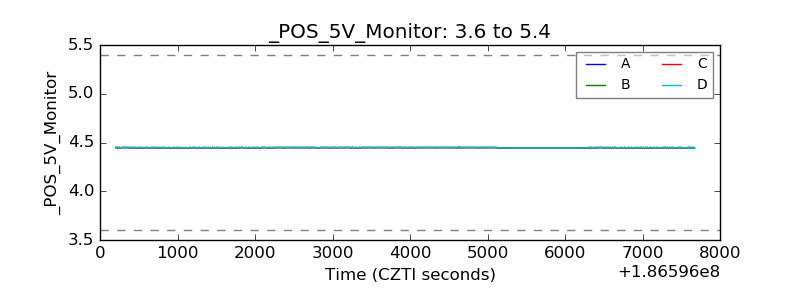 |
| _ROLL_ROT | 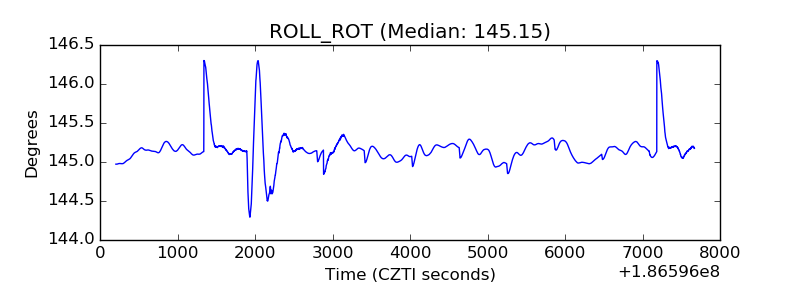 |
| _Roll_DEC | 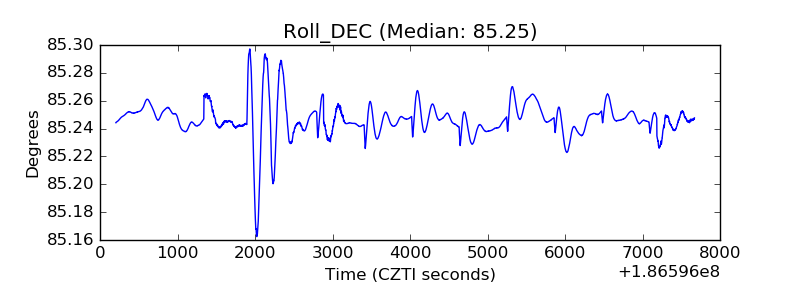 |
| _Roll_RA | 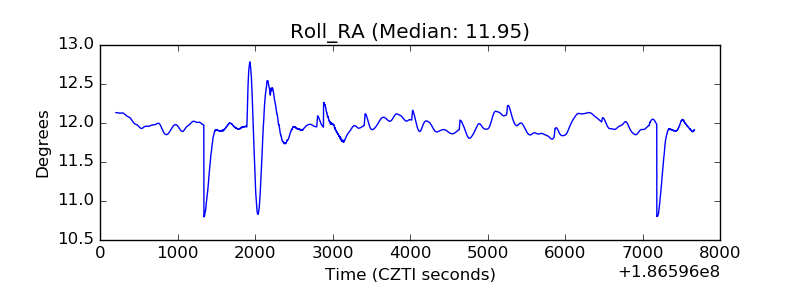 |
| Veto Counter | 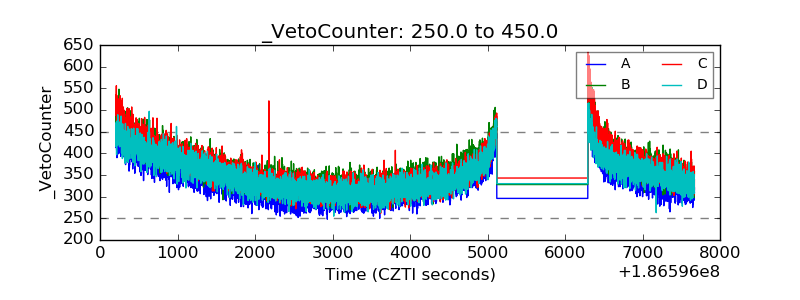 |