| Param | Original file | Final file |
|---|---|---|
| Filename | modeM0/AS1P01_998T01_9000000188_00945cztM0_level2.evt | modeM0/AS1P01_998T01_9000000188_00945cztM0_level2_quad_clean.evt |
| Size (bytes) | 1,303,836,480 | 115,459,200 |
| Size | 1.2 GB | 110.1 MB |
| Events in quadrant A | 9,399,977 | 755,077 |
| Events in quadrant B | 9,875,784 | 749,993 |
| Events in quadrant C | 9,815,254 | 738,425 |
| Events in quadrant D | 9,888,770 | 719,582 |
| Mode M0 | |||
|---|---|---|---|
| Quadrant | BADHDUFLAG | Total packets | Discarded packets |
| A | 0 | 33396 | 0 |
| B | 0 | 34795 | 0 |
| C | 0 | 34557 | 0 |
| D | 0 | 34826 | 0 |
| Mode SS | |||
|---|---|---|---|
| Quadrant | BADHDUFLAG | Total packets | Discarded packets |
| A | 0 | 154 | 0 |
| B | 0 | 154 | 0 |
| C | 0 | 154 | 0 |
| D | 0 | 154 | 0 |
| Quadrant | Total seconds | Saturated seconds | Saturation percentage |
|---|---|---|---|
| A | 7672 | 3 | 0.039103% |
| B | 7672 | 61 | 0.795099% |
| C | 7673 | 14 | 0.182458% |
| D | 7673 | 100 | 1.303271% |
Noise dominated data is calculated using 1-second bins in cleaned event files. If a bin has >2000 counts, and if more than 50% of those come from <1% of pixels, then it is considered to be noise-dominated and hence unusable.
| Quadrant | # 1 sec bins | Bins with >0 counts | Bins with >2000 counts | High rate bins dominated by noise | Noise dominated (total time) | Noise dominated (detector-on time) | Marked lightcurve |
|---|---|---|---|---|---|---|---|
| A | 7672 | 7672 | 282 | 282 | 3.68% | 3.68% | 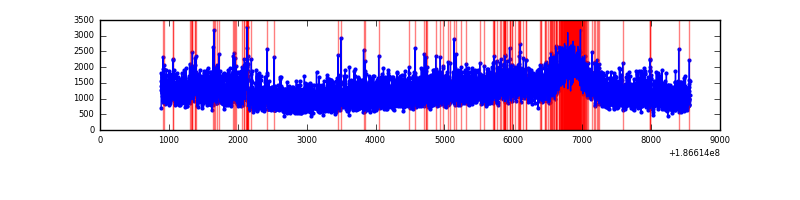 |
| B | 7672 | 7672 | 458 | 458 | 5.97% | 5.97% | 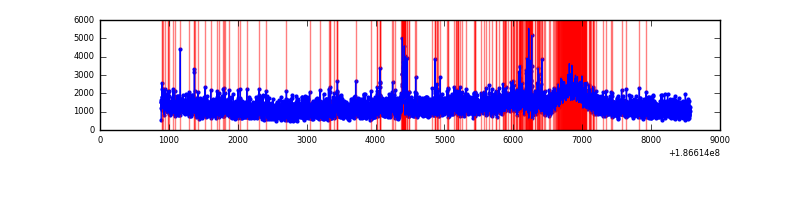 |
| C | 7673 | 7673 | 508 | 508 | 6.62% | 6.62% | 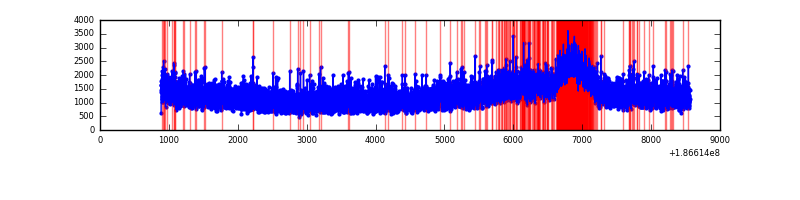 |
| D | 7673 | 7673 | 718 | 718 | 9.36% | 9.36% | 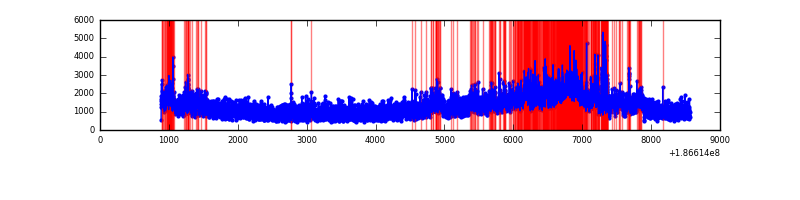 |
Top three noisy pixels from each quadrant. If the there are fewer than three noisy pixels in the level2.evt file, extra rows are filled as -1
| Pixel properties | Quadrant properties | ||||||
|---|---|---|---|---|---|---|---|
| Quadrant | DetID | PixID | Counts | Sigma | Mean | Median | Sigma |
| A | 14 | 170 | 370391 | 648.9 | 2351 | 2370 | 567.1 |
| A | 12 | 189 | 12196 | 17.33 | 2351 | 2370 | 567.1 |
| A | 11 | 79 | 8378 | 10.59 | 2351 | 2370 | 567.1 |
| B | 5 | 249 | 285122 | 487.76 | 2463 | 2462 | 579.5 |
| B | 4 | 232 | 59654 | 98.69 | 2463 | 2462 | 579.5 |
| B | 15 | 22 | 56141 | 92.63 | 2463 | 2462 | 579.5 |
| C | 10 | 34 | 458671 | 719.99 | 2274 | 2352 | 633.8 |
| C | 15 | 241 | 403498 | 632.93 | 2274 | 2352 | 633.8 |
| C | 3 | 111 | 36858 | 54.44 | 2274 | 2352 | 633.8 |
| D | 12 | 188 | 779291 | 1156.75 | 2166 | 2242 | 671.8 |
| D | 1 | 4 | 759890 | 1127.86 | 2166 | 2242 | 671.8 |
| D | 12 | 22 | 141843 | 207.82 | 2166 | 2242 | 671.8 |
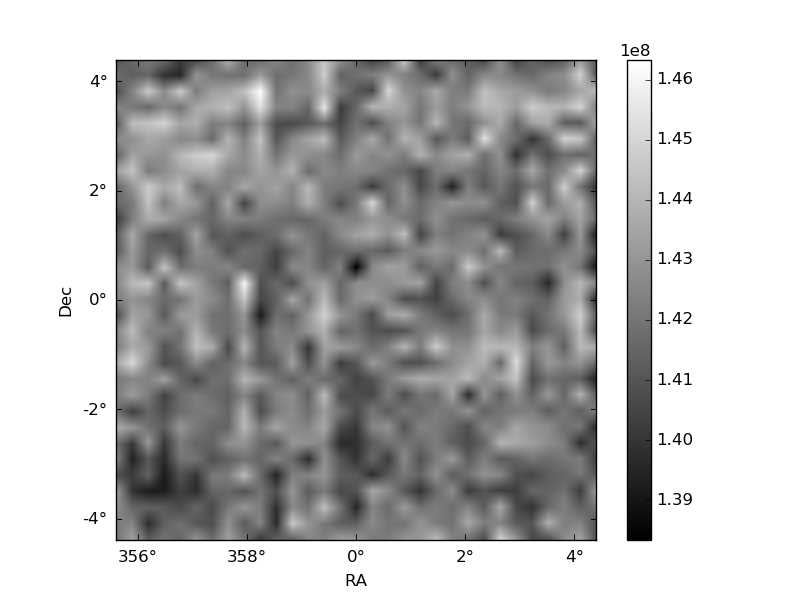
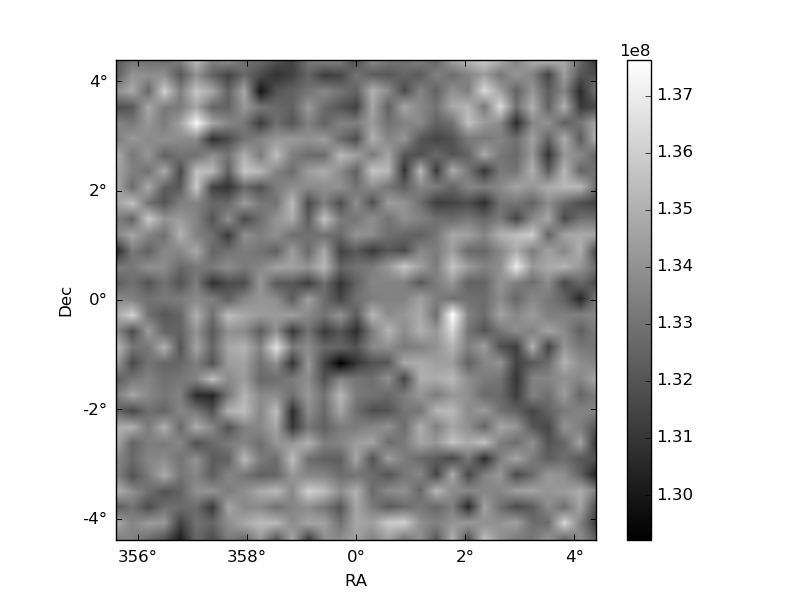
Histogram calculated using DETX and DETY for each event in the final _common_clean file
| Quadrant A | 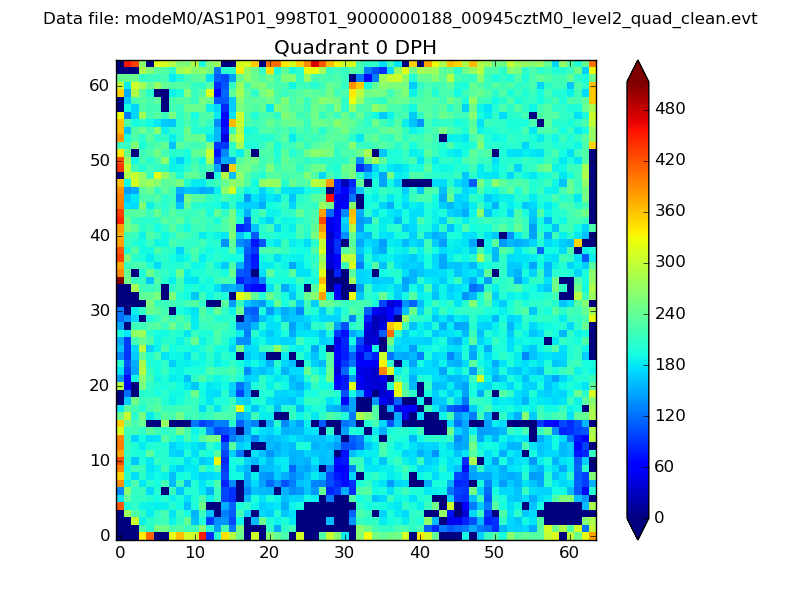 |
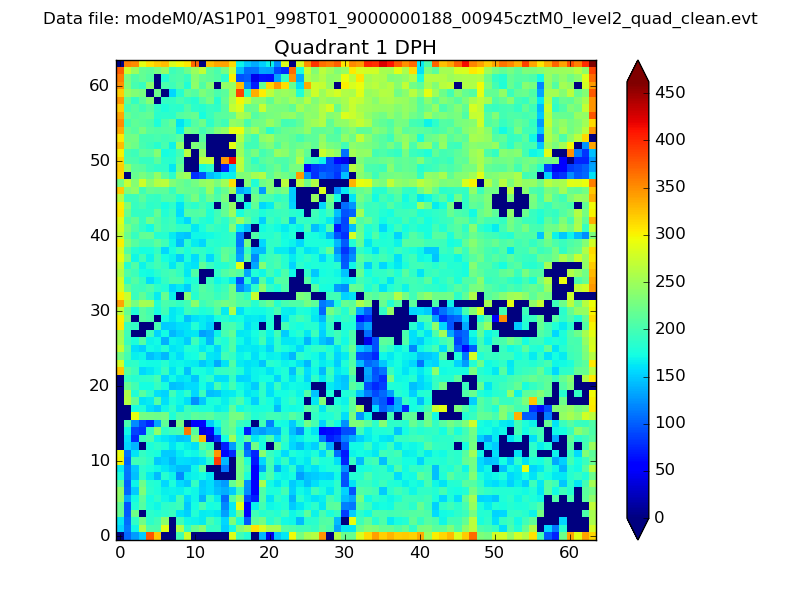 |
Quadrant B |
|---|---|---|---|
| Quadrant D | 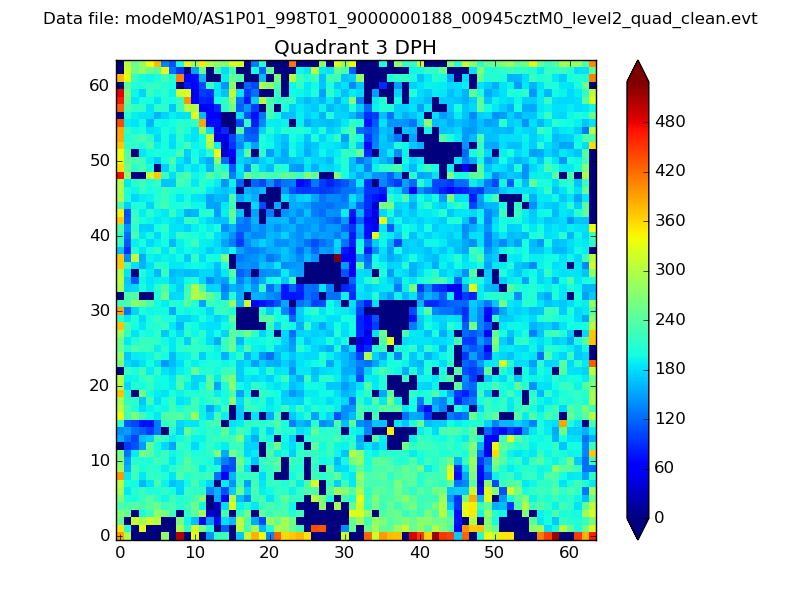 |
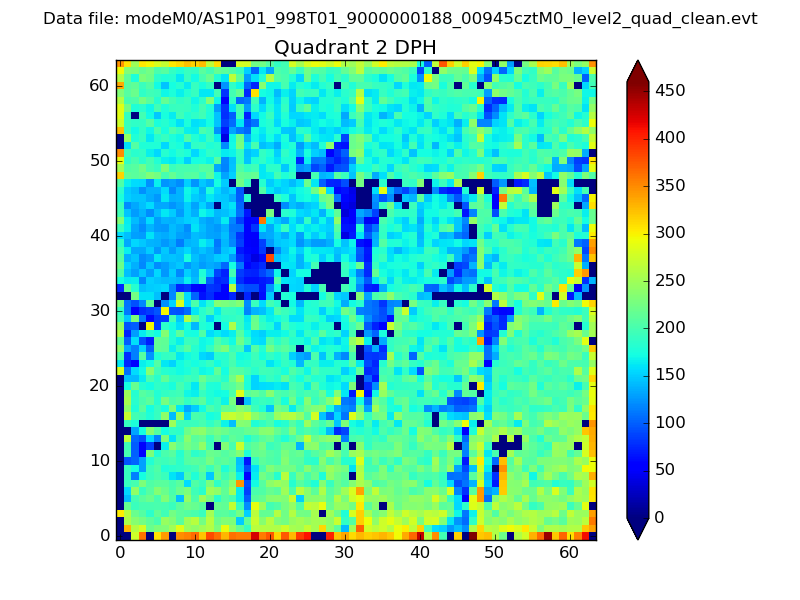 |
Quadrant C |
| Plot type | Count rate plots | Images |
|---|---|---|
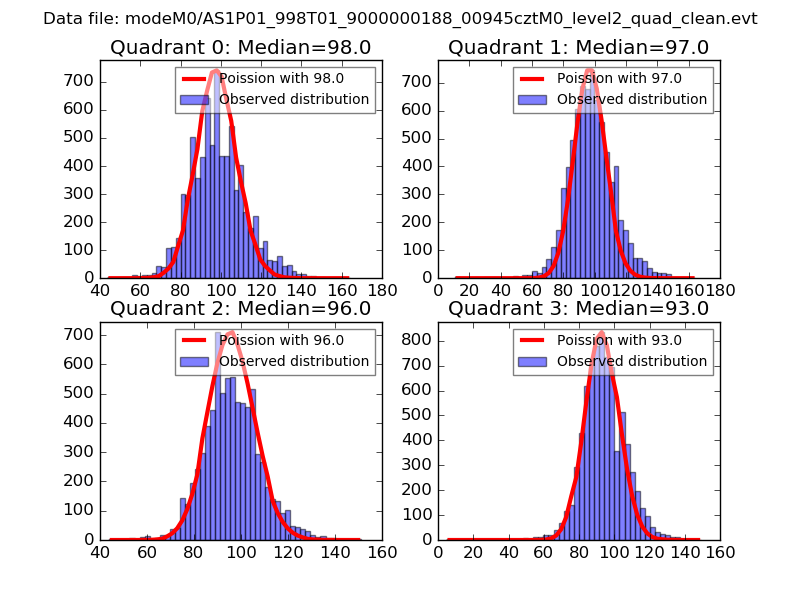
| Comparison with Poisson distribution Blue bars denote a histogram of data divided into 1 sec bins. Red curve is a Poisson curve with rate = median count rate of data. |
 |
 |
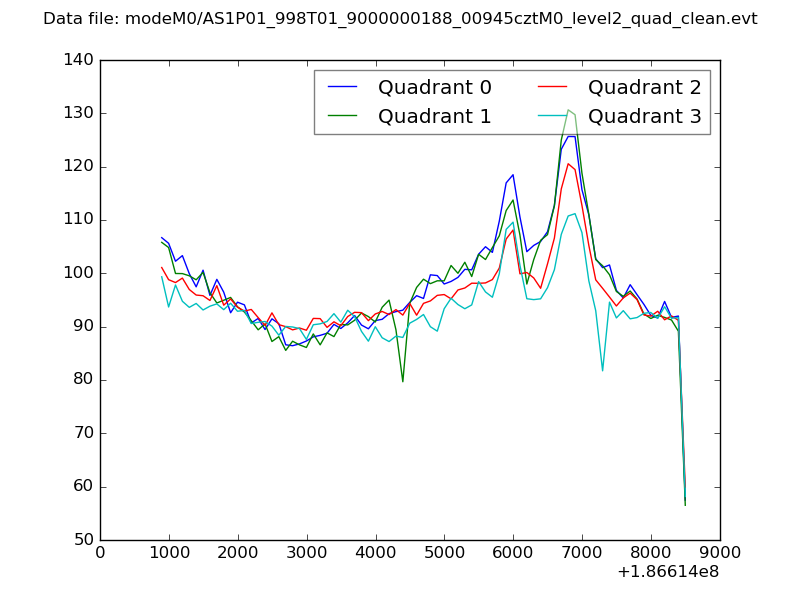
| Quadrant-wise count rates Data is divided into 100 sec bins |
 |
|
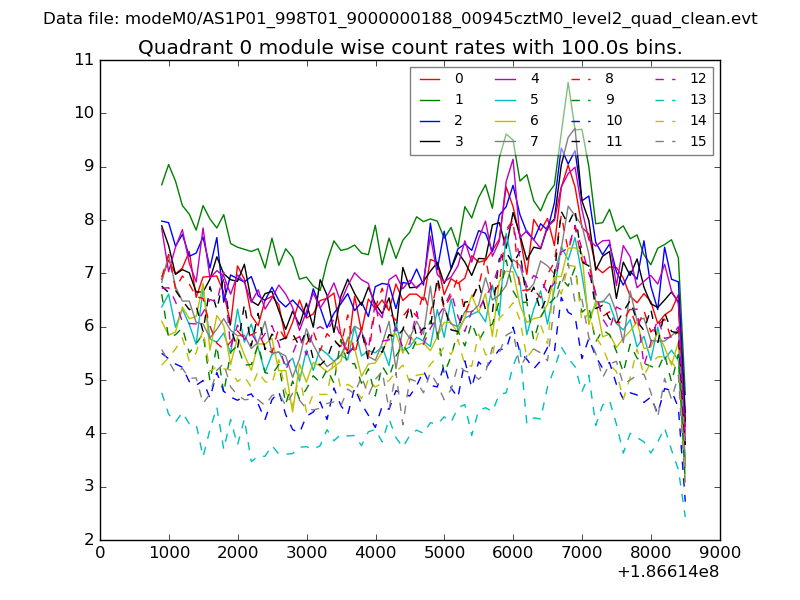
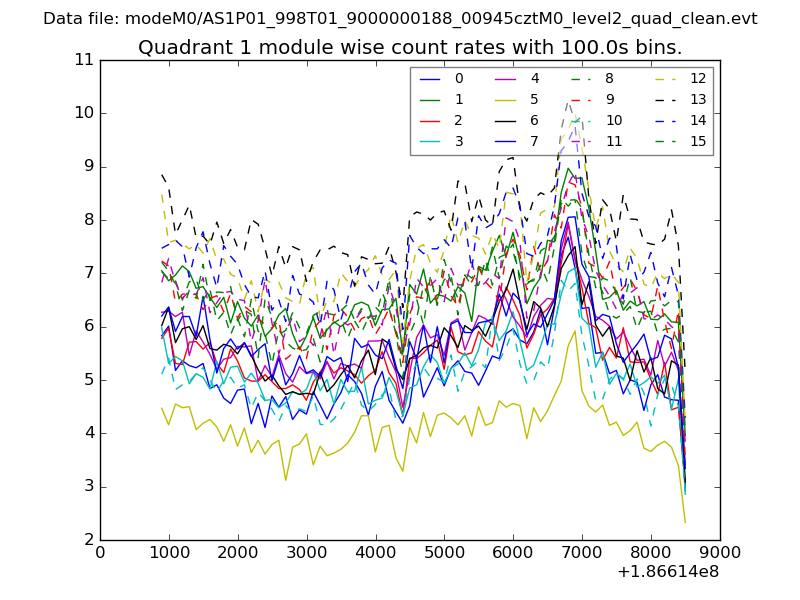
| Module-wise count rates for Quadrant A Data is divided into 100 sec bins |
 |
 |
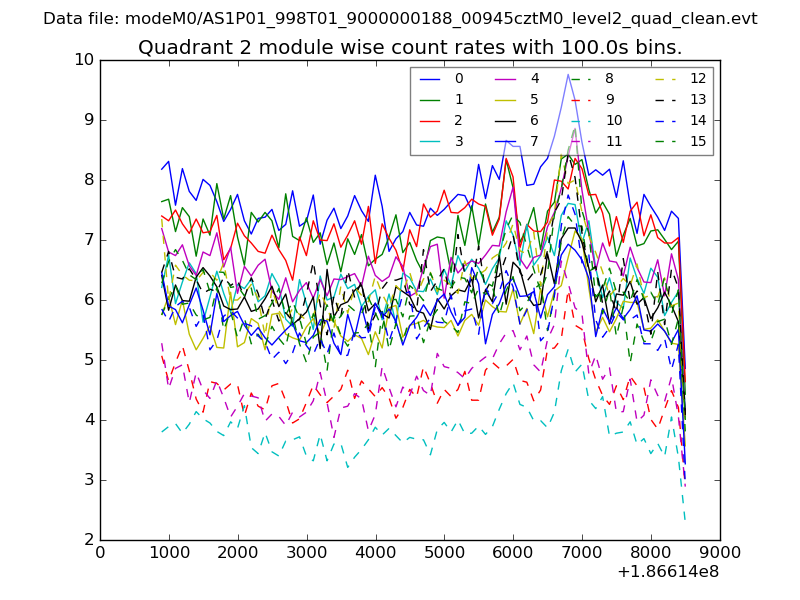
| Module-wise count rates for Quadrant B Data is divided into 100 sec bins |
 |
 |
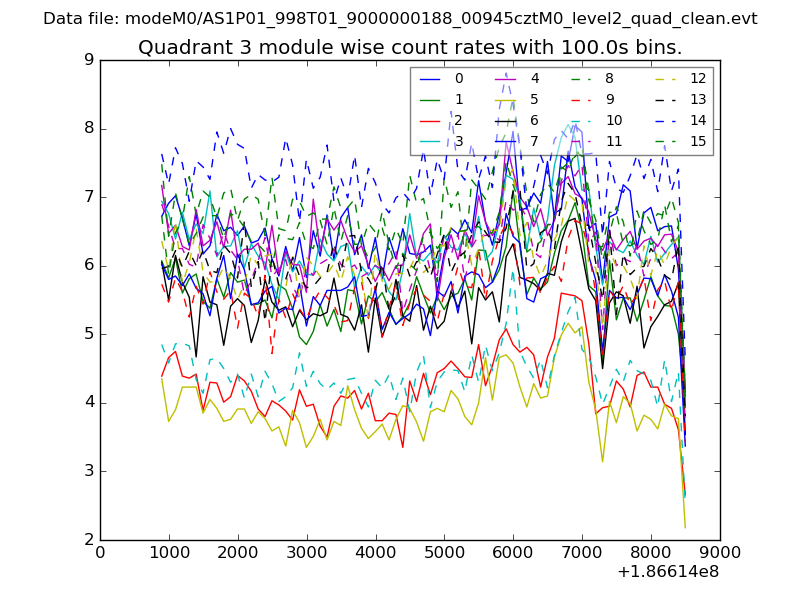
| Module-wise count rates for Quadrant C Data is divided into 100 sec bins |
 |
 |
| Module-wise count rates for Quadrant D Data is divided into 100 sec bins |
 |
 |
| Parameter | Plot |
|---|---|
| CZT HV Monitor | 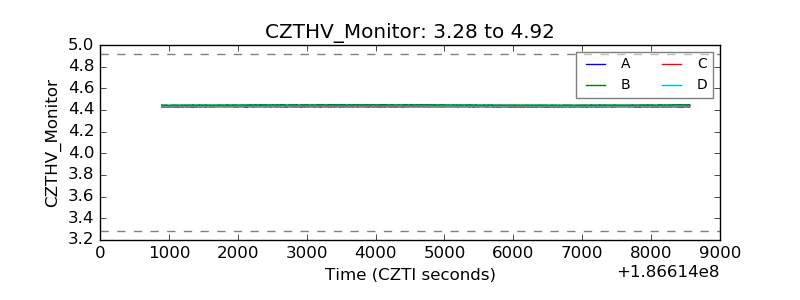 |
| D_VDD | 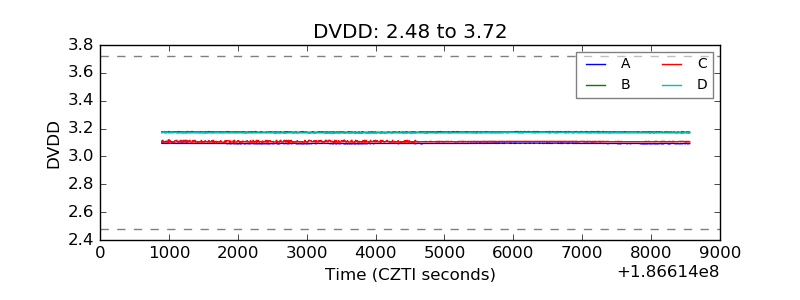 |
| Temperature 1 | 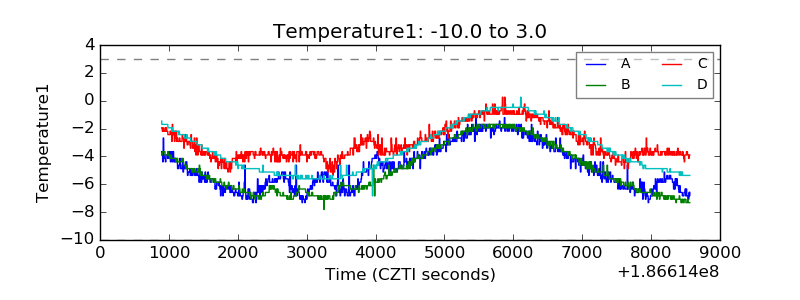 |
| Veto HV Monitor | 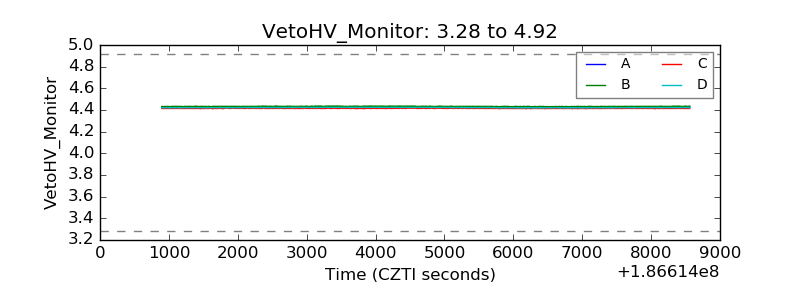 |
| Veto LLD | 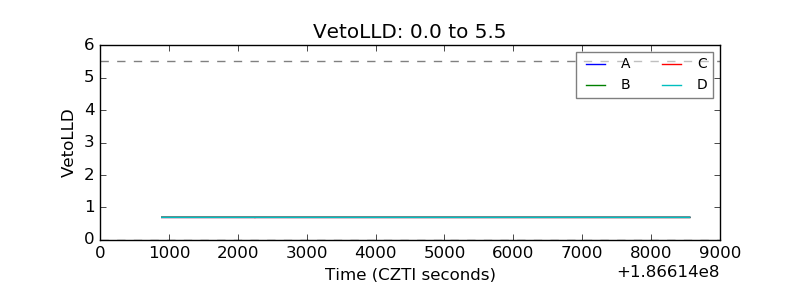 |
| Alpha Counter | 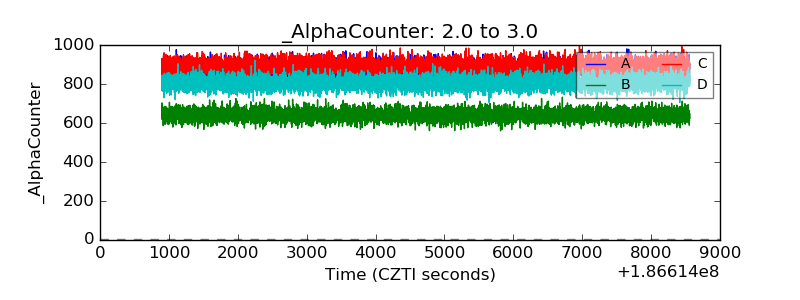 |
| _CPM_Rate | 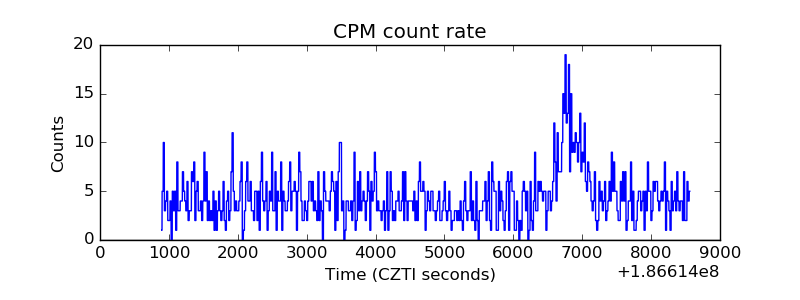 |
| CZT Counter | 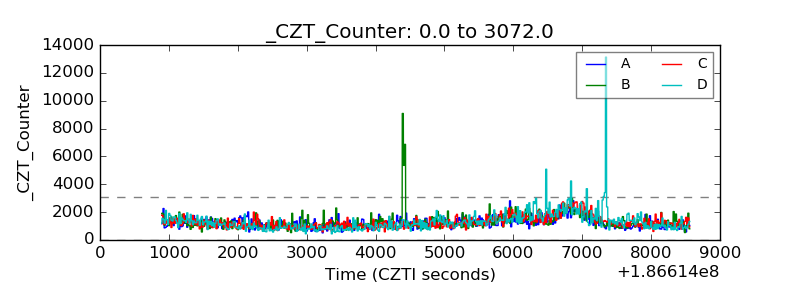 |
| +2.5 Volts monitor | 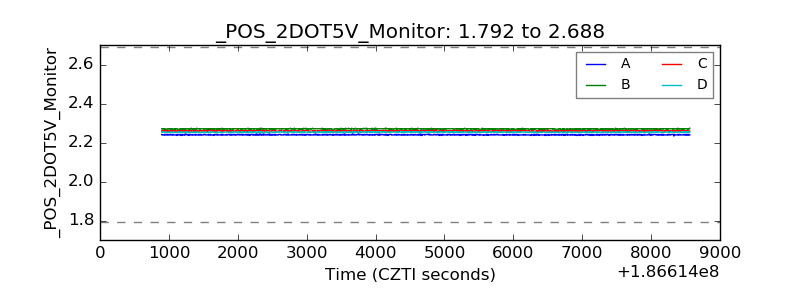 |
| +5 Volts monitor |  |
| _ROLL_ROT | 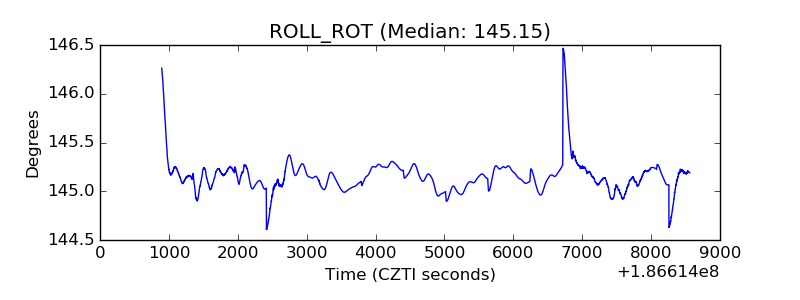 |
| _Roll_DEC | 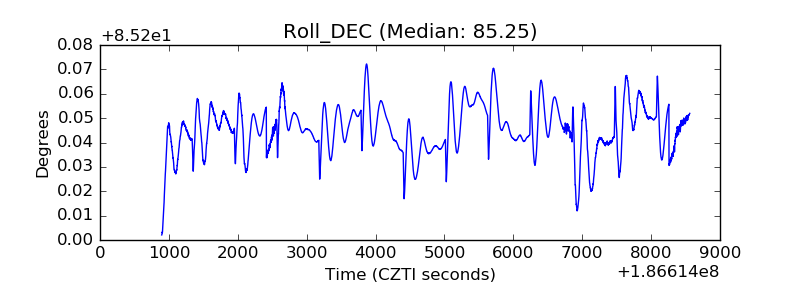 |
| _Roll_RA | 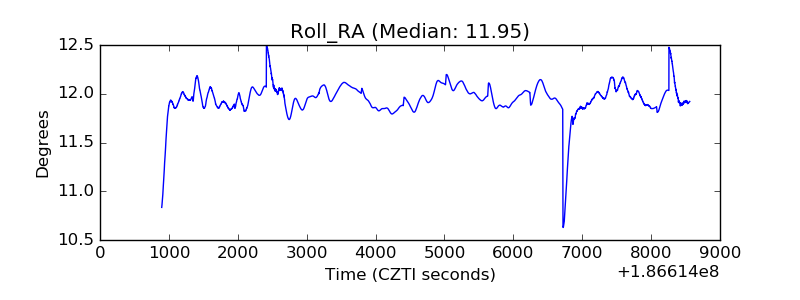 |
| Veto Counter | 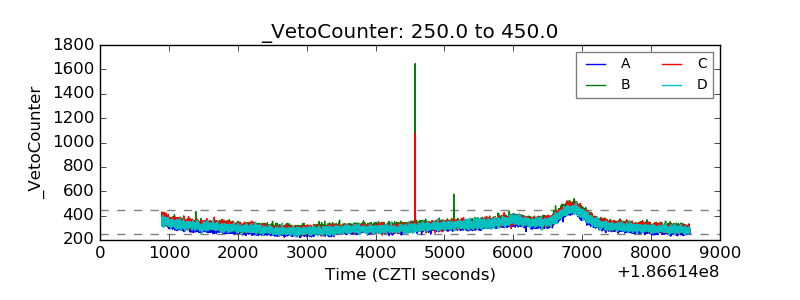 |