| Param | Original file | Final file |
|---|---|---|
| Filename | modeM0/AS1P01_998T01_9000000188_00946cztM0_level2.evt | modeM0/AS1P01_998T01_9000000188_00946cztM0_level2_quad_clean.evt |
| Size (bytes) | 1,441,445,760 | 125,418,240 |
| Size | 1.3 GB | 119.6 MB |
| Events in quadrant A | 10,592,719 | 820,813 |
| Events in quadrant B | 10,868,548 | 815,602 |
| Events in quadrant C | 11,227,218 | 802,364 |
| Events in quadrant D | 10,418,299 | 783,021 |
| Mode M0 | |||
|---|---|---|---|
| Quadrant | BADHDUFLAG | Total packets | Discarded packets |
| A | 0 | 37376 | 0 |
| B | 0 | 38137 | 0 |
| C | 0 | 39188 | 0 |
| D | 0 | 36848 | 0 |
| Mode M9 | |||
|---|---|---|---|
| Quadrant | BADHDUFLAG | Total packets | Discarded packets |
| A | 0 | 1 | 0 |
| B | 0 | 1 | 0 |
| C | 0 | 1 | 0 |
| D | 0 | 1 | 0 |
| Mode SS | |||
|---|---|---|---|
| Quadrant | BADHDUFLAG | Total packets | Discarded packets |
| A | 0 | 168 | 0 |
| B | 0 | 168 | 0 |
| C | 0 | 168 | 0 |
| D | 0 | 168 | 0 |
| Quadrant | Total seconds | Saturated seconds | Saturation percentage |
|---|---|---|---|
| A | 8301 | 9 | 0.108421% |
| B | 8301 | 78 | 0.939646% |
| C | 8301 | 22 | 0.265028% |
| D | 8301 | 110 | 1.325142% |
Noise dominated data is calculated using 1-second bins in cleaned event files. If a bin has >2000 counts, and if more than 50% of those come from <1% of pixels, then it is considered to be noise-dominated and hence unusable.
| Quadrant | # 1 sec bins | Bins with >0 counts | Bins with >2000 counts | High rate bins dominated by noise | Noise dominated (total time) | Noise dominated (detector-on time) | Marked lightcurve |
|---|---|---|---|---|---|---|---|
| A | 8356 | 8302 | 508 | 508 | 6.08% | 6.12% | 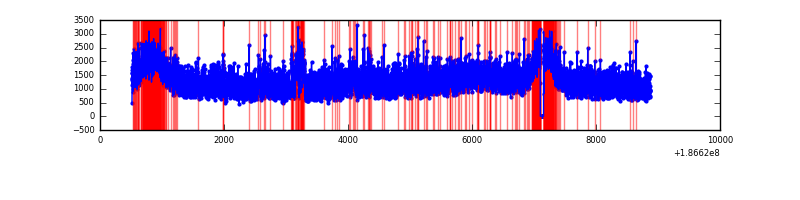 |
| B | 8356 | 8302 | 638 | 638 | 7.64% | 7.68% | 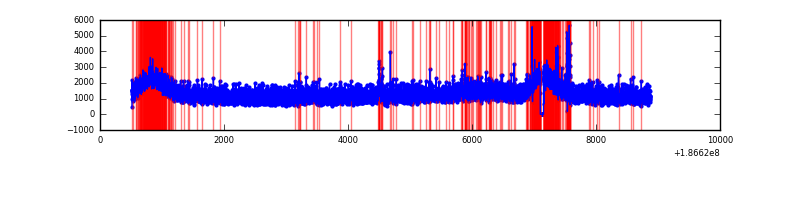 |
| C | 8356 | 8302 | 744 | 744 | 8.90% | 8.96% | 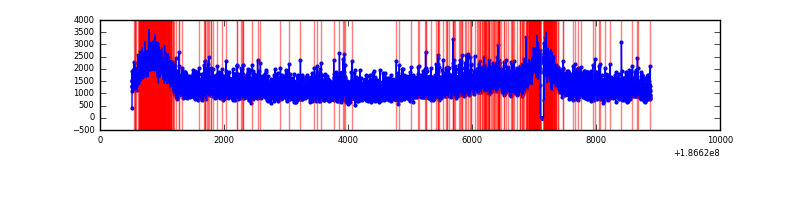 |
| D | 8356 | 8302 | 697 | 697 | 8.34% | 8.40% | 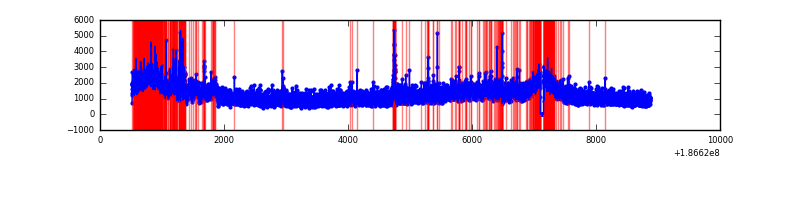 |
Top three noisy pixels from each quadrant. If the there are fewer than three noisy pixels in the level2.evt file, extra rows are filled as -1
| Pixel properties | Quadrant properties | ||||||
|---|---|---|---|---|---|---|---|
| Quadrant | DetID | PixID | Counts | Sigma | Mean | Median | Sigma |
| A | 14 | 170 | 489039 | 764.95 | 2633 | 2658 | 635.8 |
| A | 11 | 79 | 9692 | 11.06 | 2633 | 2658 | 635.8 |
| A | 3 | 111 | 8149 | 8.64 | 2633 | 2658 | 635.8 |
| B | 5 | 191 | 155864 | 235.66 | 2764 | 2776 | 649.6 |
| B | 8 | 234 | 110757 | 166.23 | 2764 | 2776 | 649.6 |
| B | 5 | 249 | 42283 | 60.82 | 2764 | 2776 | 649.6 |
| C | 10 | 34 | 758366 | 1065.52 | 2546 | 2632 | 709.3 |
| C | 15 | 241 | 432917 | 606.66 | 2546 | 2632 | 709.3 |
| C | 3 | 111 | 38539 | 50.63 | 2546 | 2632 | 709.3 |
| D | 12 | 188 | 635325 | 842.29 | 2423 | 2503 | 751.3 |
| D | 1 | 4 | 507850 | 672.62 | 2423 | 2503 | 751.3 |
| D | 12 | 22 | 115656 | 150.61 | 2423 | 2503 | 751.3 |
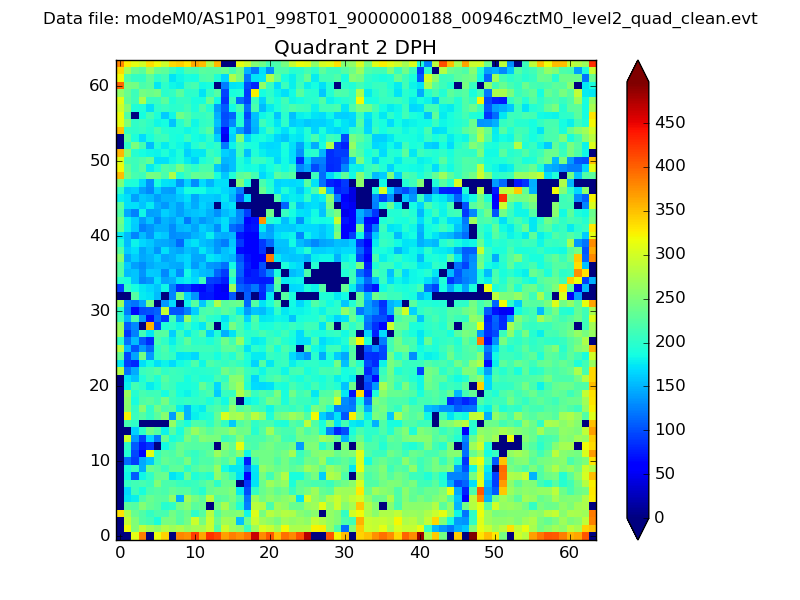
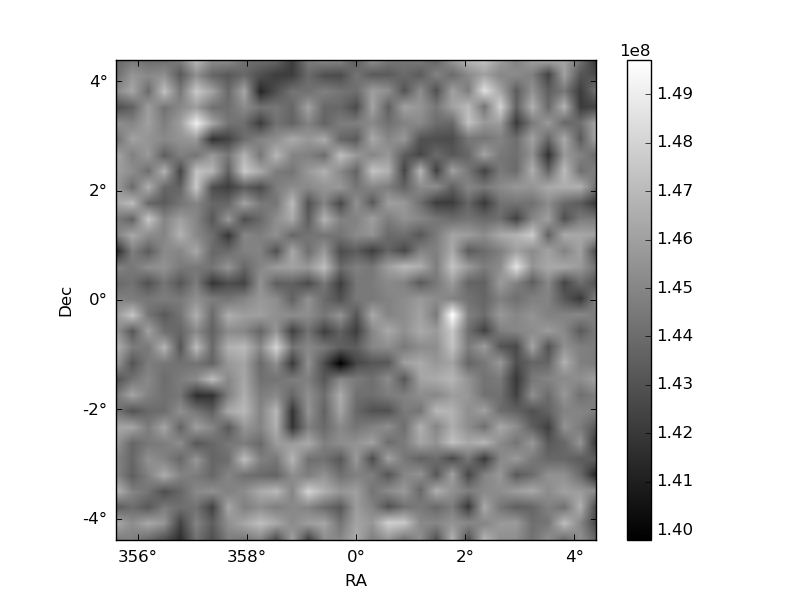
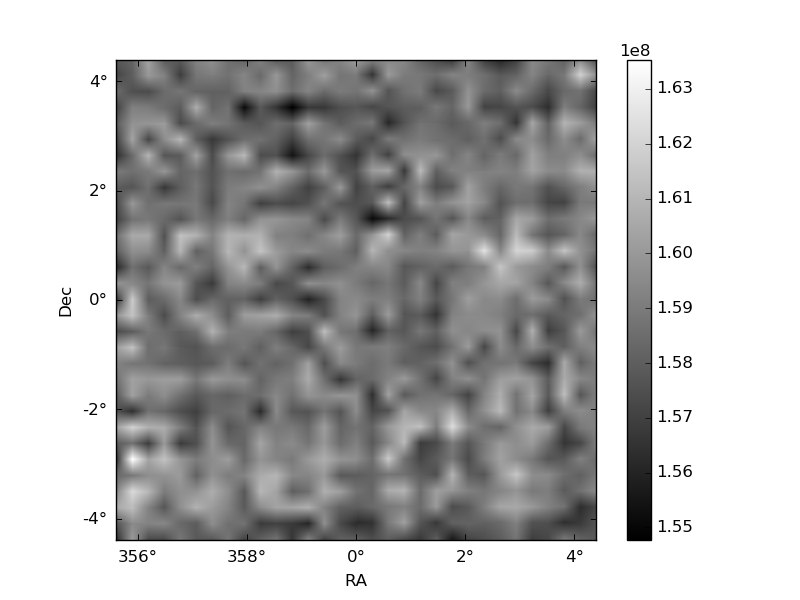
Histogram calculated using DETX and DETY for each event in the final _common_clean file
| Quadrant A | 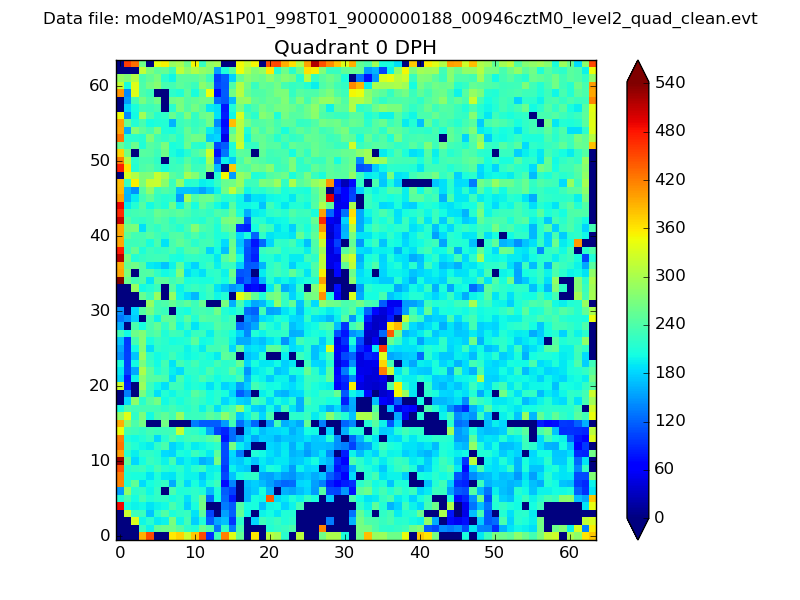 |
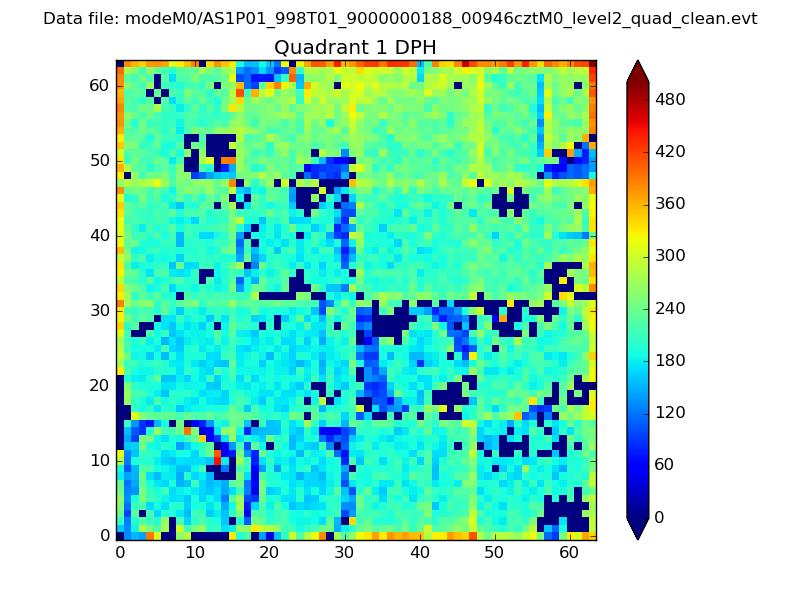 |
Quadrant B |
|---|---|---|---|
| Quadrant D | 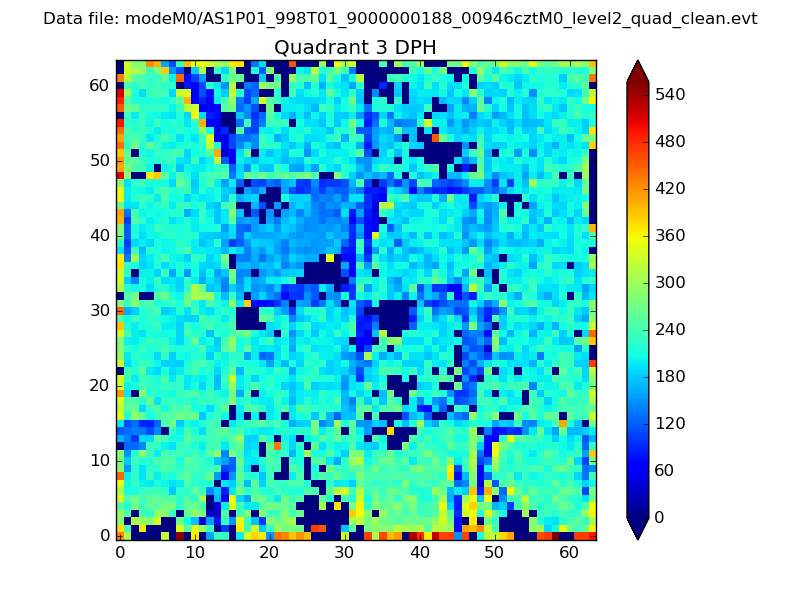 |
 |
Quadrant C |
| Plot type | Count rate plots | Images |
|---|---|---|
| Comparison with Poisson distribution Blue bars denote a histogram of data divided into 1 sec bins. Red curve is a Poisson curve with rate = median count rate of data. |
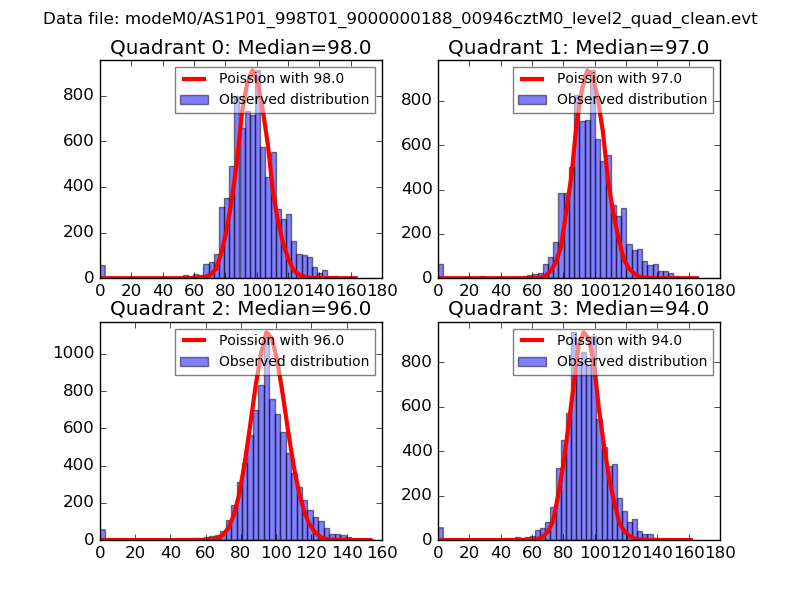 |
 |
| Quadrant-wise count rates Data is divided into 100 sec bins |
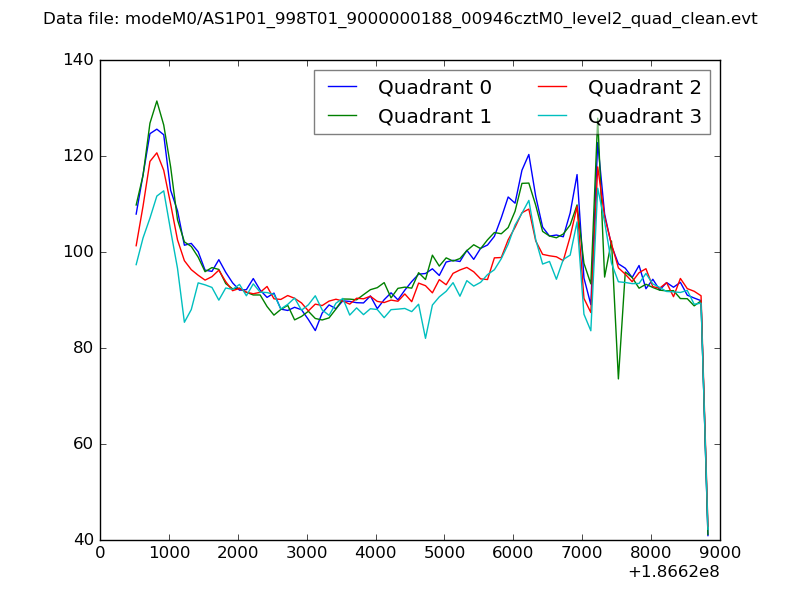 |
|
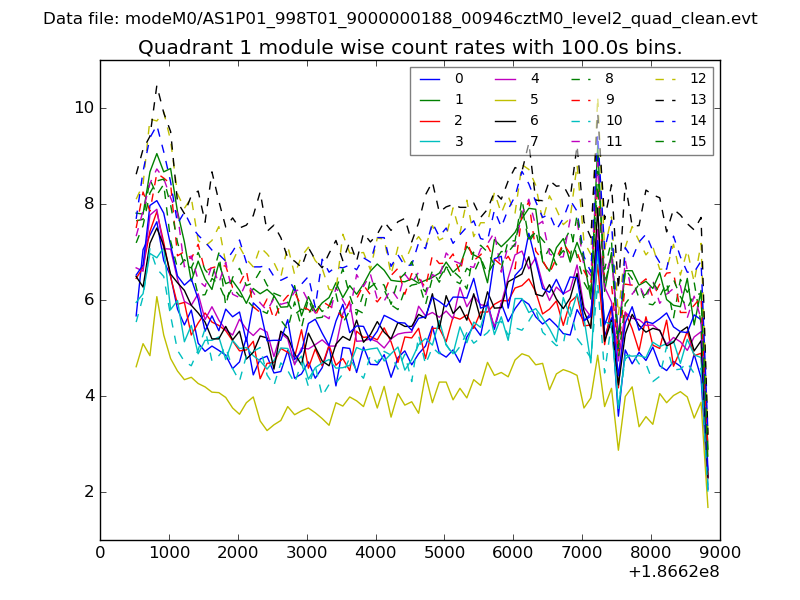
| Module-wise count rates for Quadrant A Data is divided into 100 sec bins |
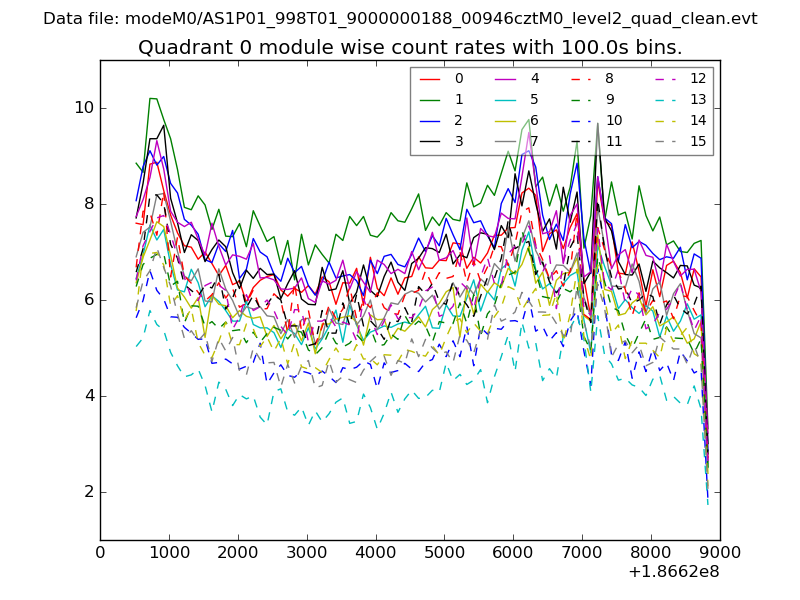 |
 |
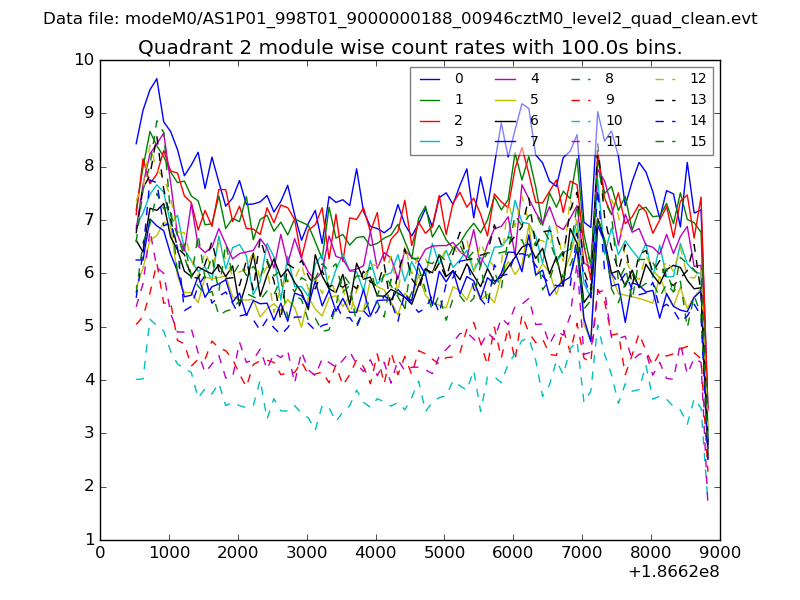
| Module-wise count rates for Quadrant B Data is divided into 100 sec bins |
 |
 |
| Module-wise count rates for Quadrant C Data is divided into 100 sec bins |
 |
 |
| Module-wise count rates for Quadrant D Data is divided into 100 sec bins |
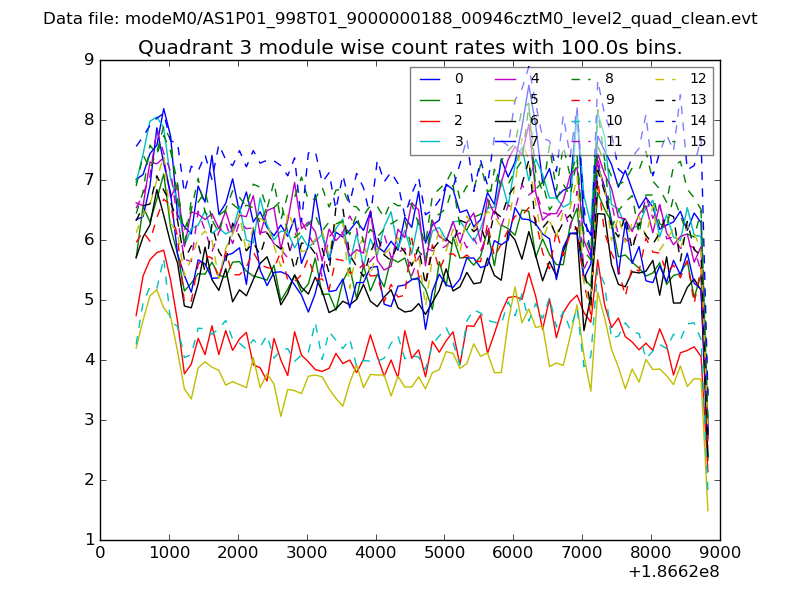 |
 |
| Parameter | Plot |
|---|---|
| CZT HV Monitor | 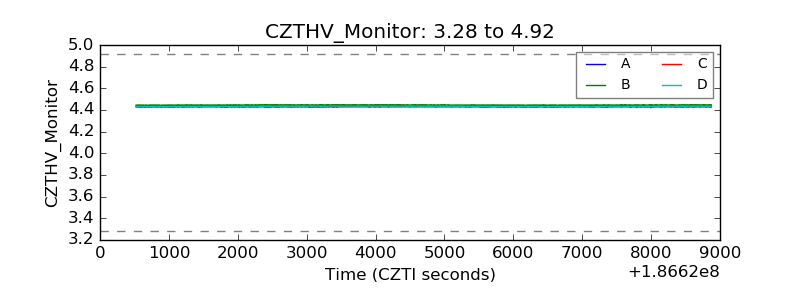 |
| D_VDD |  |
| Temperature 1 | 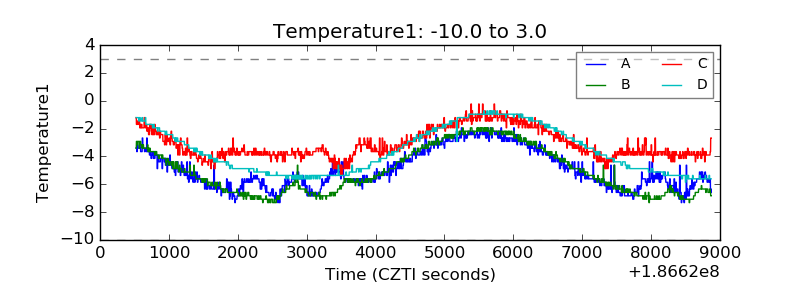 |
| Veto HV Monitor | 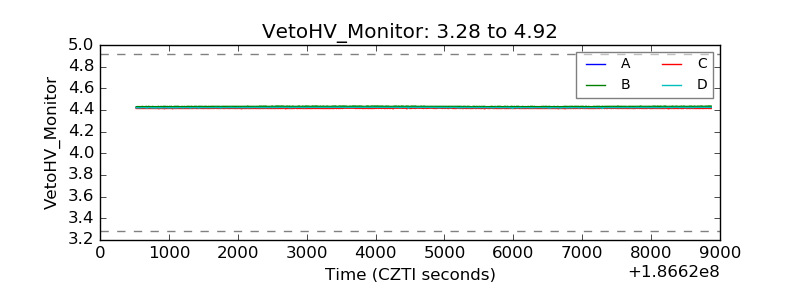 |
| Veto LLD | 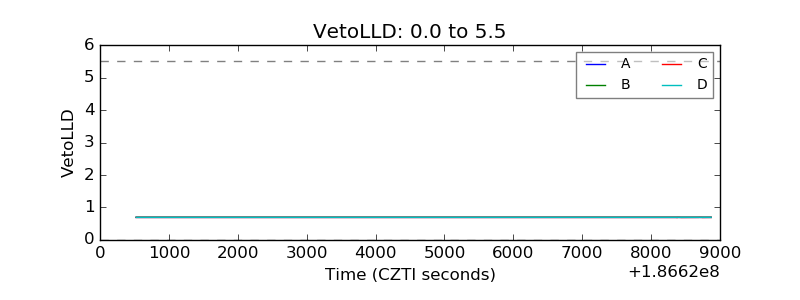 |
| Alpha Counter | 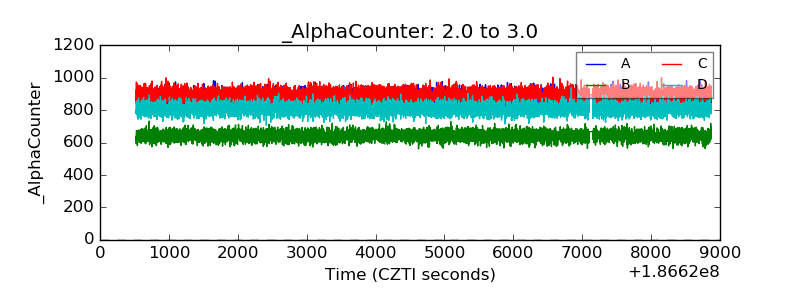 |
| _CPM_Rate | 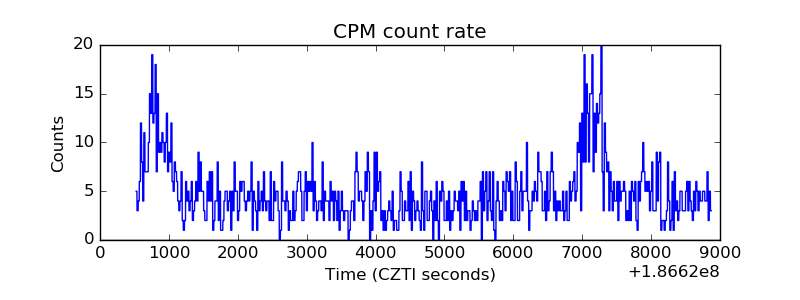 |
| CZT Counter | 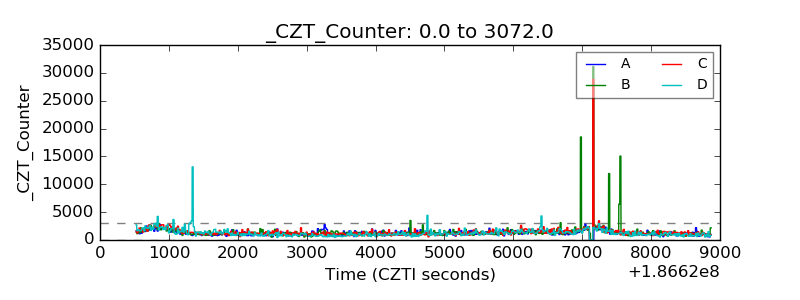 |
| +2.5 Volts monitor |  |
| +5 Volts monitor |  |
| _ROLL_ROT | 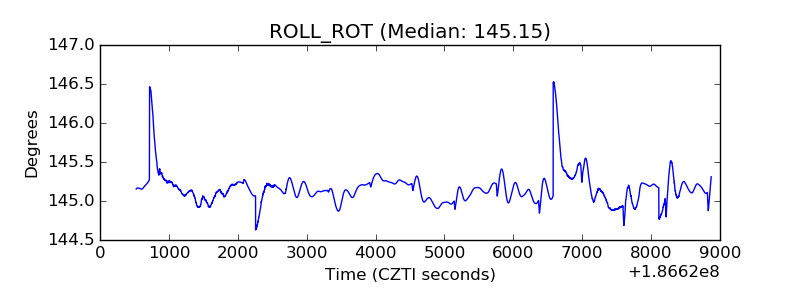 |
| _Roll_DEC | 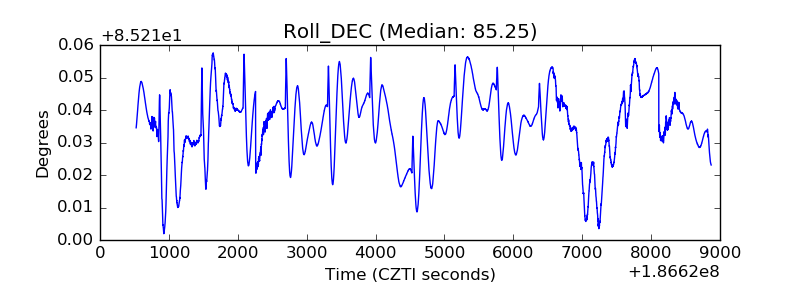 |
| _Roll_RA |  |
| Veto Counter | 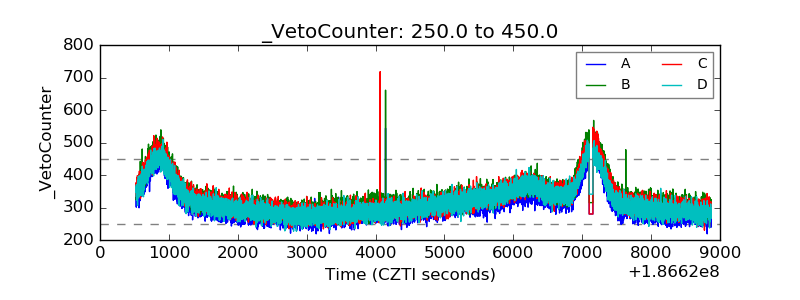 |