| Param | Original file | Final file |
|---|---|---|
| Filename | modeM0/AS1P01_998T01_9000000188_00947cztM0_level2.evt | modeM0/AS1P01_998T01_9000000188_00947cztM0_level2_quad_clean.evt |
| Size (bytes) | 1,272,346,560 | 116,406,720 |
| Size | 1.2 GB | 111.0 MB |
| Events in quadrant A | 9,395,287 | 755,688 |
| Events in quadrant B | 10,062,990 | 750,670 |
| Events in quadrant C | 10,010,369 | 743,440 |
| Events in quadrant D | 8,548,646 | 733,704 |
| Mode M0 | |||
|---|---|---|---|
| Quadrant | BADHDUFLAG | Total packets | Discarded packets |
| A | 0 | 33455 | 0 |
| B | 0 | 35406 | 0 |
| C | 0 | 35282 | 0 |
| D | 0 | 30971 | 0 |
| Mode M9 | |||
|---|---|---|---|
| Quadrant | BADHDUFLAG | Total packets | Discarded packets |
| A | 0 | 5 | 0 |
| B | 0 | 5 | 0 |
| C | 0 | 5 | 0 |
| D | 0 | 5 | 0 |
| Mode SS | |||
|---|---|---|---|
| Quadrant | BADHDUFLAG | Total packets | Discarded packets |
| A | 0 | 158 | 0 |
| B | 0 | 158 | 0 |
| C | 0 | 158 | 0 |
| D | 0 | 158 | 0 |
| Quadrant | Total seconds | Saturated seconds | Saturation percentage |
|---|---|---|---|
| A | 7802 | 9 | 0.115355% |
| B | 7802 | 74 | 0.948475% |
| C | 7802 | 9 | 0.115355% |
| D | 7802 | 10 | 0.128172% |
Noise dominated data is calculated using 1-second bins in cleaned event files. If a bin has >2000 counts, and if more than 50% of those come from <1% of pixels, then it is considered to be noise-dominated and hence unusable.
| Quadrant | # 1 sec bins | Bins with >0 counts | Bins with >2000 counts | High rate bins dominated by noise | Noise dominated (total time) | Noise dominated (detector-on time) | Marked lightcurve |
|---|---|---|---|---|---|---|---|
| A | 8207 | 7804 | 284 | 284 | 3.46% | 3.64% | 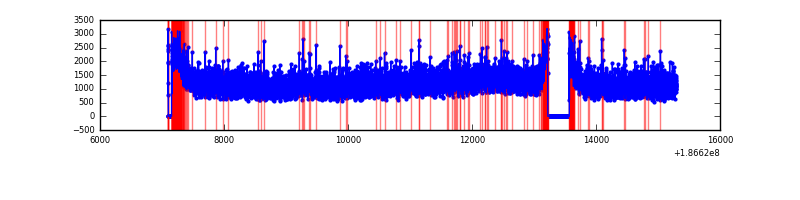 |
| B | 8207 | 7804 | 469 | 469 | 5.71% | 6.01% | 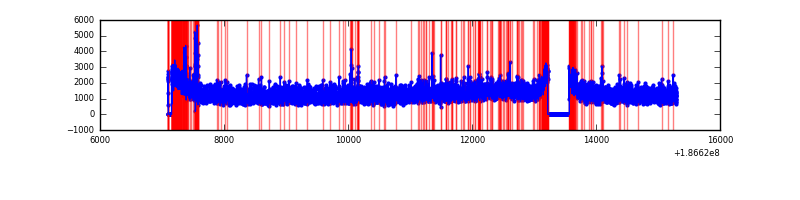 |
| C | 8207 | 7804 | 334 | 334 | 4.07% | 4.28% | 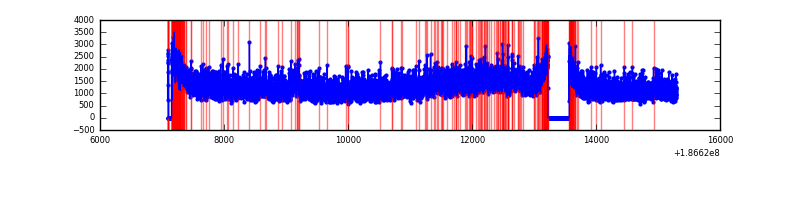 |
| D | 8207 | 7804 | 217 | 217 | 2.64% | 2.78% | 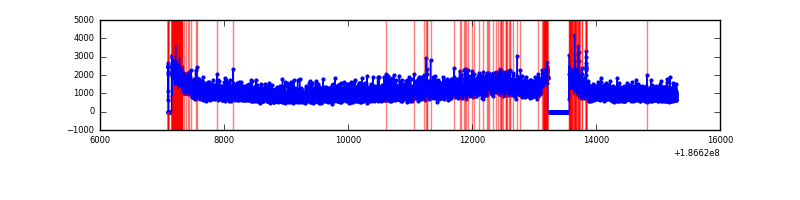 |
Top three noisy pixels from each quadrant. If the there are fewer than three noisy pixels in the level2.evt file, extra rows are filled as -1
| Pixel properties | Quadrant properties | ||||||
|---|---|---|---|---|---|---|---|
| Quadrant | DetID | PixID | Counts | Sigma | Mean | Median | Sigma |
| A | 14 | 170 | 138210 | 234.94 | 2403 | 2425 | 578.0 |
| A | 12 | 243 | 36258 | 58.54 | 2403 | 2425 | 578.0 |
| A | 11 | 79 | 9047 | 11.46 | 2403 | 2425 | 578.0 |
| B | 5 | 191 | 177404 | 292.56 | 2530 | 2542 | 597.7 |
| B | 8 | 234 | 69296 | 111.69 | 2530 | 2542 | 597.7 |
| B | 12 | 52 | 56498 | 90.27 | 2530 | 2542 | 597.7 |
| C | 10 | 34 | 519960 | 807.45 | 2291 | 2372 | 641.0 |
| C | 15 | 241 | 400541 | 621.16 | 2291 | 2372 | 641.0 |
| C | 9 | 144 | 71326 | 107.57 | 2291 | 2372 | 641.0 |
| D | 1 | 4 | 301261 | 440.06 | 2192 | 2274 | 679.4 |
| D | 2 | 107 | 41648 | 57.95 | 2192 | 2274 | 679.4 |
| D | 13 | 169 | 22930 | 30.4 | 2192 | 2274 | 679.4 |
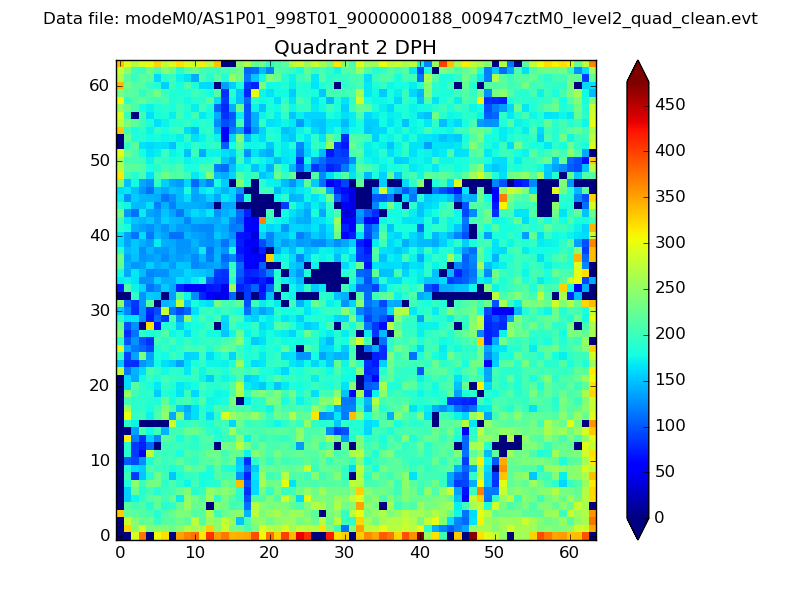
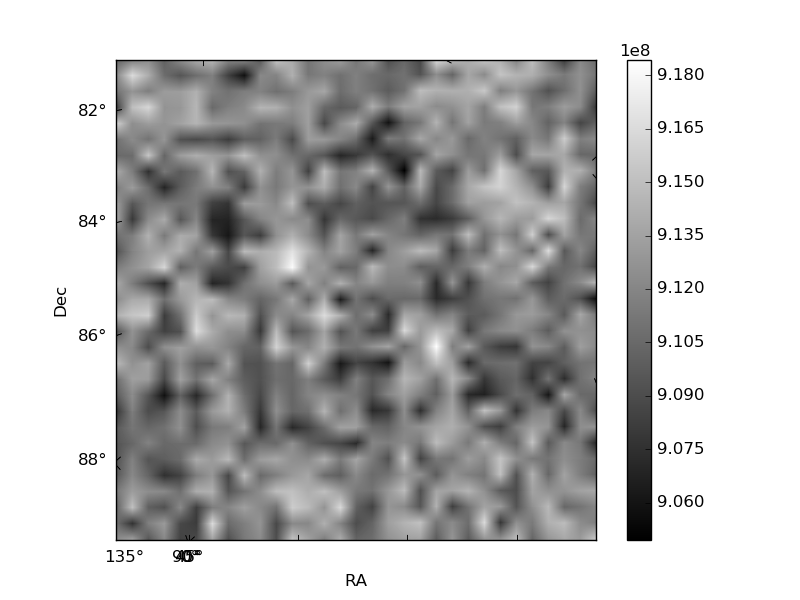
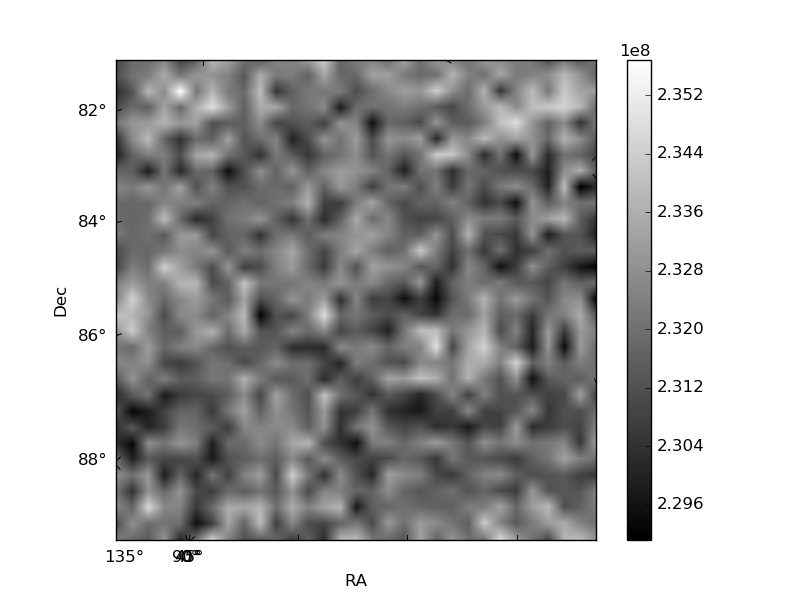
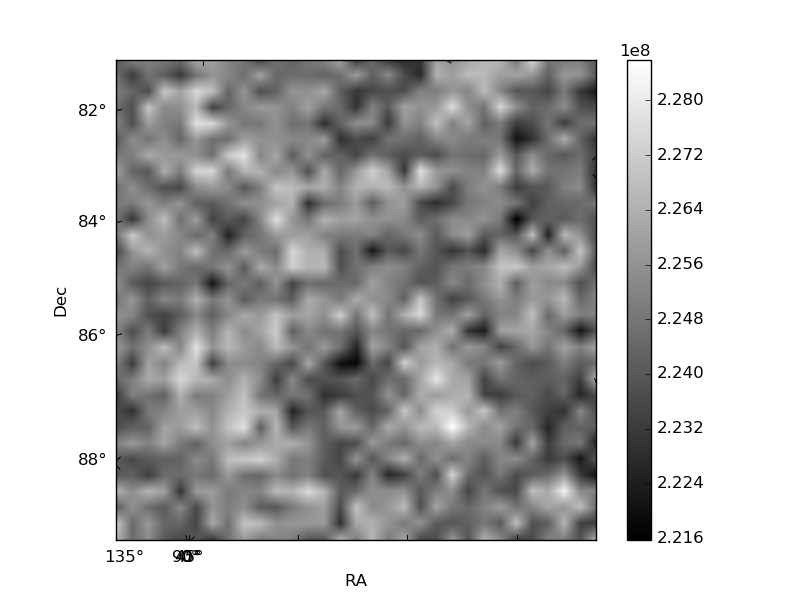
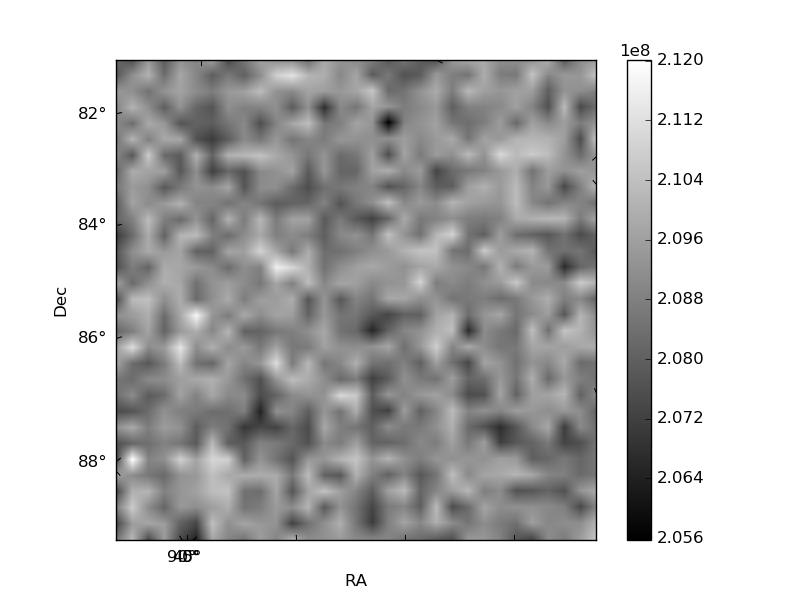
Histogram calculated using DETX and DETY for each event in the final _common_clean file
| Quadrant A | 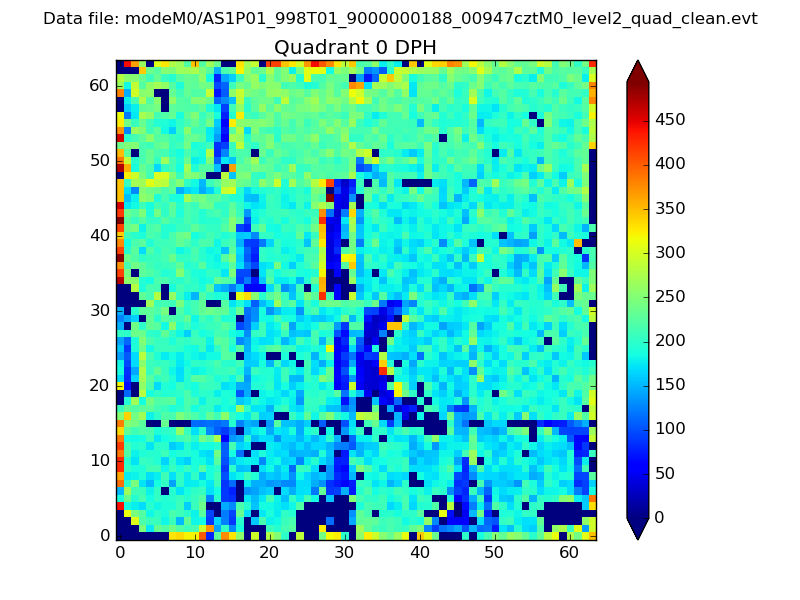 |
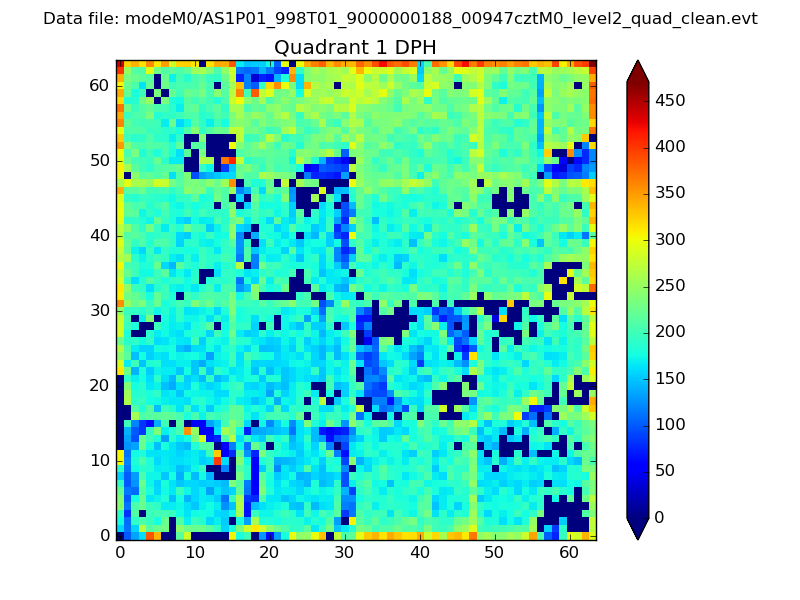 |
Quadrant B |
|---|---|---|---|
| Quadrant D | 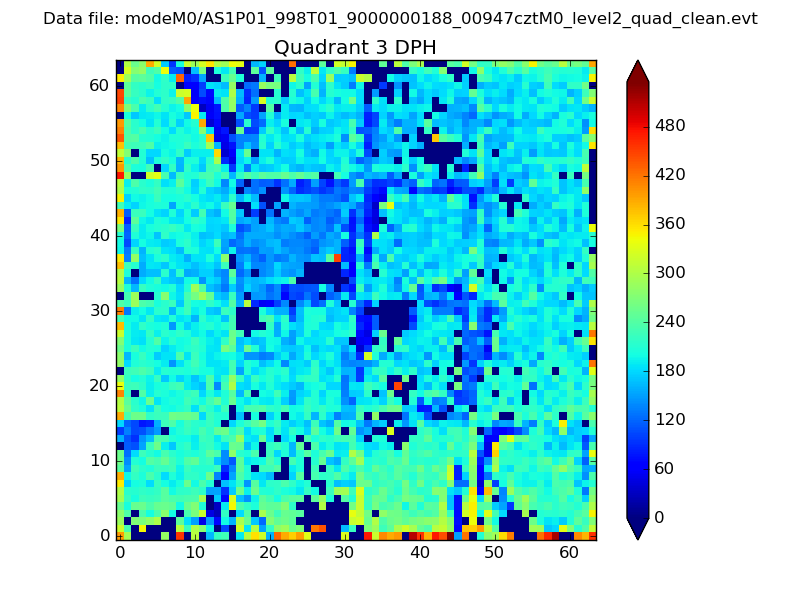 |
 |
Quadrant C |
| Plot type | Count rate plots | Images |
|---|---|---|
| Comparison with Poisson distribution Blue bars denote a histogram of data divided into 1 sec bins. Red curve is a Poisson curve with rate = median count rate of data. |
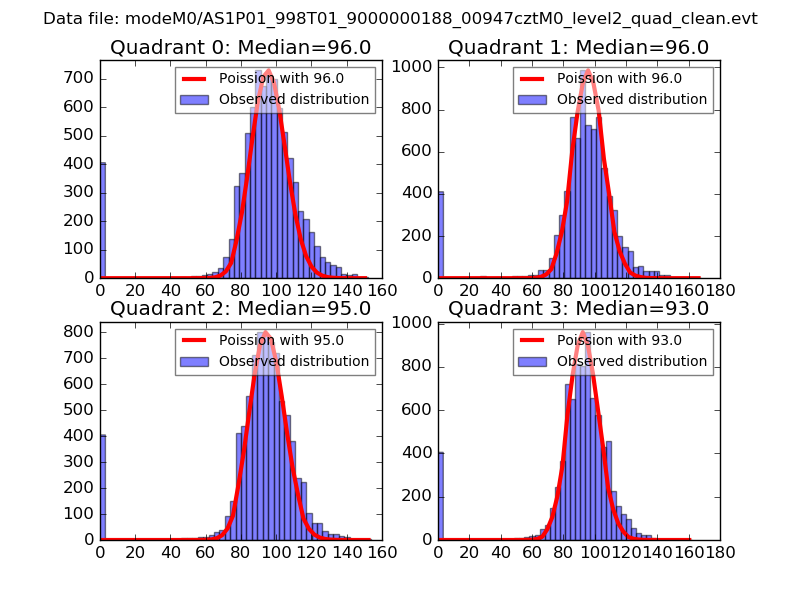 |
 |
| Quadrant-wise count rates Data is divided into 100 sec bins |
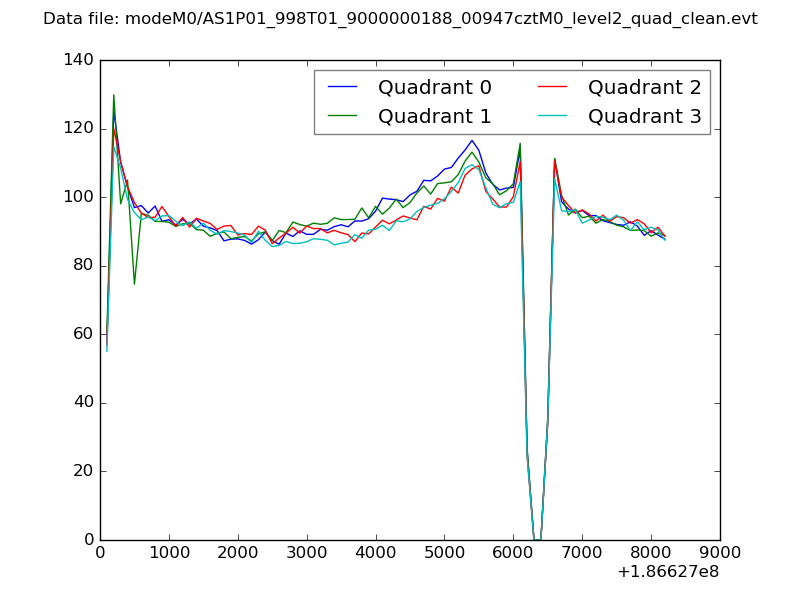 |
|
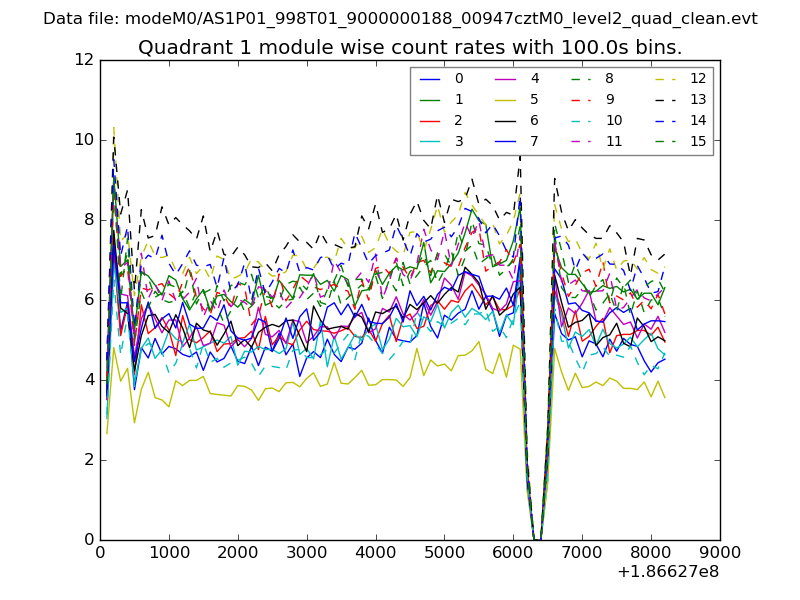
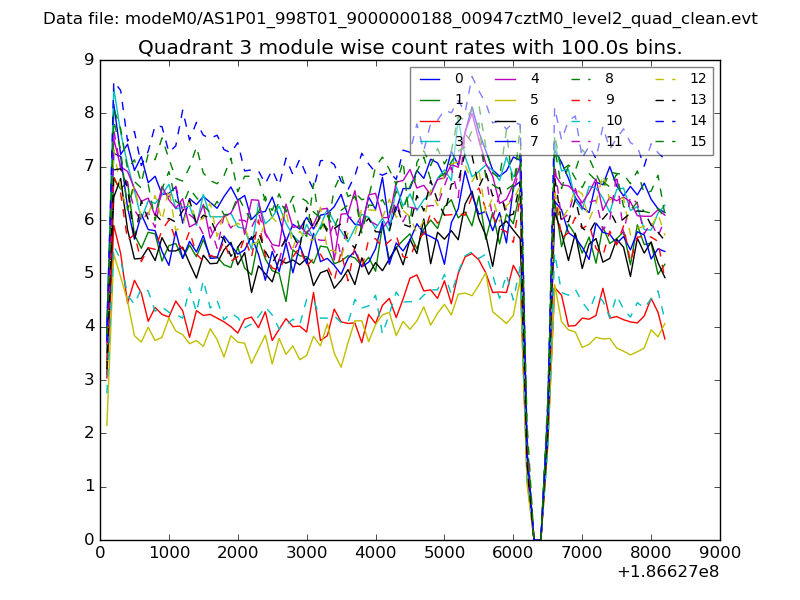
| Module-wise count rates for Quadrant A Data is divided into 100 sec bins |
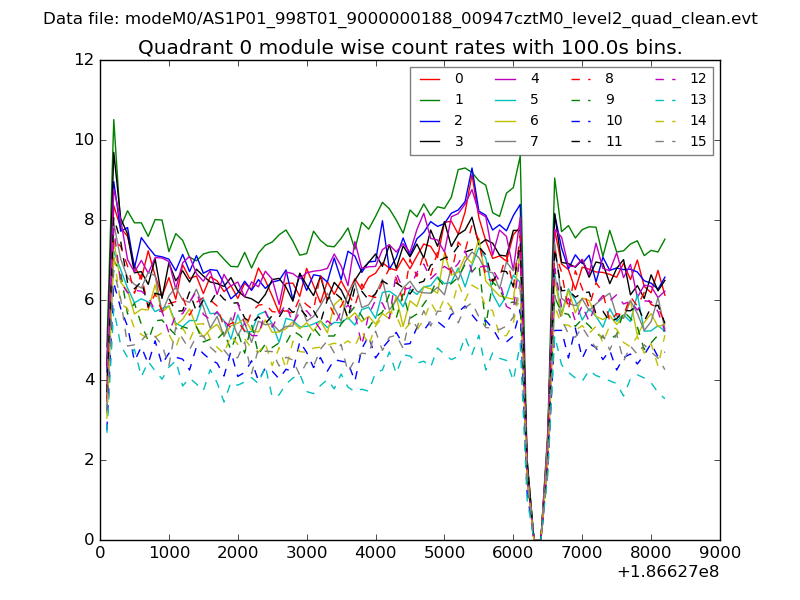 |
 |
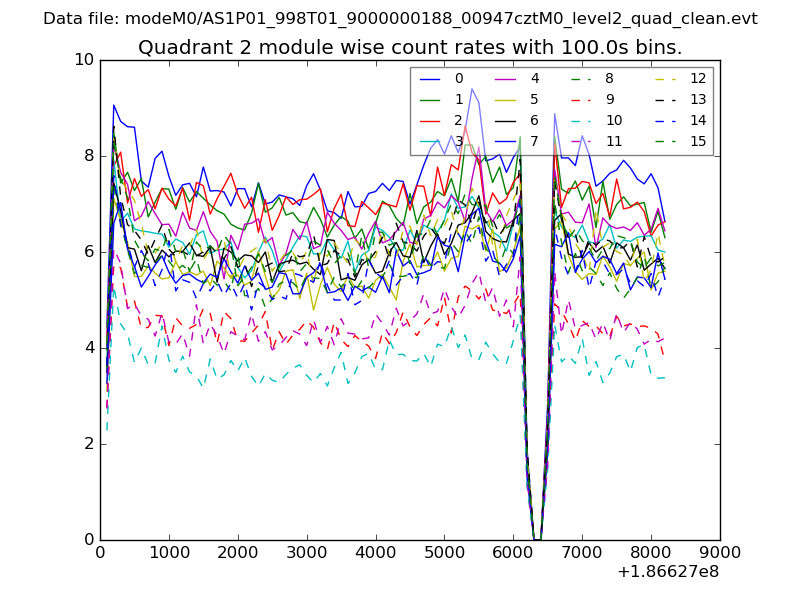
| Module-wise count rates for Quadrant B Data is divided into 100 sec bins |
 |
 |
| Module-wise count rates for Quadrant C Data is divided into 100 sec bins |
 |
 |
| Module-wise count rates for Quadrant D Data is divided into 100 sec bins |
 |
 |
| Parameter | Plot |
|---|---|
| CZT HV Monitor | 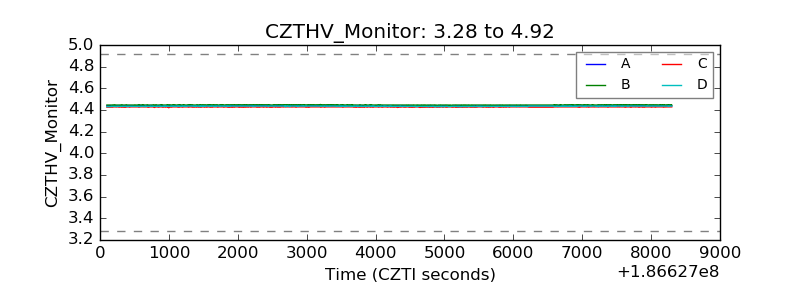 |
| D_VDD | 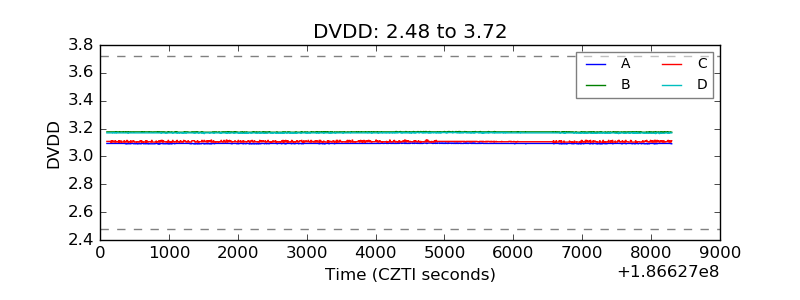 |
| Temperature 1 | 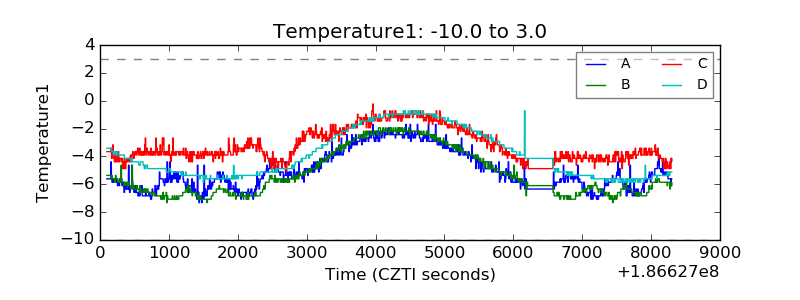 |
| Veto HV Monitor | 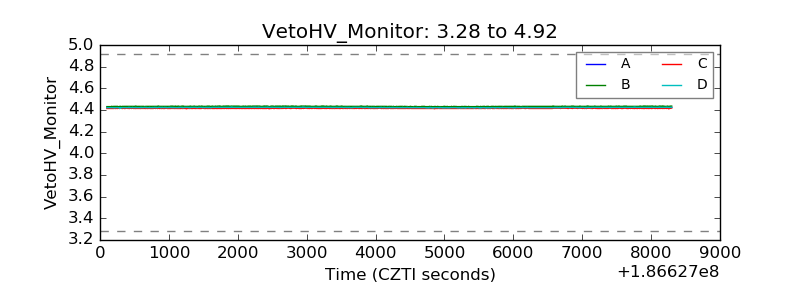 |
| Veto LLD | 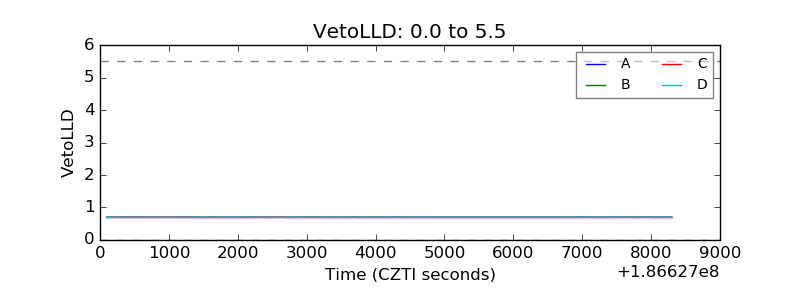 |
| Alpha Counter | 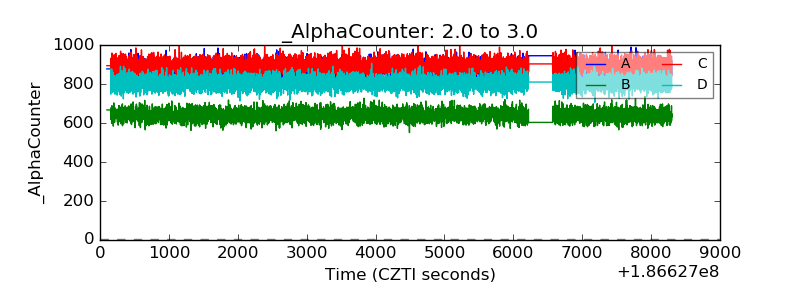 |
| _CPM_Rate | 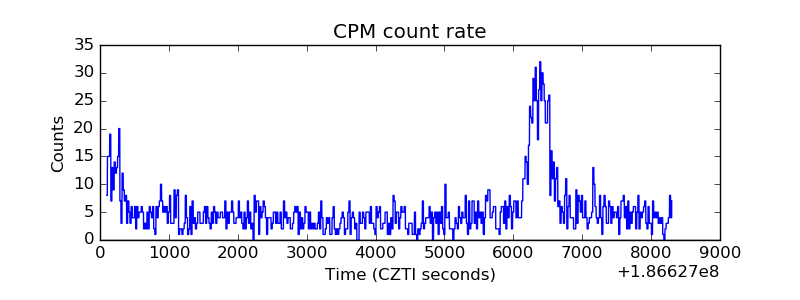 |
| CZT Counter | 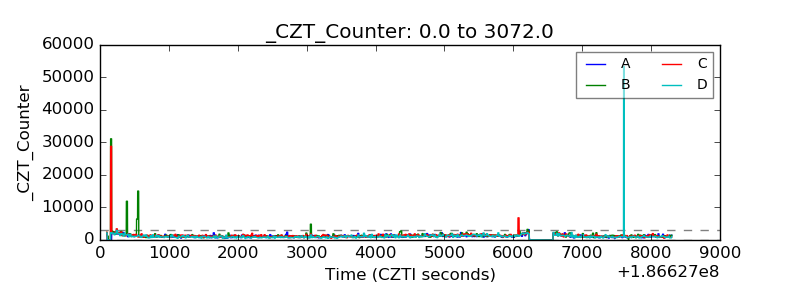 |
| +2.5 Volts monitor | 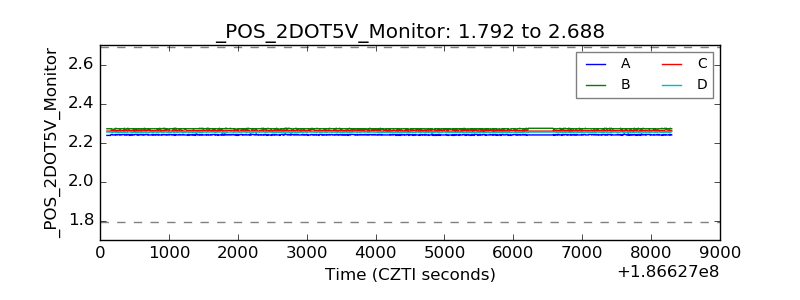 |
| +5 Volts monitor | 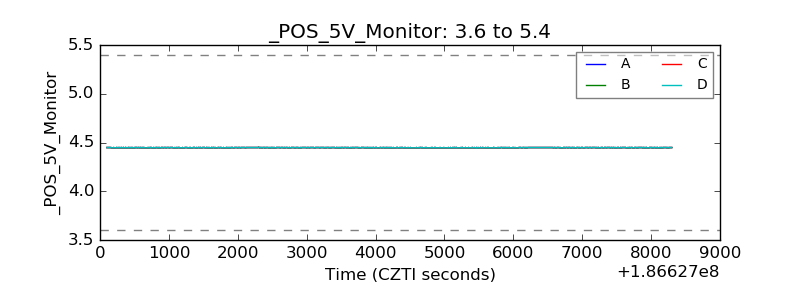 |
| _ROLL_ROT | 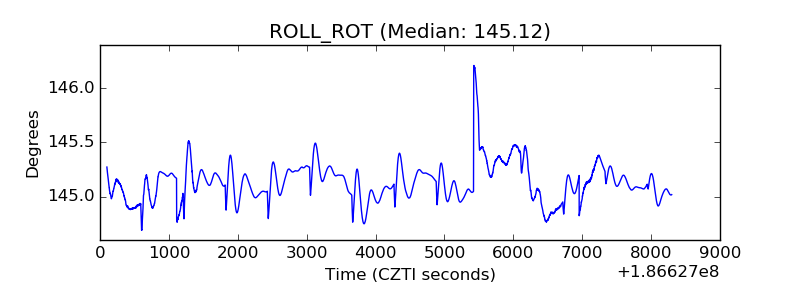 |
| _Roll_DEC | 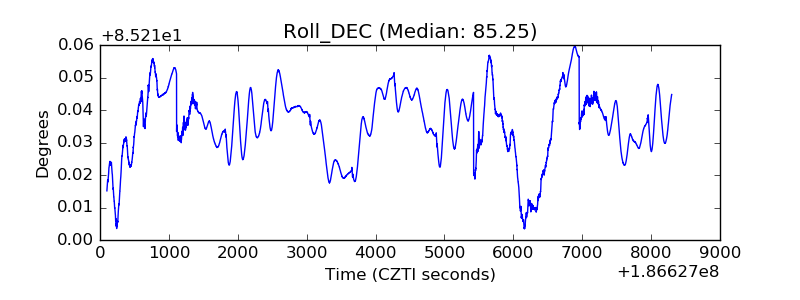 |
| _Roll_RA | 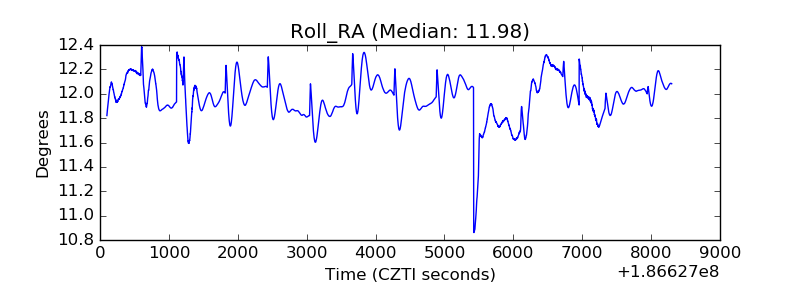 |
| Veto Counter | 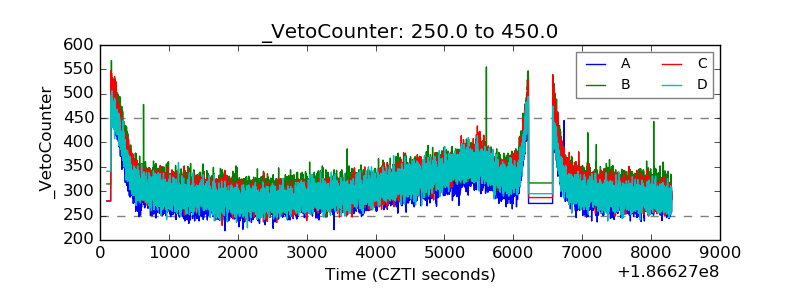 |