| Param | Original file | Final file |
|---|---|---|
| Filename | modeM0/AS1P01_998T01_9000000188_00948cztM0_level2.evt | modeM0/AS1P01_998T01_9000000188_00948cztM0_level2_quad_clean.evt |
| Size (bytes) | 1,073,983,680 | 100,287,360 |
| Size | 1.0 GB | 95.6 MB |
| Events in quadrant A | 7,958,097 | 649,793 |
| Events in quadrant B | 8,537,134 | 649,160 |
| Events in quadrant C | 8,081,660 | 638,464 |
| Events in quadrant D | 7,498,194 | 626,336 |
| Mode M0 | |||
|---|---|---|---|
| Quadrant | BADHDUFLAG | Total packets | Discarded packets |
| A | 0 | 28497 | 0 |
| B | 0 | 30211 | 0 |
| C | 0 | 28831 | 0 |
| D | 0 | 27124 | 0 |
| Mode M9 | |||
|---|---|---|---|
| Quadrant | BADHDUFLAG | Total packets | Discarded packets |
| A | 0 | 6 | 0 |
| B | 0 | 6 | 0 |
| C | 0 | 6 | 0 |
| D | 0 | 6 | 0 |
| Mode SS | |||
|---|---|---|---|
| Quadrant | BADHDUFLAG | Total packets | Discarded packets |
| A | 0 | 138 | 0 |
| B | 0 | 138 | 0 |
| C | 0 | 138 | 0 |
| D | 0 | 138 | 0 |
| Quadrant | Total seconds | Saturated seconds | Saturation percentage |
|---|---|---|---|
| A | 6794 | 7 | 0.103032% |
| B | 6794 | 39 | 0.574036% |
| C | 6794 | 2 | 0.029438% |
| D | 6794 | 28 | 0.412128% |
Noise dominated data is calculated using 1-second bins in cleaned event files. If a bin has >2000 counts, and if more than 50% of those come from <1% of pixels, then it is considered to be noise-dominated and hence unusable.
| Quadrant | # 1 sec bins | Bins with >0 counts | Bins with >2000 counts | High rate bins dominated by noise | Noise dominated (total time) | Noise dominated (detector-on time) | Marked lightcurve |
|---|---|---|---|---|---|---|---|
| A | 7359 | 6795 | 138 | 138 | 1.88% | 2.03% | 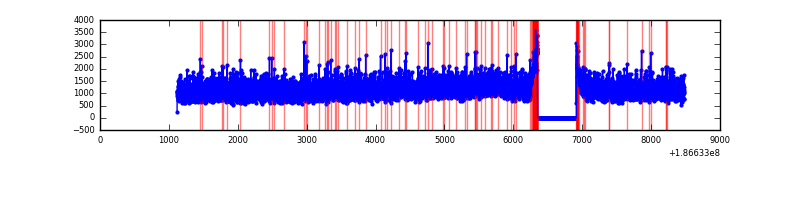 |
| B | 7359 | 6795 | 215 | 215 | 2.92% | 3.16% | 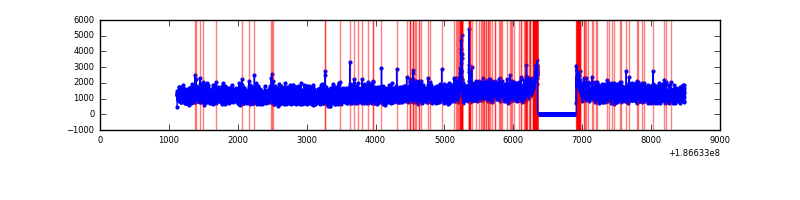 |
| C | 7359 | 6795 | 147 | 147 | 2.00% | 2.16% | 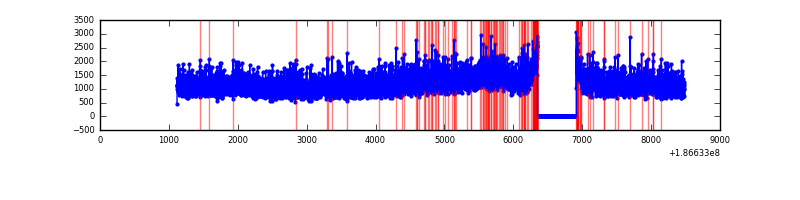 |
| D | 7359 | 6795 | 148 | 148 | 2.01% | 2.18% | 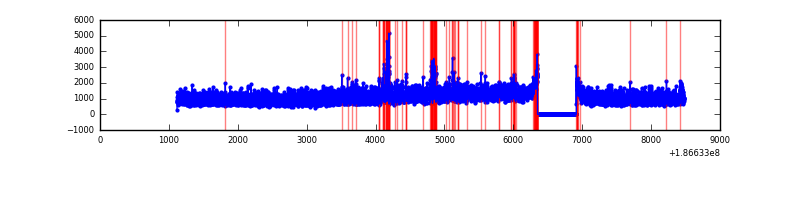 |
Top three noisy pixels from each quadrant. If the there are fewer than three noisy pixels in the level2.evt file, extra rows are filled as -1
| Pixel properties | Quadrant properties | ||||||
|---|---|---|---|---|---|---|---|
| Quadrant | DetID | PixID | Counts | Sigma | Mean | Median | Sigma |
| A | 12 | 243 | 13519 | 23.12 | 2067 | 2079 | 494.7 |
| A | 14 | 170 | 11320 | 18.68 | 2067 | 2079 | 494.7 |
| A | 11 | 79 | 9369 | 14.74 | 2067 | 2079 | 494.7 |
| B | 5 | 249 | 104046 | 198.49 | 2163 | 2177 | 513.2 |
| B | 12 | 52 | 78175 | 148.08 | 2163 | 2177 | 513.2 |
| B | 8 | 234 | 66731 | 125.78 | 2163 | 2177 | 513.2 |
| C | 15 | 241 | 334320 | 617.95 | 1931 | 1995 | 537.8 |
| C | 10 | 34 | 144480 | 264.95 | 1931 | 1995 | 537.8 |
| C | 3 | 111 | 30418 | 52.85 | 1931 | 1995 | 537.8 |
| D | 1 | 4 | 229863 | 392.93 | 1872 | 1939 | 580.1 |
| D | 2 | 107 | 141514 | 240.62 | 1872 | 1939 | 580.1 |
| D | 12 | 22 | 88839 | 149.81 | 1872 | 1939 | 580.1 |
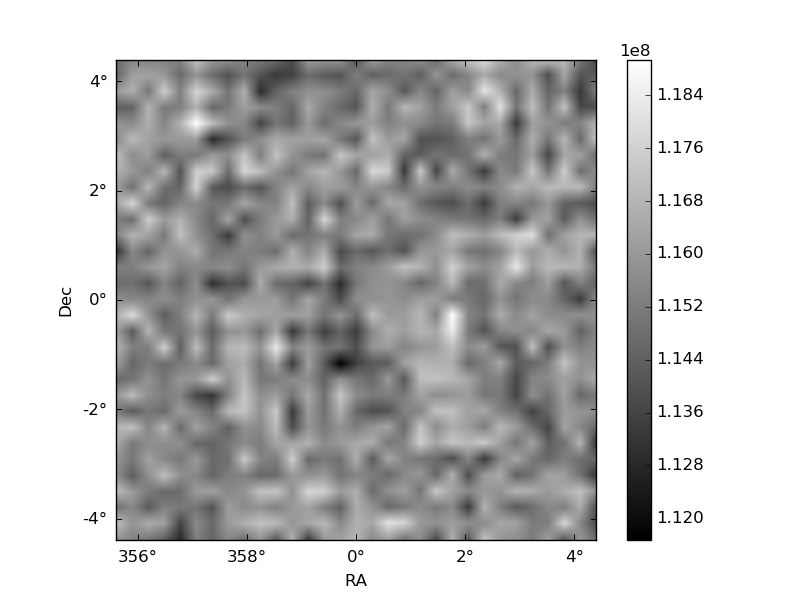
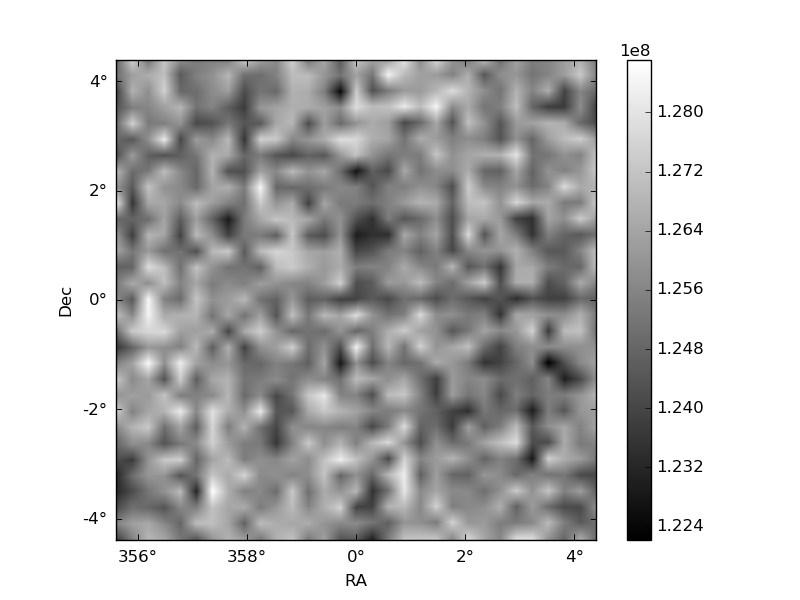
Histogram calculated using DETX and DETY for each event in the final _common_clean file
| Quadrant A | 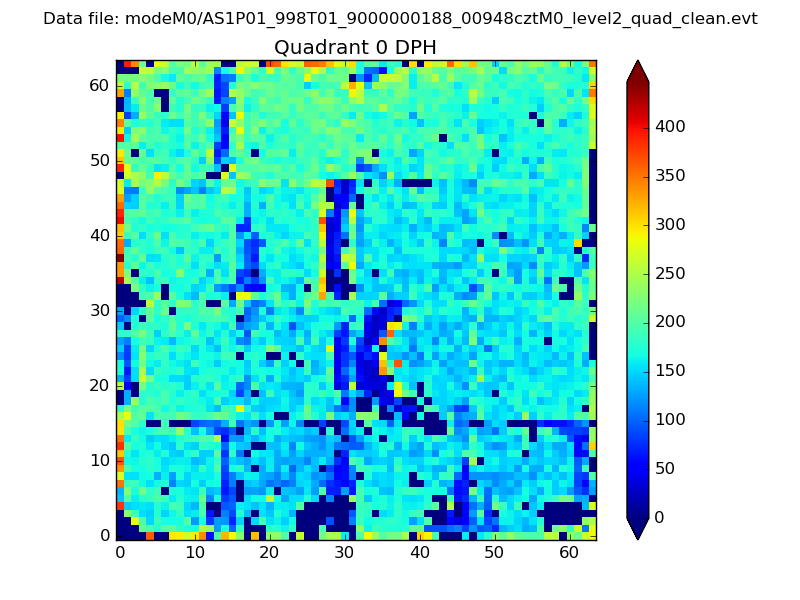 |
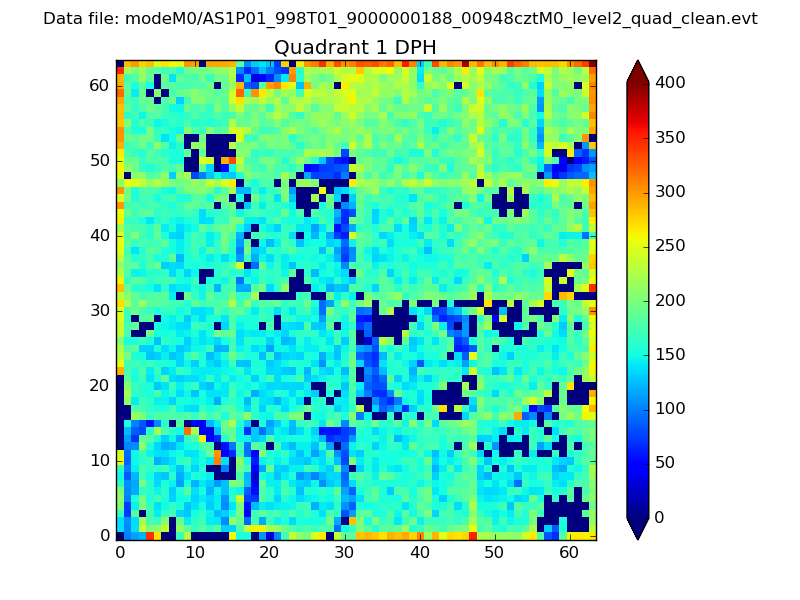 |
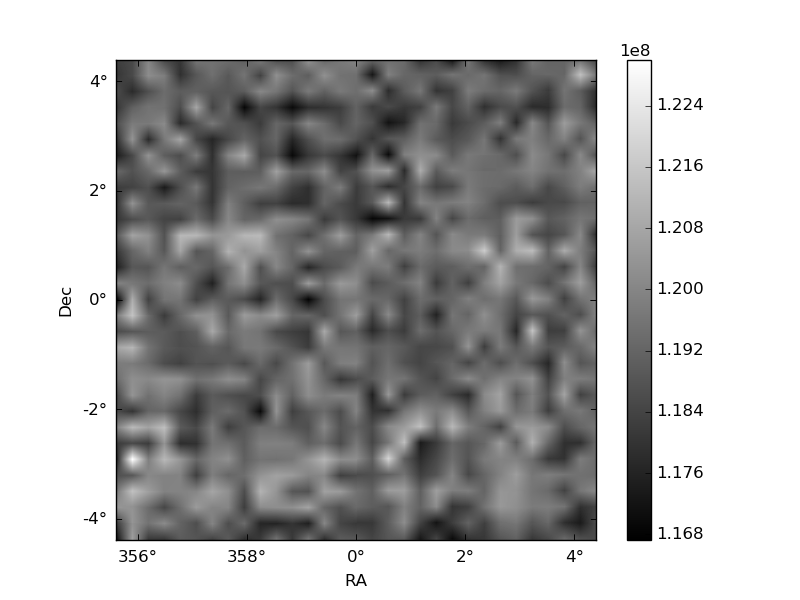
Quadrant B |
|---|---|---|---|
| Quadrant D | 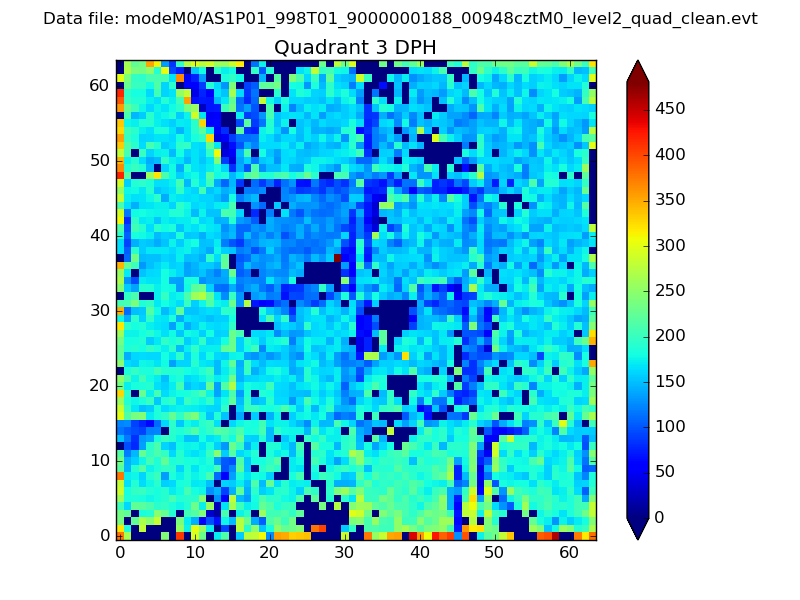 |
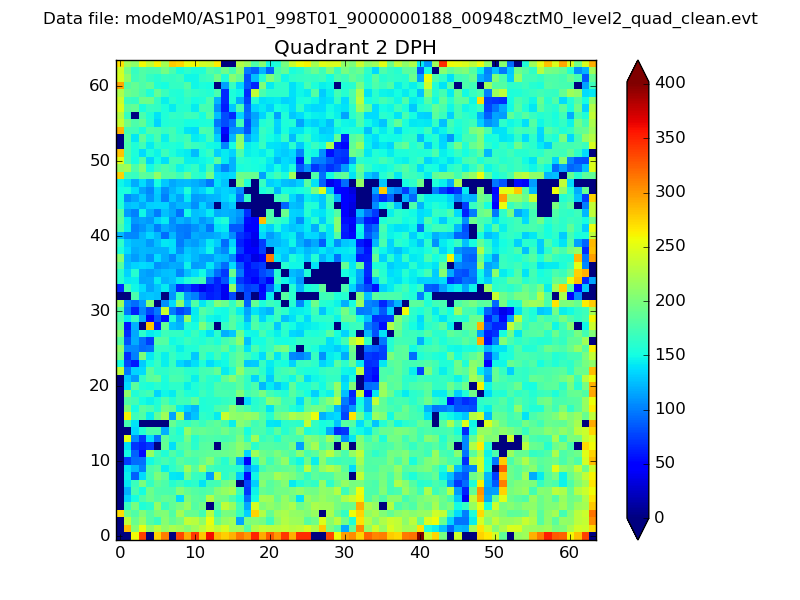 |
Quadrant C |
| Plot type | Count rate plots | Images |
|---|---|---|
| Comparison with Poisson distribution Blue bars denote a histogram of data divided into 1 sec bins. Red curve is a Poisson curve with rate = median count rate of data. |
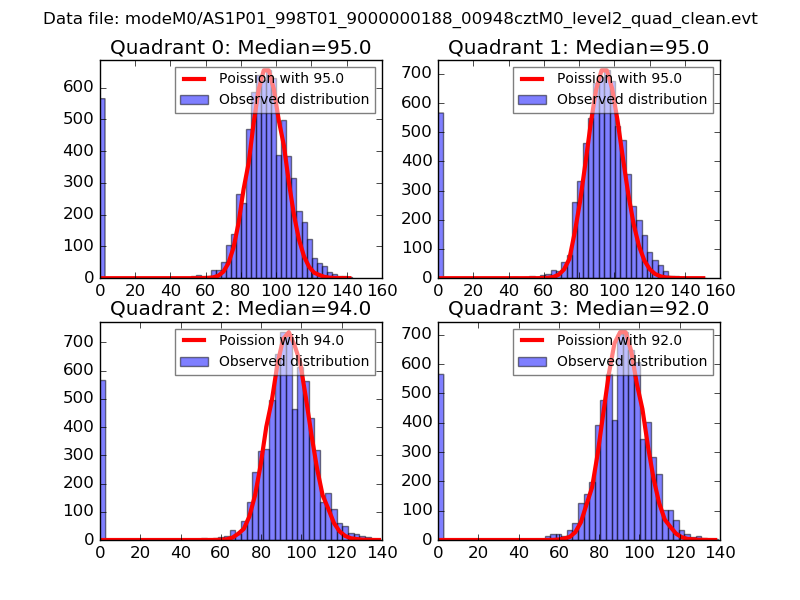 |
 |
| Quadrant-wise count rates Data is divided into 100 sec bins |
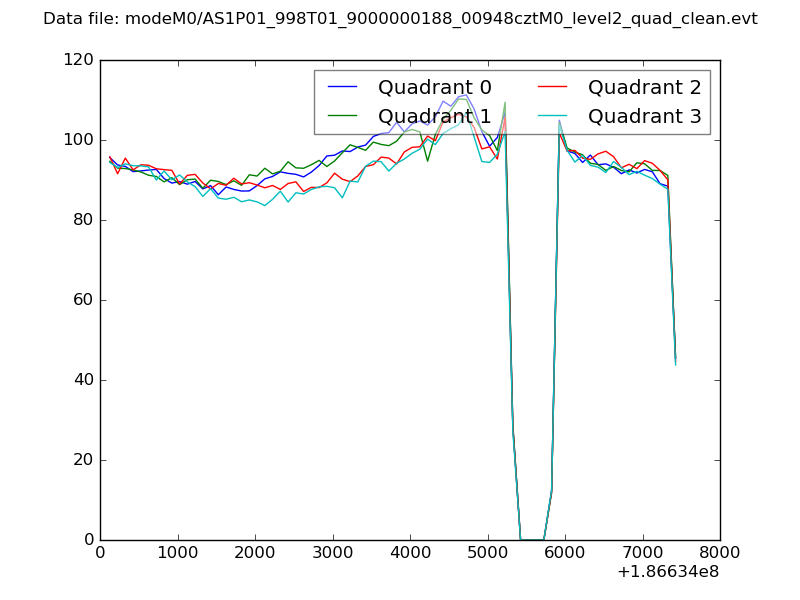 |
|
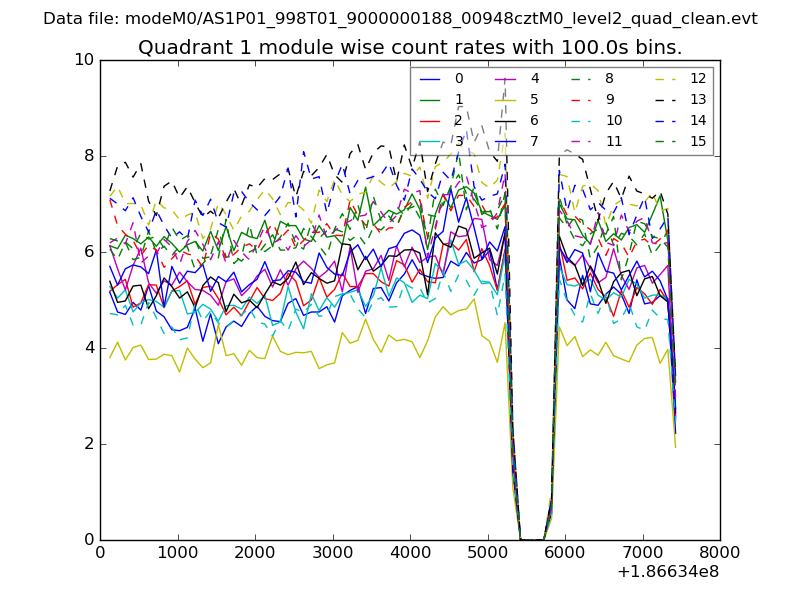
| Module-wise count rates for Quadrant A Data is divided into 100 sec bins |
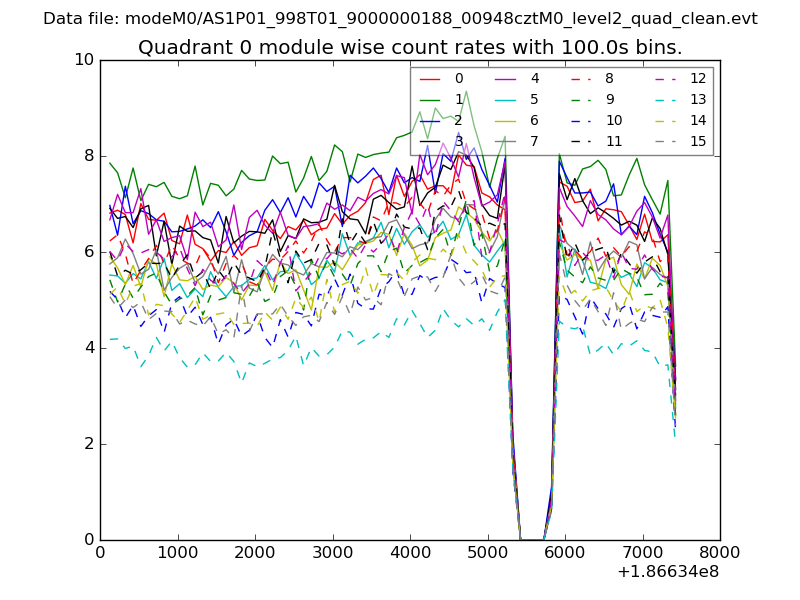 |
 |
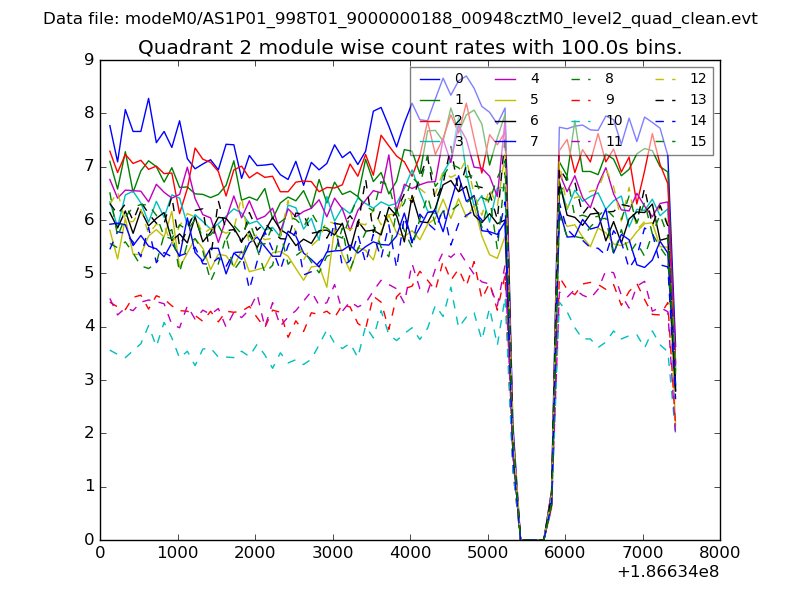
| Module-wise count rates for Quadrant B Data is divided into 100 sec bins |
 |
 |
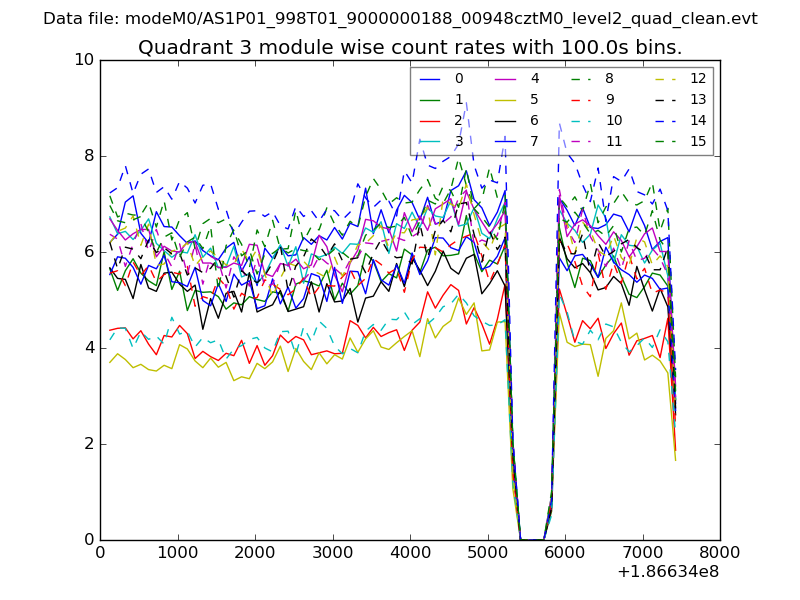
| Module-wise count rates for Quadrant C Data is divided into 100 sec bins |
 |
 |
| Module-wise count rates for Quadrant D Data is divided into 100 sec bins |
 |
 |
| Parameter | Plot |
|---|---|
| CZT HV Monitor | 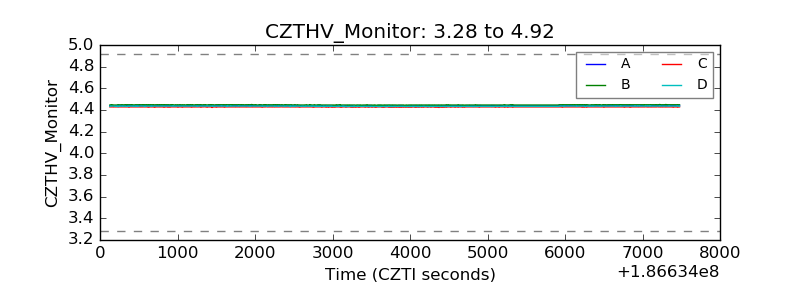 |
| D_VDD |  |
| Temperature 1 | 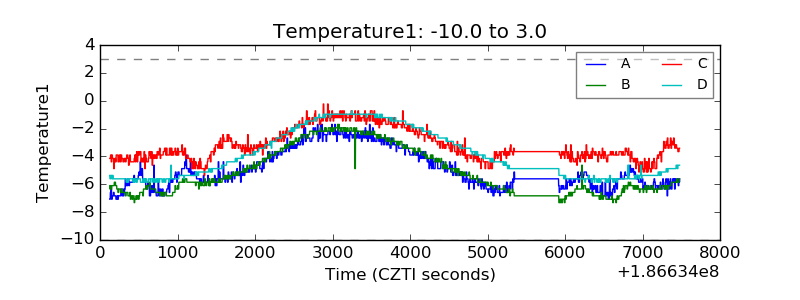 |
| Veto HV Monitor | 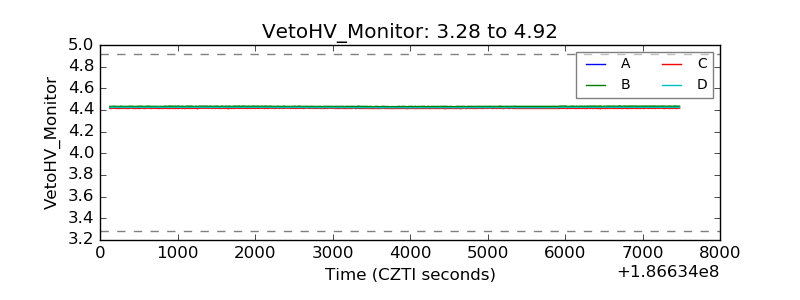 |
| Veto LLD | 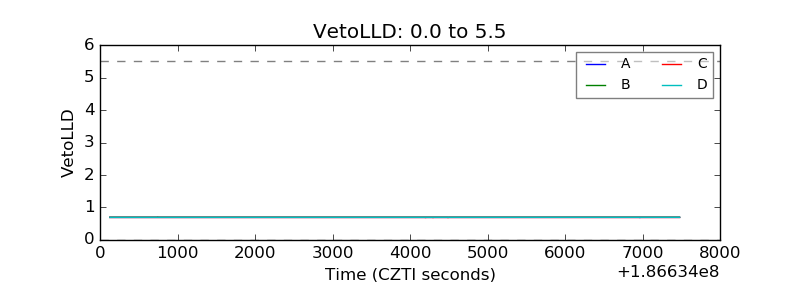 |
| Alpha Counter | 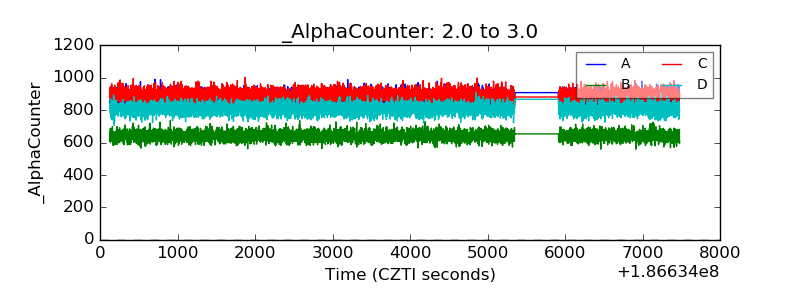 |
| _CPM_Rate | 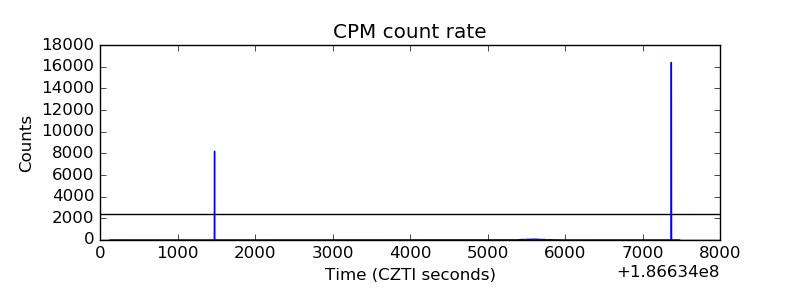 |
| CZT Counter | 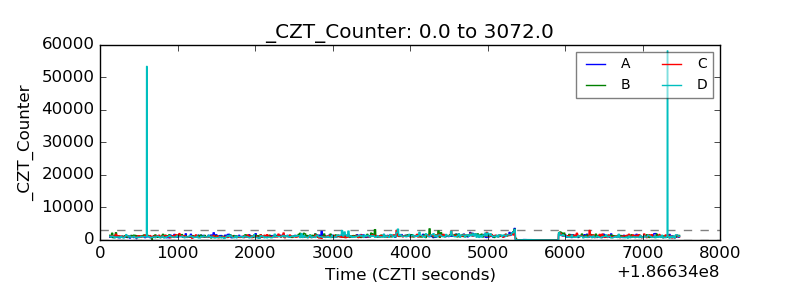 |
| +2.5 Volts monitor |  |
| +5 Volts monitor |  |
| _ROLL_ROT | 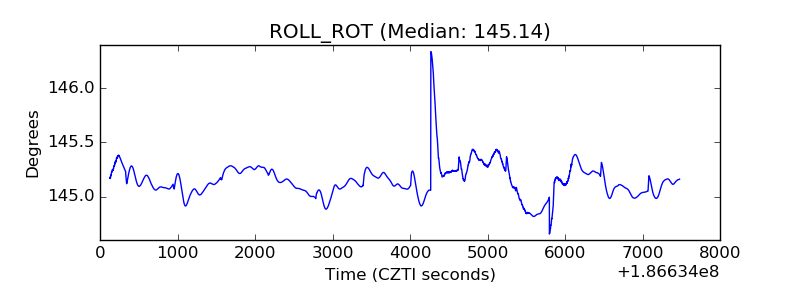 |
| _Roll_DEC | 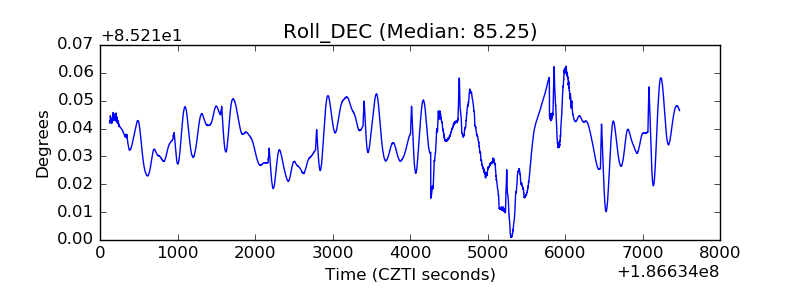 |
| _Roll_RA | 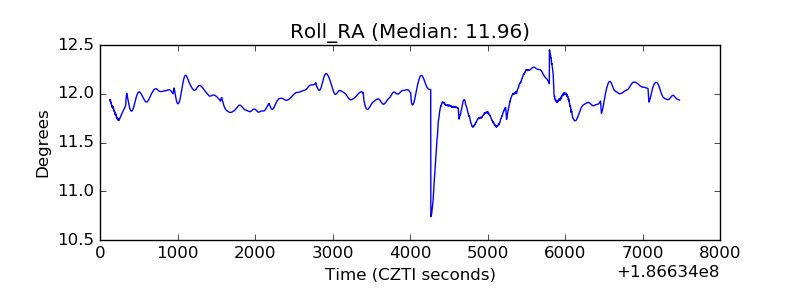 |
| Veto Counter | 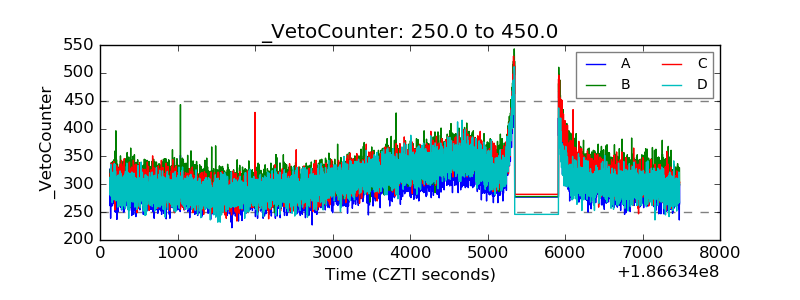 |