| Param | Original file | Final file |
|---|---|---|
| Filename | modeM0/AS1P01_998T01_9000000188_00949cztM0_level2.evt | modeM0/AS1P01_998T01_9000000188_00949cztM0_level2_quad_clean.evt |
| Size (bytes) | 1,096,773,120 | 100,532,160 |
| Size | 1.0 GB | 95.9 MB |
| Events in quadrant A | 7,976,476 | 654,048 |
| Events in quadrant B | 8,689,509 | 653,657 |
| Events in quadrant C | 8,070,162 | 639,911 |
| Events in quadrant D | 8,030,980 | 624,962 |
| Mode M0 | |||
|---|---|---|---|
| Quadrant | BADHDUFLAG | Total packets | Discarded packets |
| A | 0 | 28453 | 0 |
| B | 0 | 30685 | 0 |
| C | 0 | 28814 | 0 |
| D | 0 | 28668 | 0 |
| Mode M9 | |||
|---|---|---|---|
| Quadrant | BADHDUFLAG | Total packets | Discarded packets |
| A | 0 | 7 | 0 |
| B | 0 | 7 | 0 |
| C | 0 | 7 | 0 |
| D | 0 | 7 | 0 |
| Mode SS | |||
|---|---|---|---|
| Quadrant | BADHDUFLAG | Total packets | Discarded packets |
| A | 0 | 138 | 0 |
| B | 0 | 138 | 0 |
| C | 0 | 138 | 0 |
| D | 0 | 138 | 0 |
| Quadrant | Total seconds | Saturated seconds | Saturation percentage |
|---|---|---|---|
| A | 6771 | 9 | 0.132920% |
| B | 6771 | 10 | 0.147689% |
| C | 6771 | 4 | 0.059075% |
| D | 6772 | 59 | 0.871234% |
Noise dominated data is calculated using 1-second bins in cleaned event files. If a bin has >2000 counts, and if more than 50% of those come from <1% of pixels, then it is considered to be noise-dominated and hence unusable.
| Quadrant | # 1 sec bins | Bins with >0 counts | Bins with >2000 counts | High rate bins dominated by noise | Noise dominated (total time) | Noise dominated (detector-on time) | Marked lightcurve |
|---|---|---|---|---|---|---|---|
| A | 7501 | 6772 | 145 | 145 | 1.93% | 2.14% | 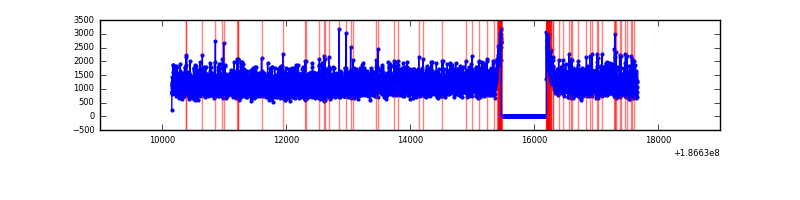 |
| B | 7501 | 6772 | 217 | 217 | 2.89% | 3.20% | 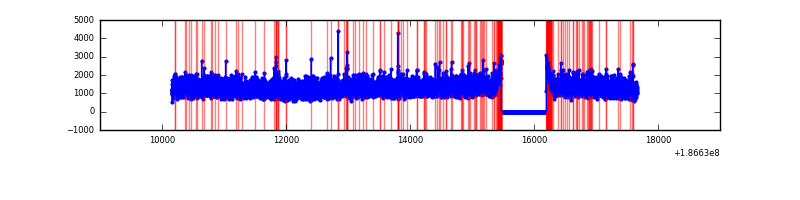 |
| C | 7501 | 6772 | 129 | 129 | 1.72% | 1.90% | 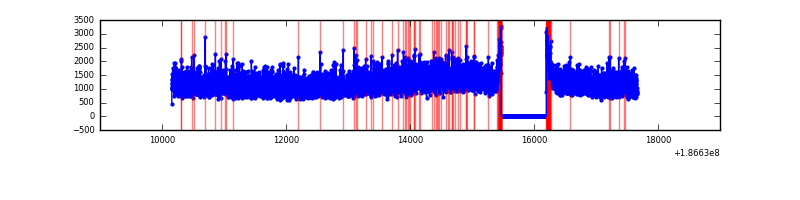 |
| D | 7502 | 6773 | 345 | 345 | 4.60% | 5.09% | 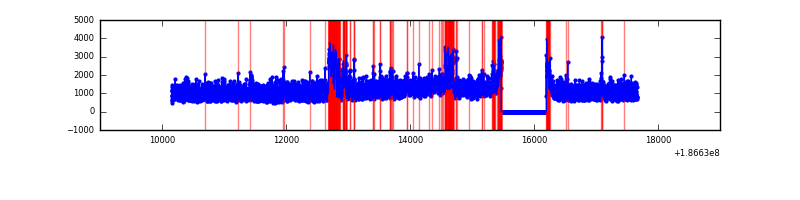 |
Top three noisy pixels from each quadrant. If the there are fewer than three noisy pixels in the level2.evt file, extra rows are filled as -1
| Pixel properties | Quadrant properties | ||||||
|---|---|---|---|---|---|---|---|
| Quadrant | DetID | PixID | Counts | Sigma | Mean | Median | Sigma |
| A | 11 | 79 | 7728 | 11.27 | 2077 | 2092 | 499.9 |
| A | 3 | 111 | 6632 | 9.08 | 2077 | 2092 | 499.9 |
| A | 0 | 253 | 5761 | 7.34 | 2077 | 2092 | 499.9 |
| B | 8 | 234 | 206982 | 397.24 | 2175 | 2184 | 515.6 |
| B | 12 | 52 | 70929 | 133.34 | 2175 | 2184 | 515.6 |
| B | 4 | 232 | 41401 | 76.07 | 2175 | 2184 | 515.6 |
| C | 15 | 241 | 323674 | 597.33 | 1927 | 1989 | 538.5 |
| C | 10 | 34 | 182259 | 334.74 | 1927 | 1989 | 538.5 |
| C | 3 | 111 | 25513 | 43.68 | 1927 | 1989 | 538.5 |
| D | 12 | 22 | 685183 | 1181.67 | 1866 | 1936 | 578.2 |
| D | 1 | 4 | 189744 | 324.81 | 1866 | 1936 | 578.2 |
| D | 11 | 131 | 73612 | 123.96 | 1866 | 1936 | 578.2 |
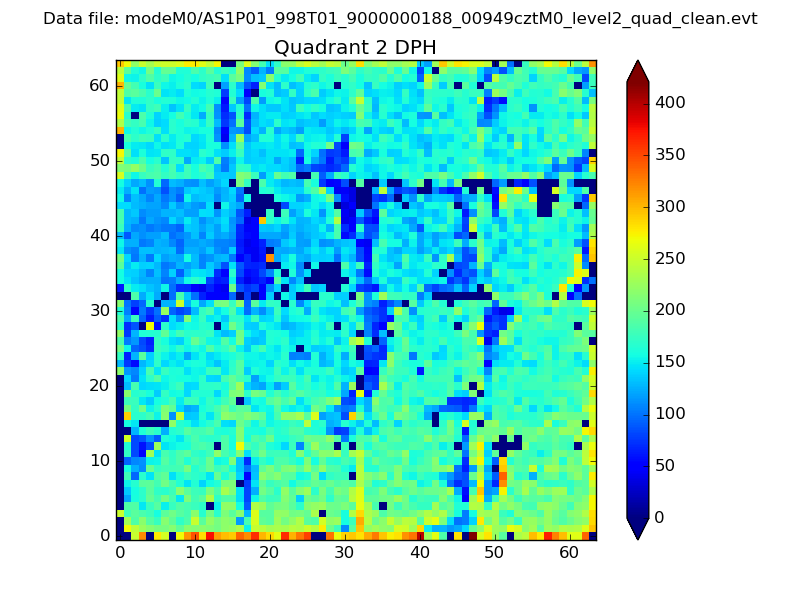
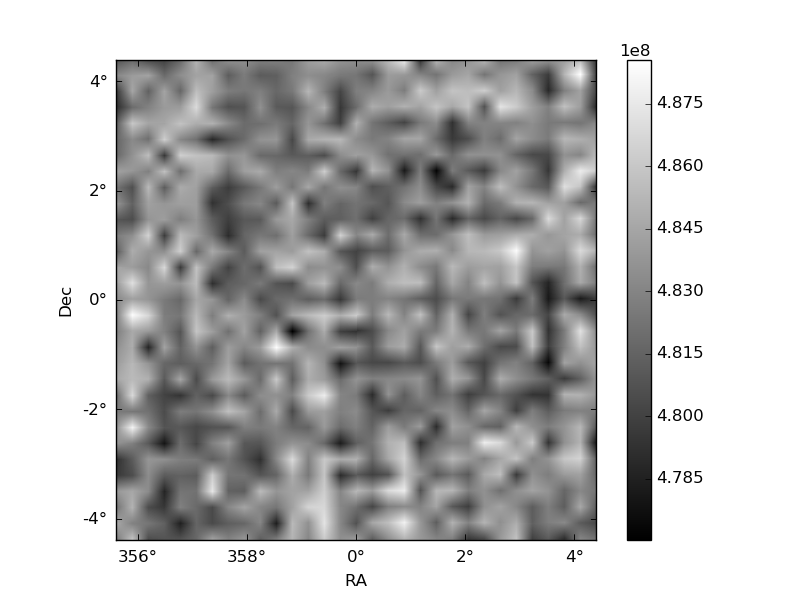
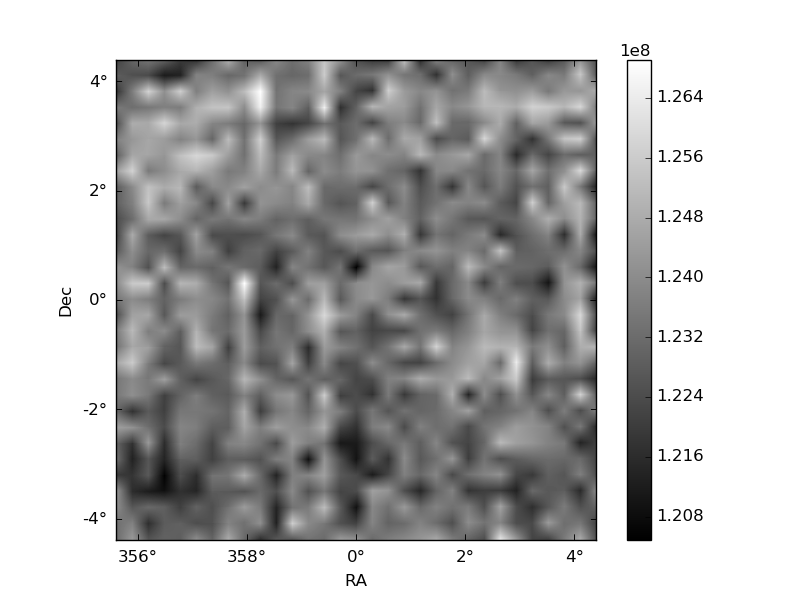
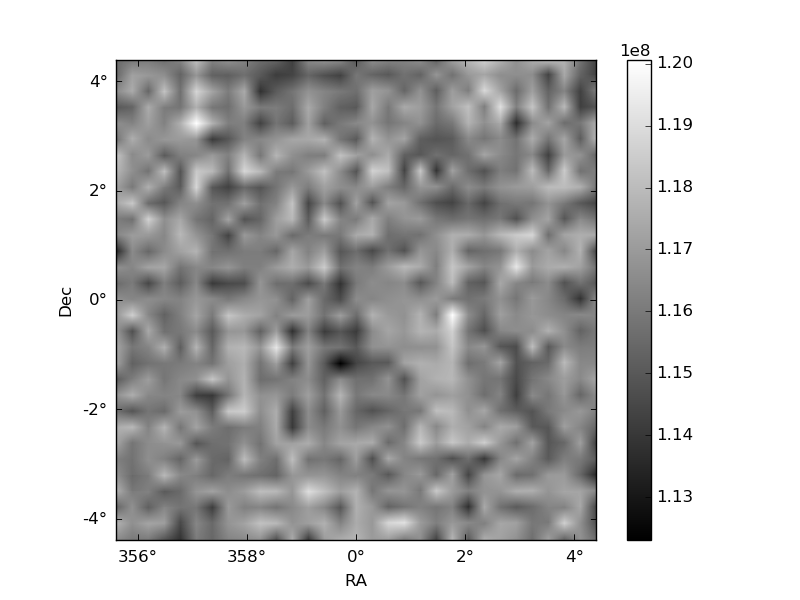
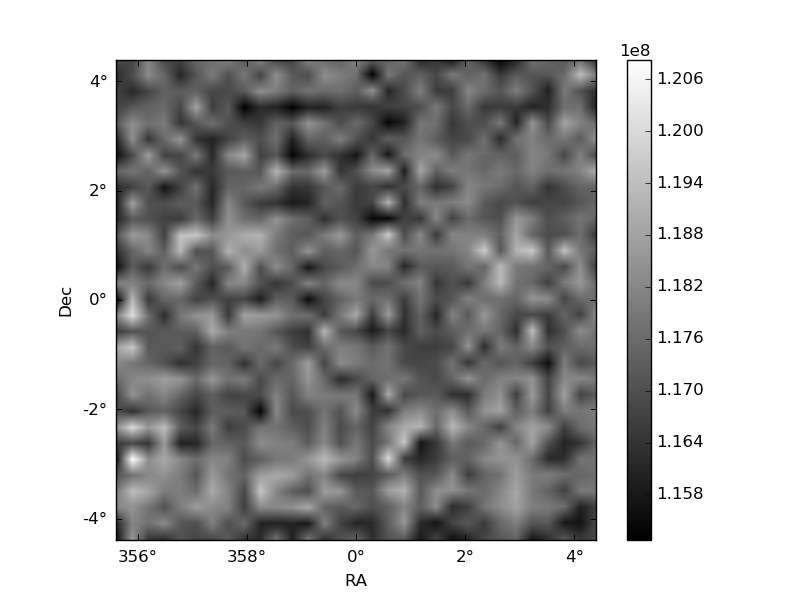
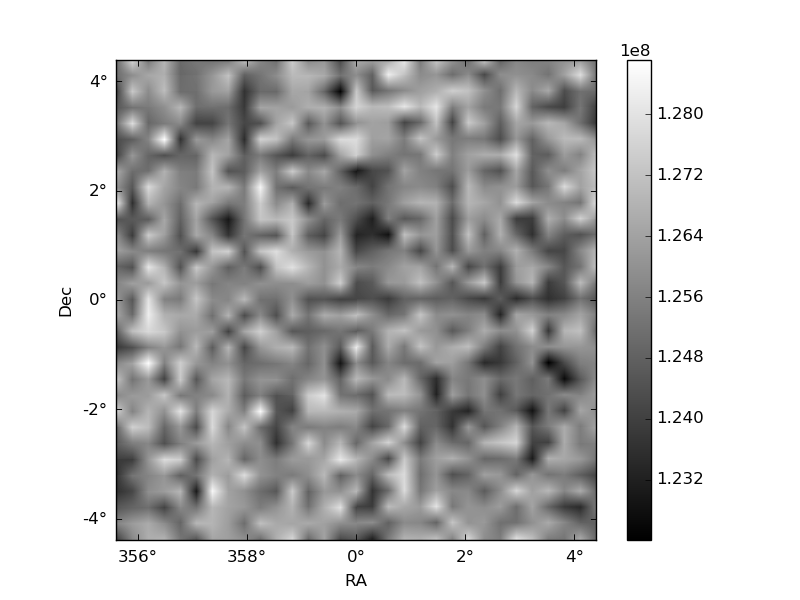
Histogram calculated using DETX and DETY for each event in the final _common_clean file
| Quadrant A | 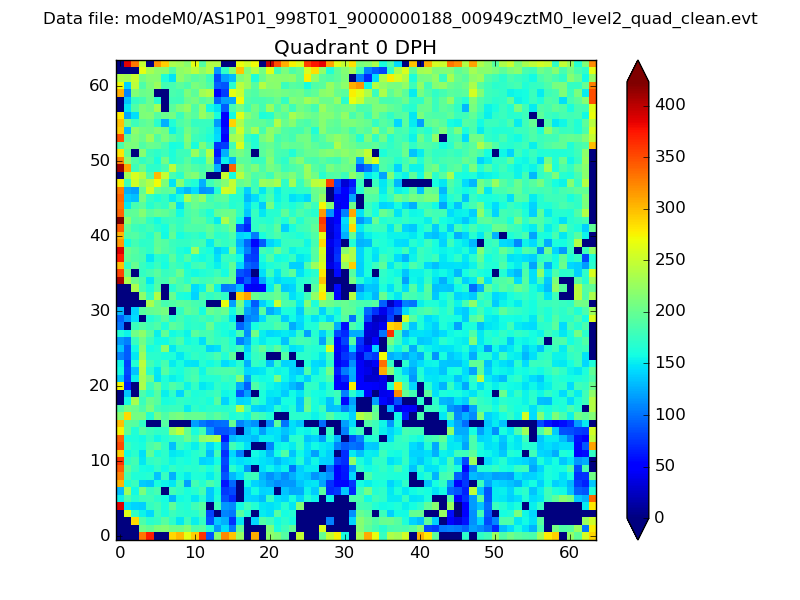 |
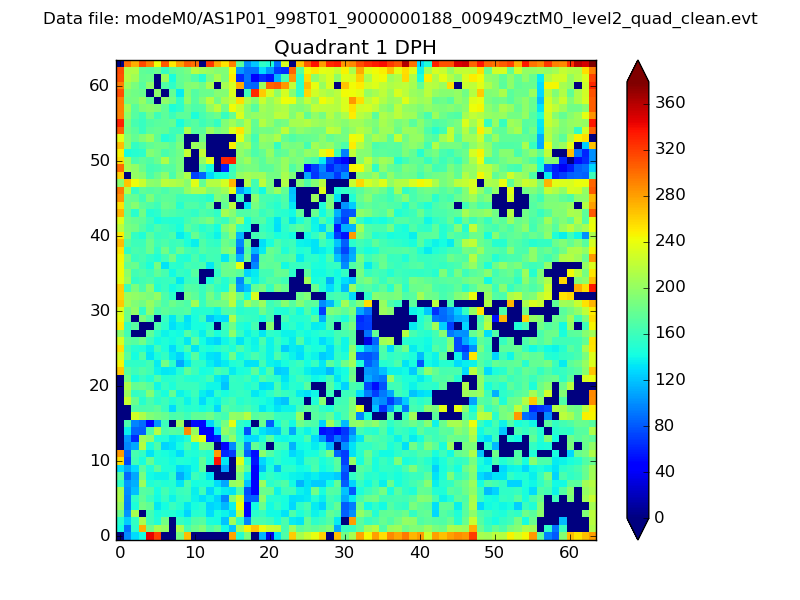 |
Quadrant B |
|---|---|---|---|
| Quadrant D | 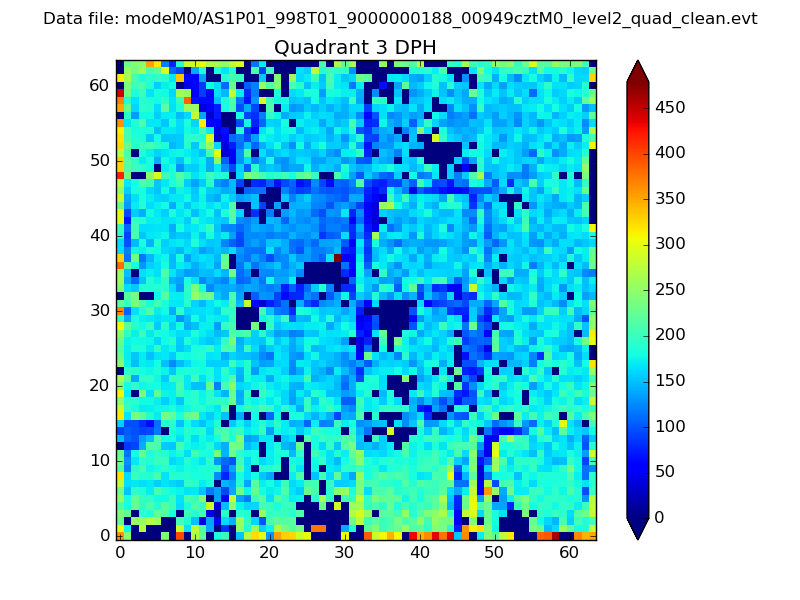 |
 |
Quadrant C |
| Plot type | Count rate plots | Images |
|---|---|---|
| Comparison with Poisson distribution Blue bars denote a histogram of data divided into 1 sec bins. Red curve is a Poisson curve with rate = median count rate of data. |
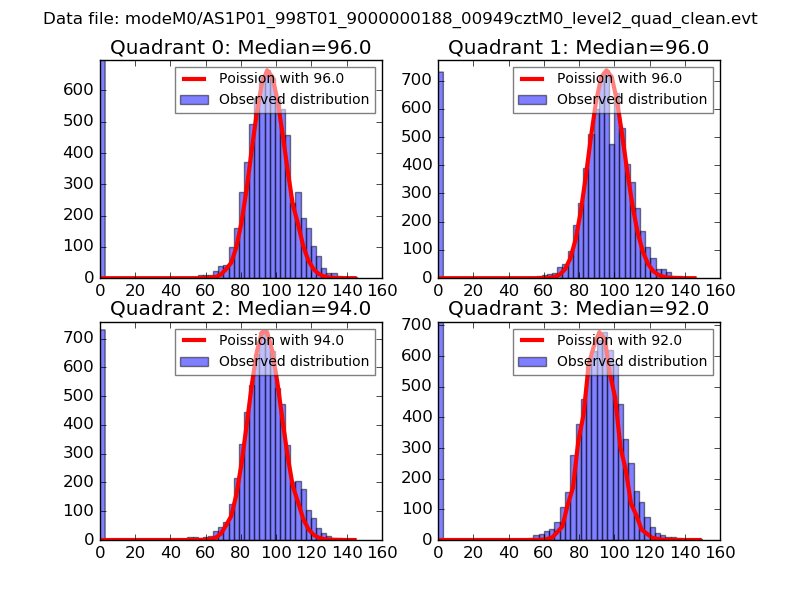 |
 |
| Quadrant-wise count rates Data is divided into 100 sec bins |
 |
|
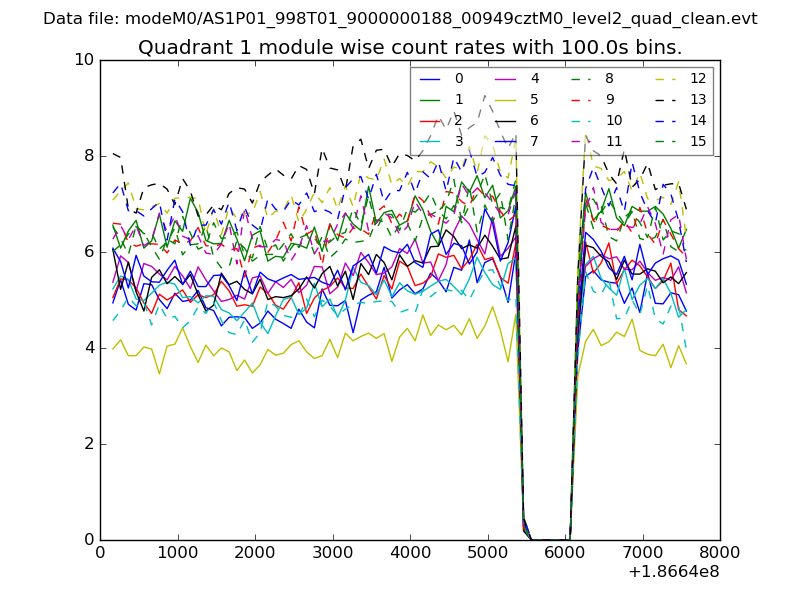
| Module-wise count rates for Quadrant A Data is divided into 100 sec bins |
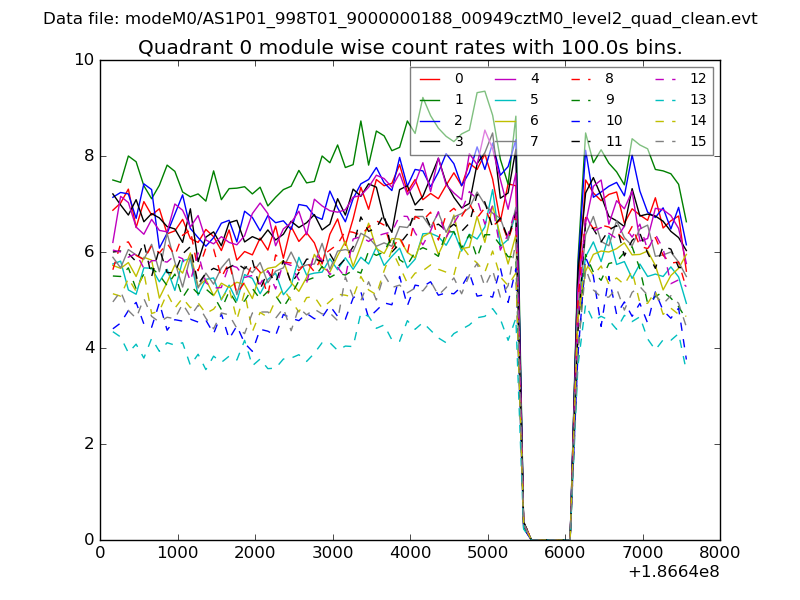 |
 |
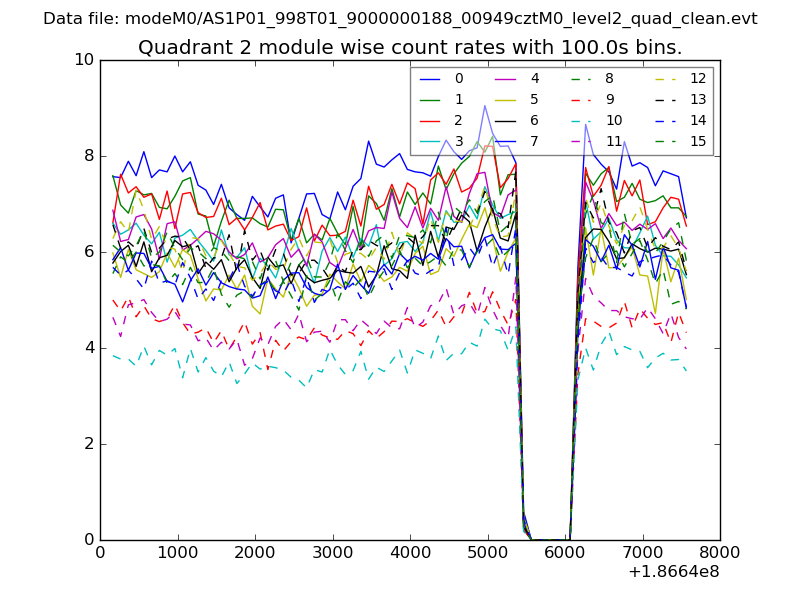
| Module-wise count rates for Quadrant B Data is divided into 100 sec bins |
 |
 |
| Module-wise count rates for Quadrant C Data is divided into 100 sec bins |
 |
 |
| Module-wise count rates for Quadrant D Data is divided into 100 sec bins |
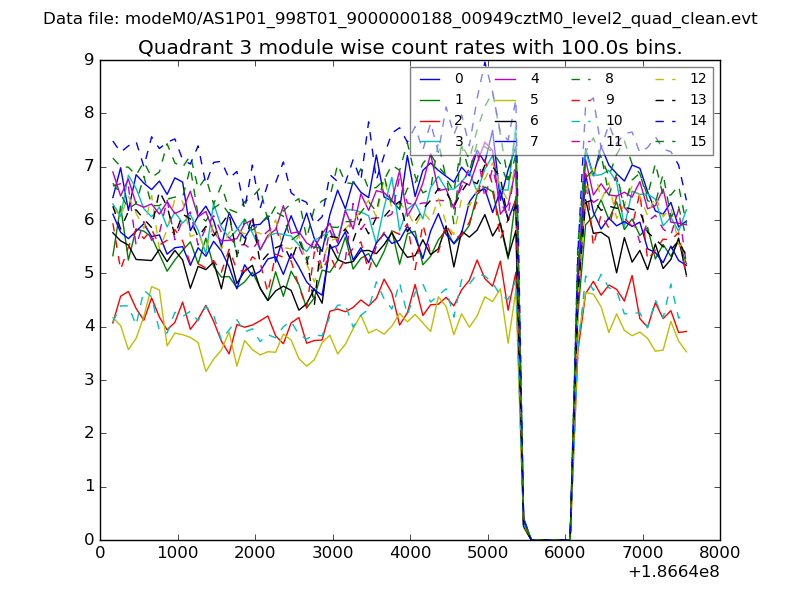 |
 |
| Parameter | Plot |
|---|---|
| CZT HV Monitor | 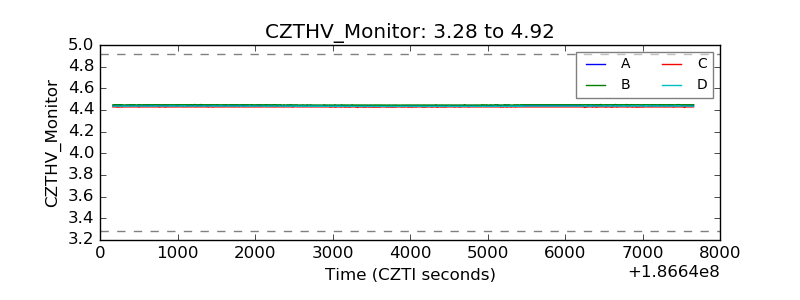 |
| D_VDD | 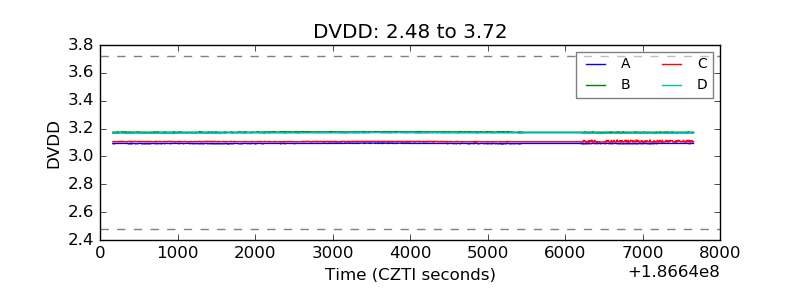 |
| Temperature 1 | 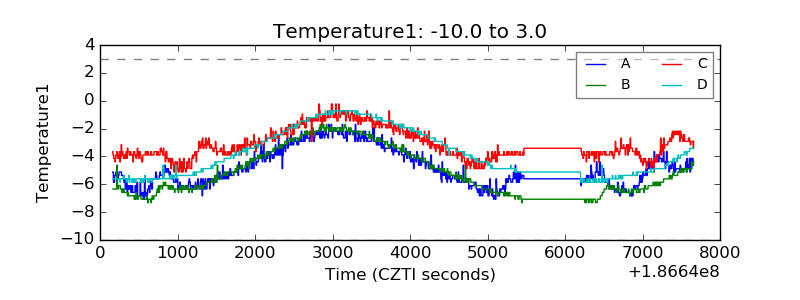 |
| Veto HV Monitor | 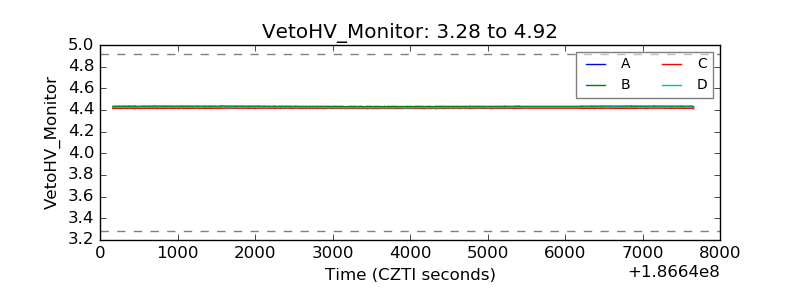 |
| Veto LLD | 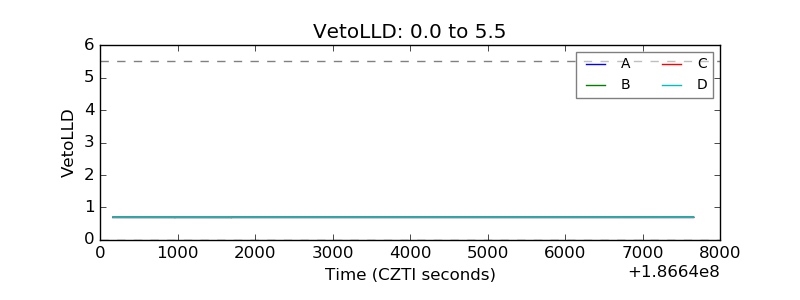 |
| Alpha Counter | 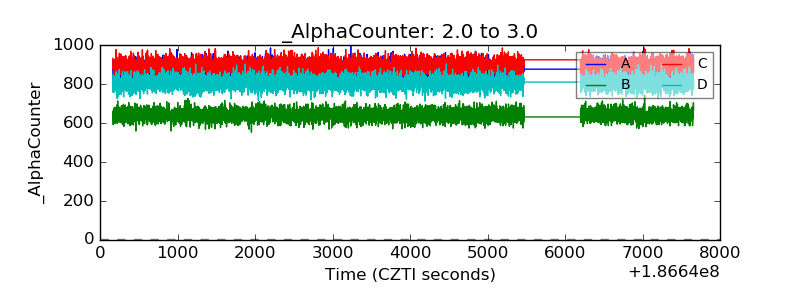 |
| _CPM_Rate | 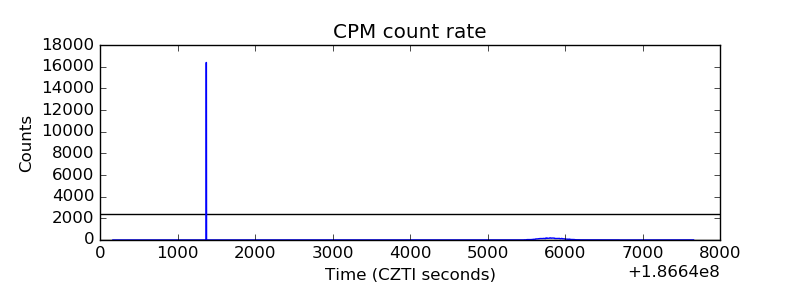 |
| CZT Counter | 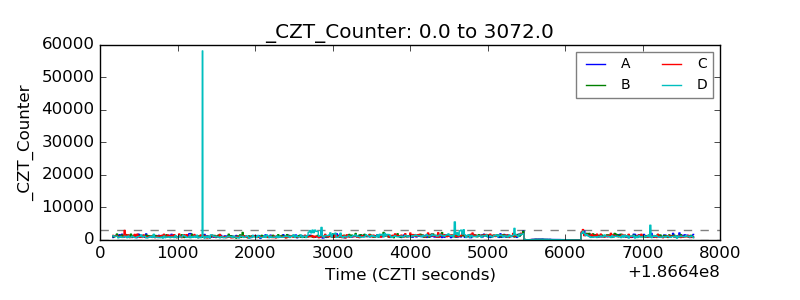 |
| +2.5 Volts monitor |  |
| +5 Volts monitor | 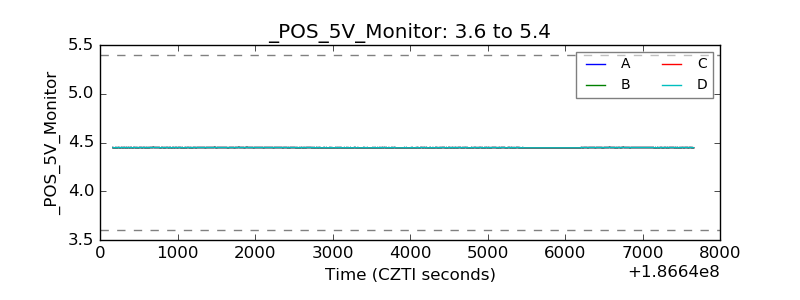 |
| _ROLL_ROT | 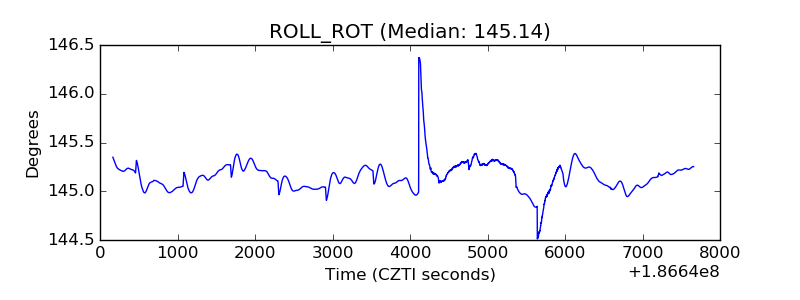 |
| _Roll_DEC | 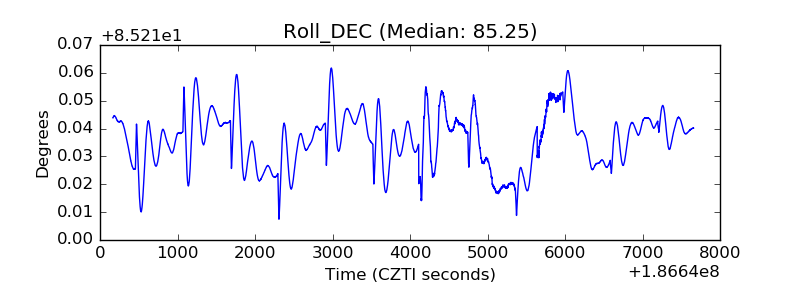 |
| _Roll_RA | 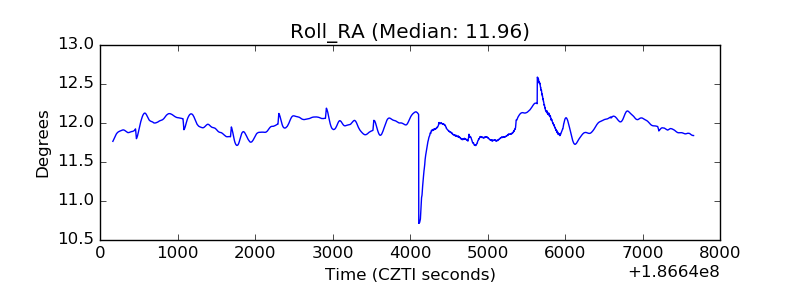 |
| Veto Counter | 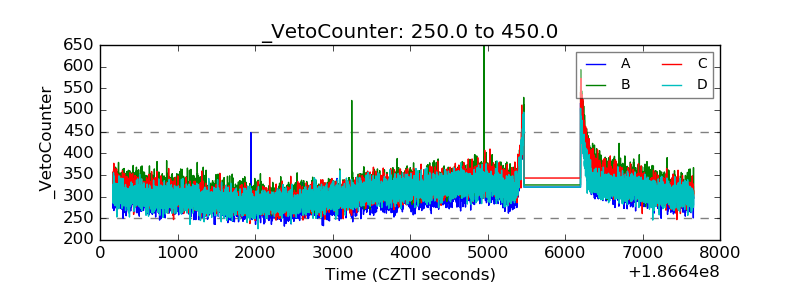 |