| Param | Original file | Final file |
|---|---|---|
| Filename | modeM0/AS1P01_998T01_9000000188_00950cztM0_level2.evt | modeM0/AS1P01_998T01_9000000188_00950cztM0_level2_quad_clean.evt |
| Size (bytes) | 1,069,620,480 | 92,257,920 |
| Size | 1020.1 MB | 88.0 MB |
| Events in quadrant A | 7,300,079 | 608,837 |
| Events in quadrant B | 7,585,393 | 606,127 |
| Events in quadrant C | 7,268,803 | 589,706 |
| Events in quadrant D | 9,832,412 | 559,550 |
| Mode M0 | |||
|---|---|---|---|
| Quadrant | BADHDUFLAG | Total packets | Discarded packets |
| A | 0 | 25996 | 0 |
| B | 0 | 26910 | 0 |
| C | 0 | 25952 | 0 |
| D | 0 | 33567 | 0 |
| Mode M9 | |||
|---|---|---|---|
| Quadrant | BADHDUFLAG | Total packets | Discarded packets |
| A | 0 | 9 | 0 |
| B | 0 | 9 | 0 |
| C | 0 | 9 | 0 |
| D | 0 | 9 | 0 |
| Mode SS | |||
|---|---|---|---|
| Quadrant | BADHDUFLAG | Total packets | Discarded packets |
| A | 0 | 124 | 0 |
| B | 0 | 124 | 0 |
| C | 0 | 124 | 0 |
| D | 0 | 124 | 0 |
| Quadrant | Total seconds | Saturated seconds | Saturation percentage |
|---|---|---|---|
| A | 6156 | 20 | 0.324886% |
| B | 6156 | 21 | 0.341131% |
| C | 6157 | 5 | 0.081208% |
| D | 6157 | 252 | 4.092902% |
Noise dominated data is calculated using 1-second bins in cleaned event files. If a bin has >2000 counts, and if more than 50% of those come from <1% of pixels, then it is considered to be noise-dominated and hence unusable.
| Quadrant | # 1 sec bins | Bins with >0 counts | Bins with >2000 counts | High rate bins dominated by noise | Noise dominated (total time) | Noise dominated (detector-on time) | Marked lightcurve |
|---|---|---|---|---|---|---|---|
| A | 7071 | 6157 | 130 | 130 | 1.84% | 2.11% | 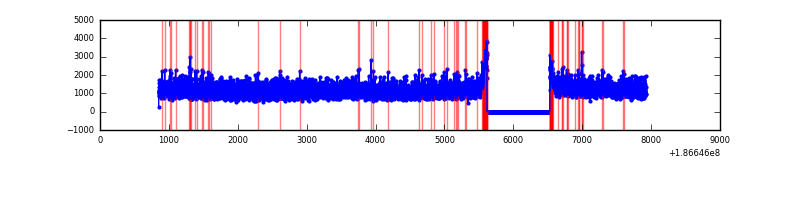 |
| B | 7071 | 6157 | 173 | 173 | 2.45% | 2.81% | 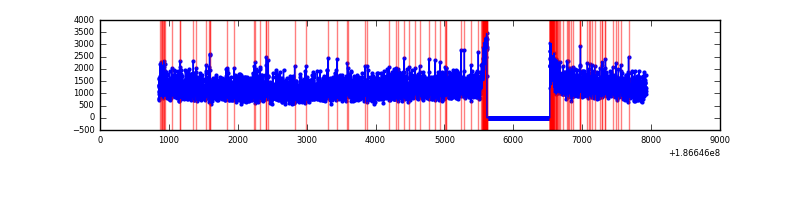 |
| C | 7072 | 6158 | 132 | 132 | 1.87% | 2.14% | 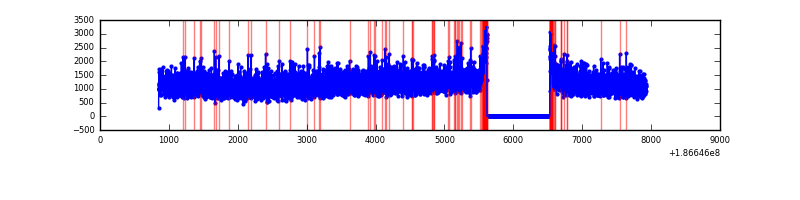 |
| D | 7072 | 6158 | 2034 | 2034 | 28.76% | 33.03% |  |
Top three noisy pixels from each quadrant. If the there are fewer than three noisy pixels in the level2.evt file, extra rows are filled as -1
| Pixel properties | Quadrant properties | ||||||
|---|---|---|---|---|---|---|---|
| Quadrant | DetID | PixID | Counts | Sigma | Mean | Median | Sigma |
| A | 11 | 79 | 8273 | 13.88 | 1900 | 1914 | 458.0 |
| A | 3 | 111 | 5858 | 8.61 | 1900 | 1914 | 458.0 |
| A | 14 | 203 | 4888 | 6.49 | 1900 | 1914 | 458.0 |
| B | 8 | 234 | 29970 | 60.13 | 1961 | 1969 | 465.6 |
| B | 12 | 52 | 21540 | 42.03 | 1961 | 1969 | 465.6 |
| B | 15 | 22 | 18217 | 34.89 | 1961 | 1969 | 465.6 |
| C | 15 | 241 | 294378 | 597.93 | 1758 | 1814 | 489.3 |
| C | 10 | 34 | 61390 | 121.76 | 1758 | 1814 | 489.3 |
| C | 3 | 111 | 26678 | 50.82 | 1758 | 1814 | 489.3 |
| D | 11 | 131 | 2900030 | 5440.33 | 1712 | 1777 | 532.7 |
| D | 1 | 4 | 158847 | 294.84 | 1712 | 1777 | 532.7 |
| D | 2 | 16 | 134441 | 249.02 | 1712 | 1777 | 532.7 |
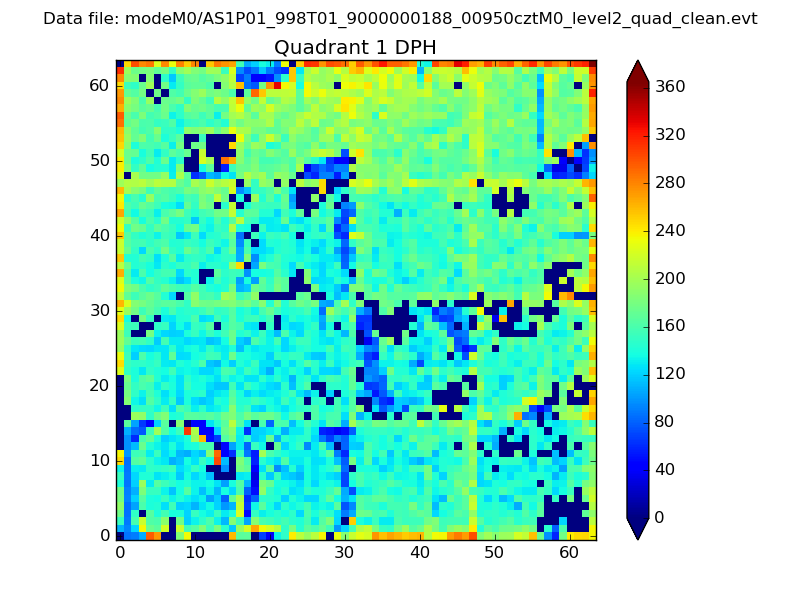
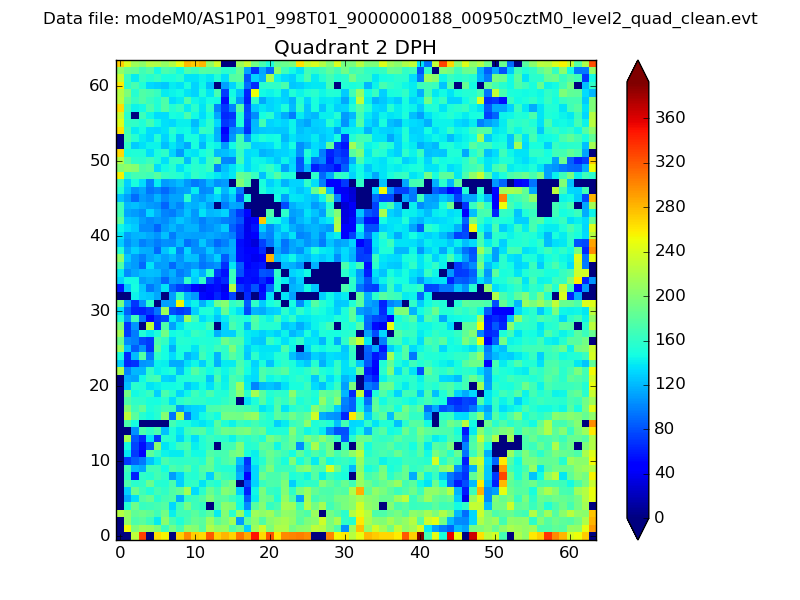
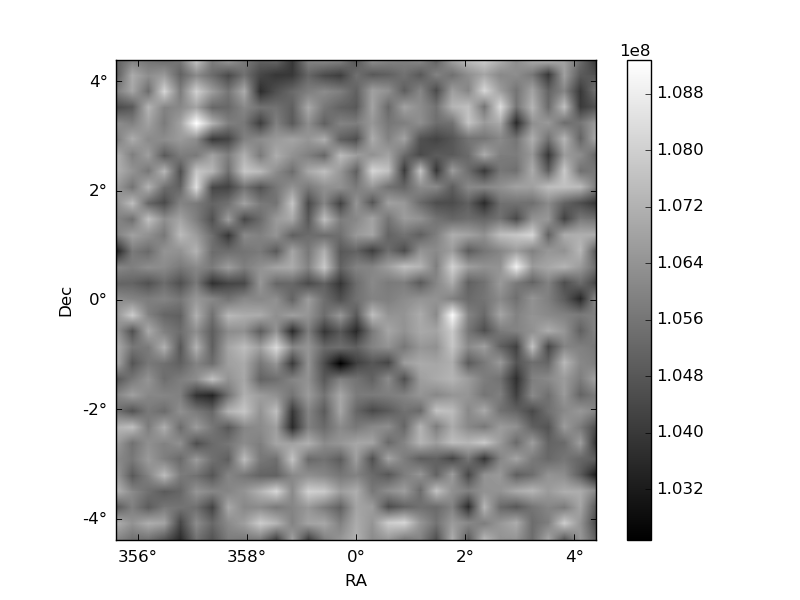
Histogram calculated using DETX and DETY for each event in the final _common_clean file
| Quadrant A | 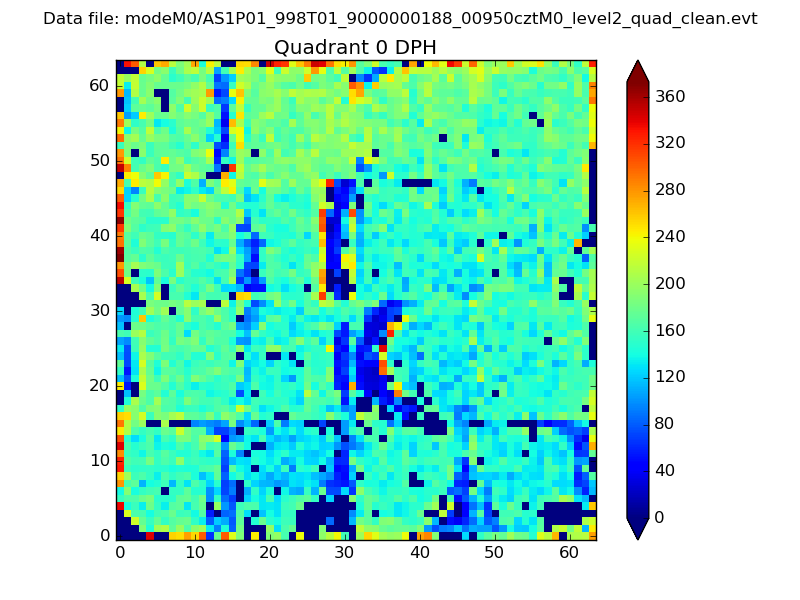 |
 |
Quadrant B |
|---|---|---|---|
| Quadrant D | 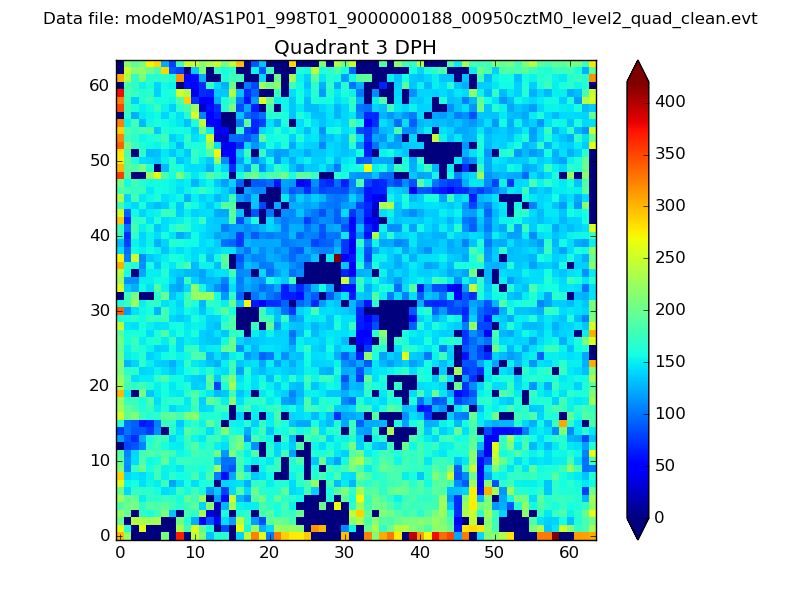 |
 |
Quadrant C |
| Plot type | Count rate plots | Images |
|---|---|---|
| Comparison with Poisson distribution Blue bars denote a histogram of data divided into 1 sec bins. Red curve is a Poisson curve with rate = median count rate of data. |
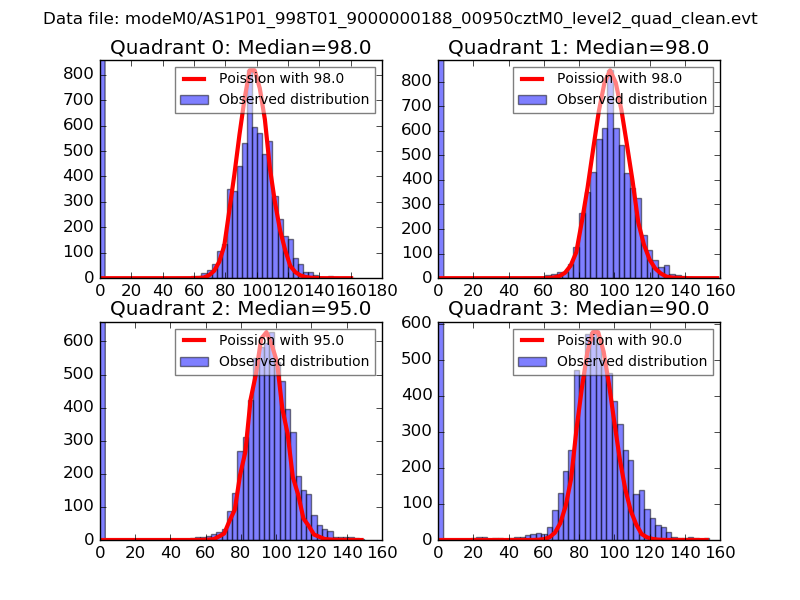 |
 |
| Quadrant-wise count rates Data is divided into 100 sec bins |
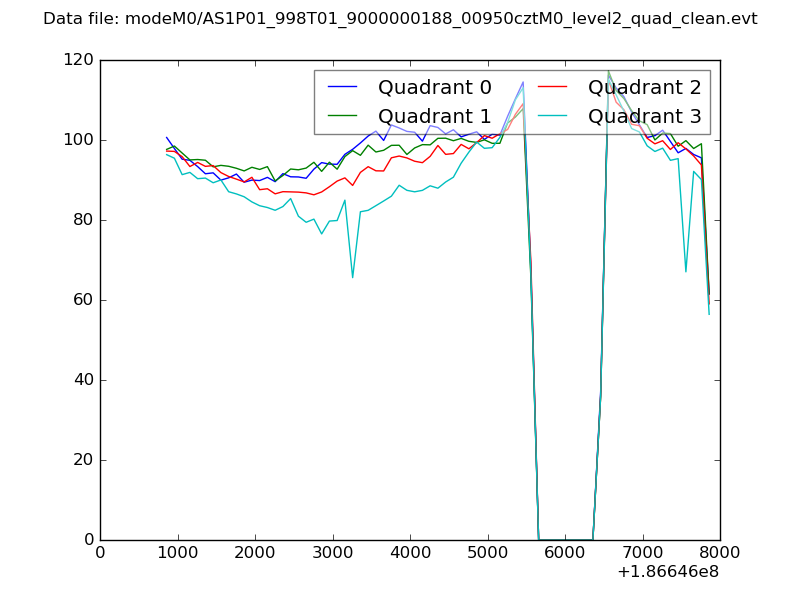 |
|
| Module-wise count rates for Quadrant A Data is divided into 100 sec bins |
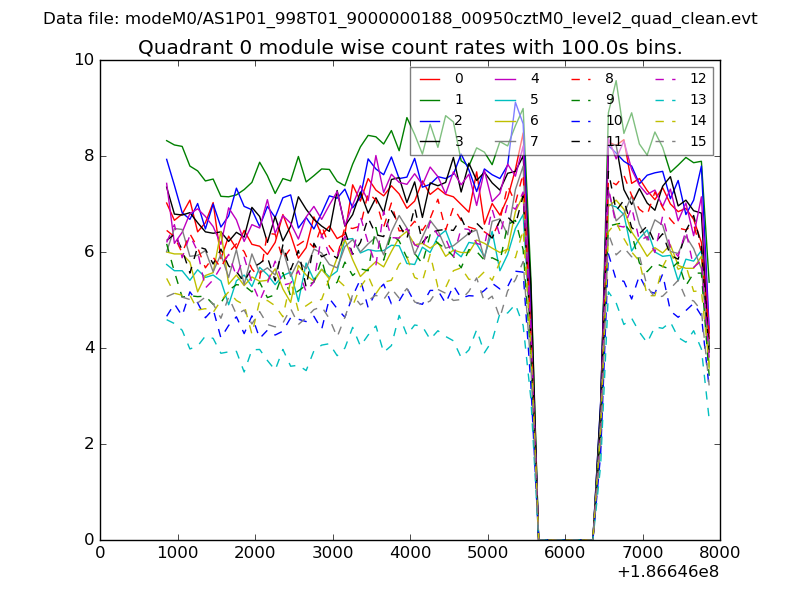 |
 |
| Module-wise count rates for Quadrant B Data is divided into 100 sec bins |
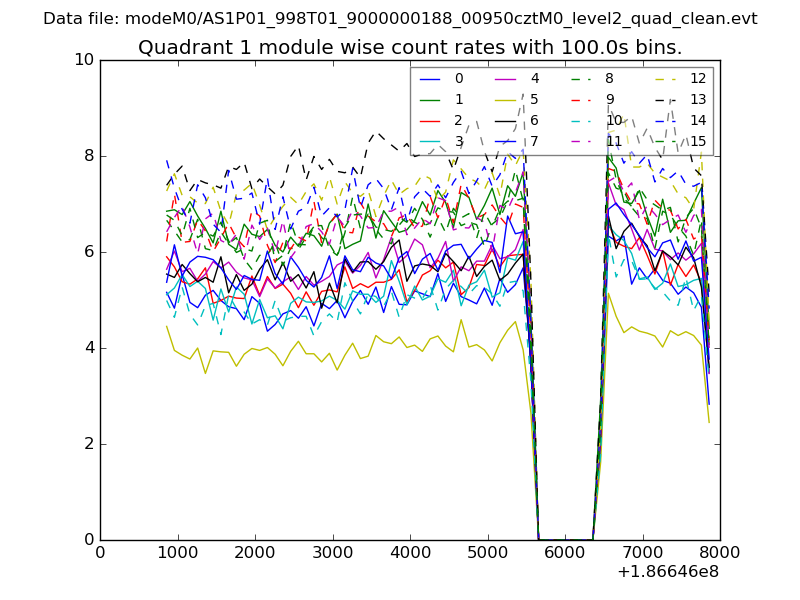 |
 |
| Module-wise count rates for Quadrant C Data is divided into 100 sec bins |
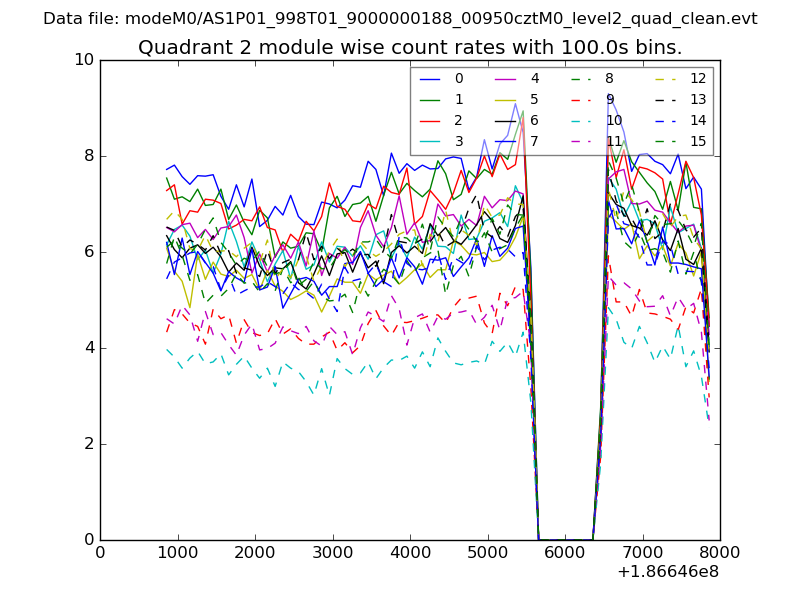 |
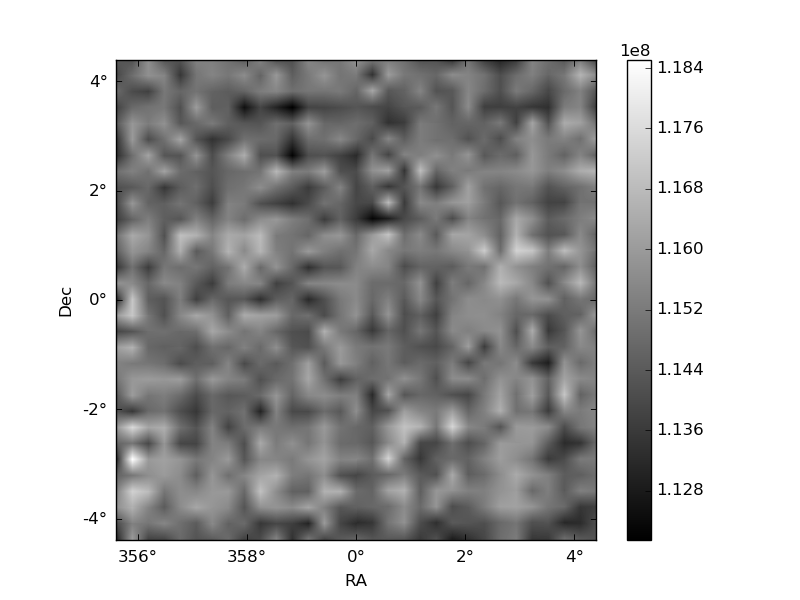 |
| Module-wise count rates for Quadrant D Data is divided into 100 sec bins |
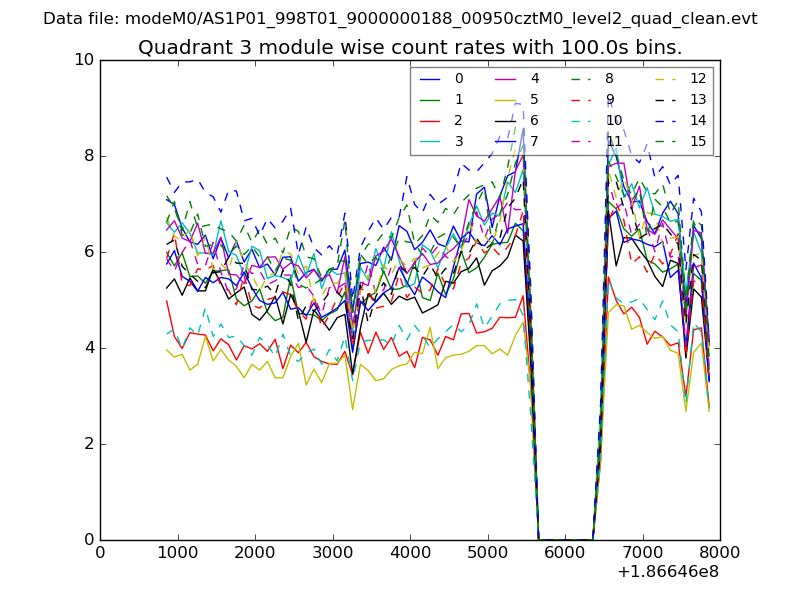 |
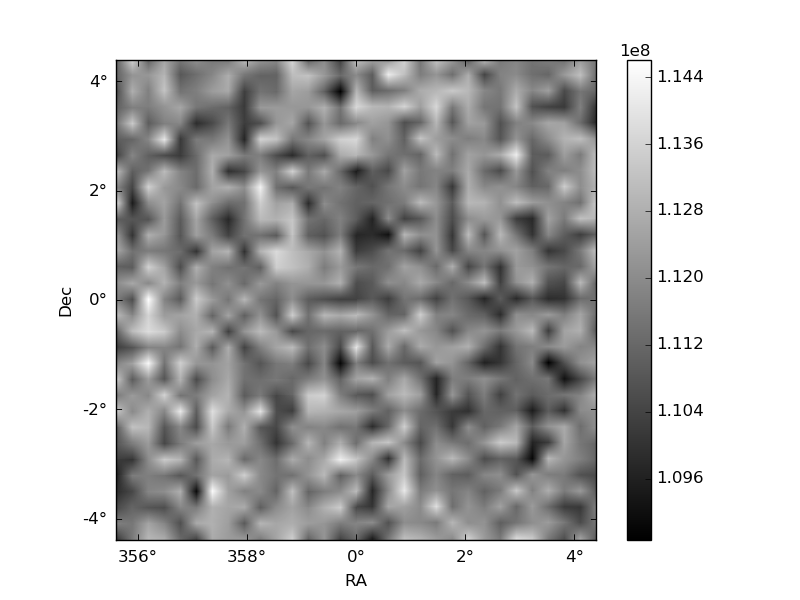 |
| Parameter | Plot |
|---|---|
| CZT HV Monitor | 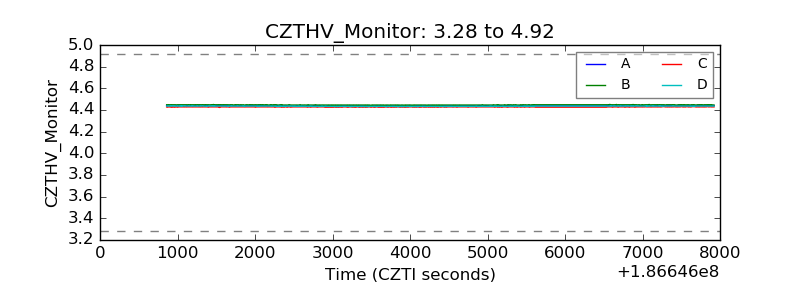 |
| D_VDD | 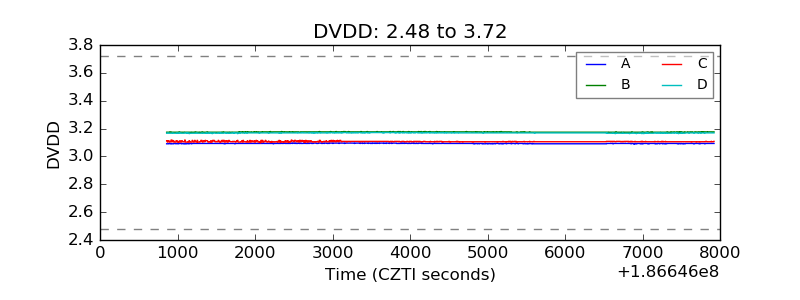 |
| Temperature 1 | 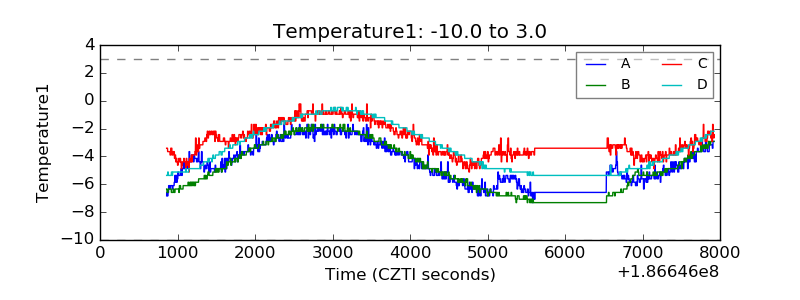 |
| Veto HV Monitor | 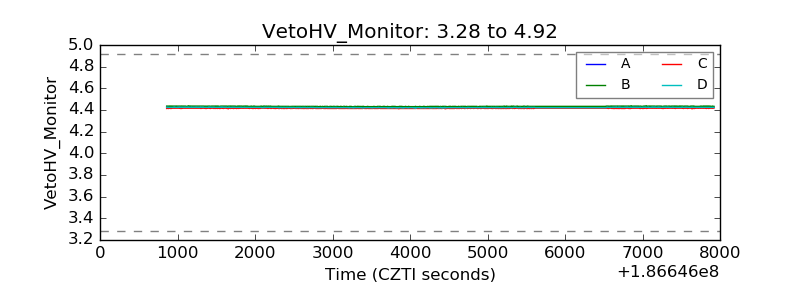 |
| Veto LLD | 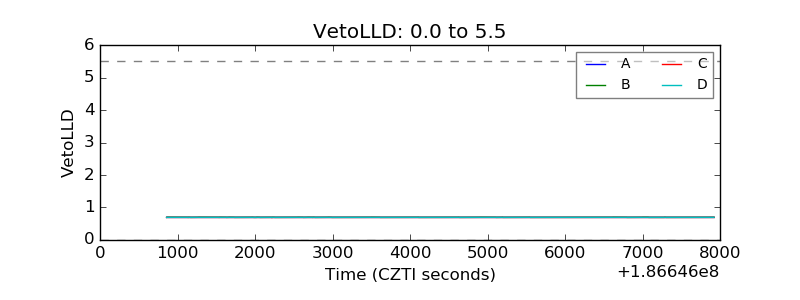 |
| Alpha Counter | 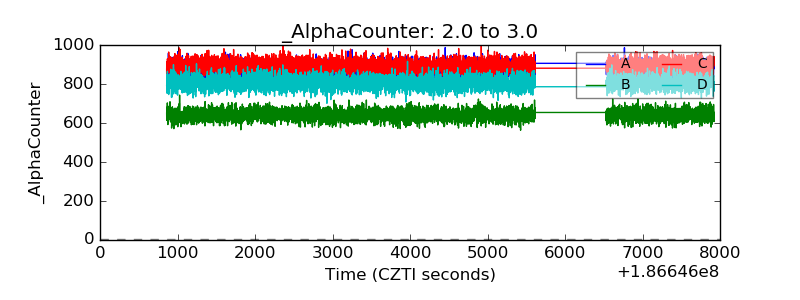 |
| _CPM_Rate | 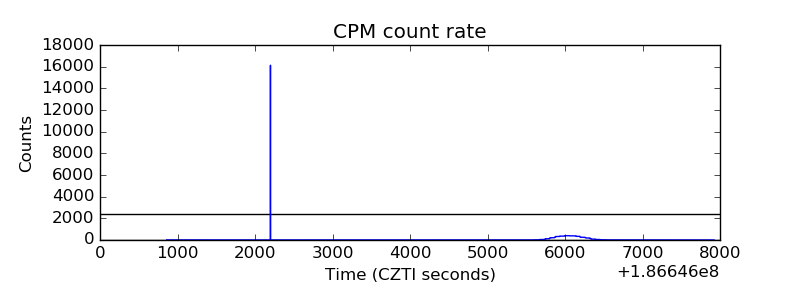 |
| CZT Counter | 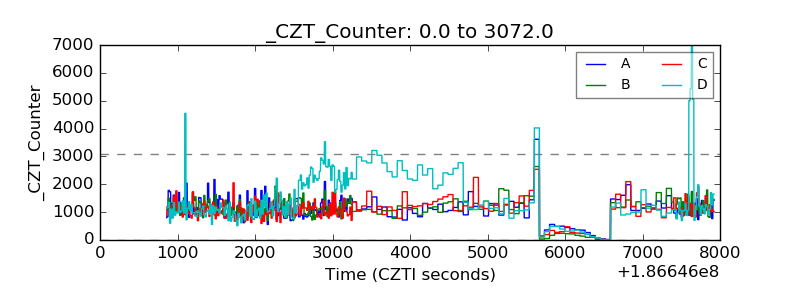 |
| +2.5 Volts monitor |  |
| +5 Volts monitor |  |
| _ROLL_ROT | 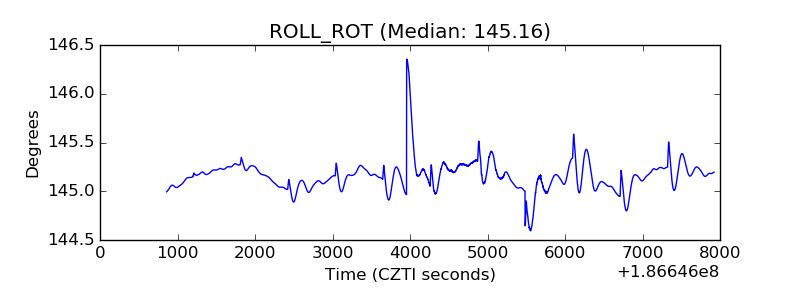 |
| _Roll_DEC | 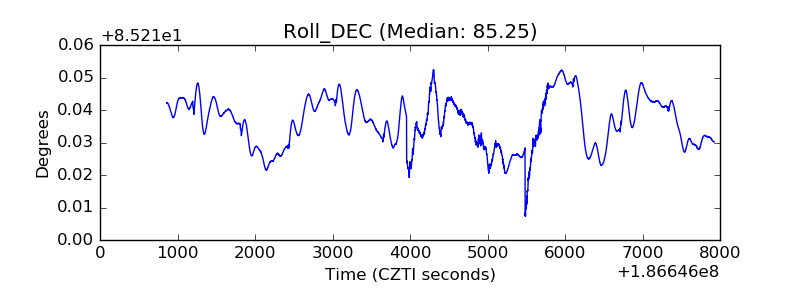 |
| _Roll_RA |  |
| Veto Counter | 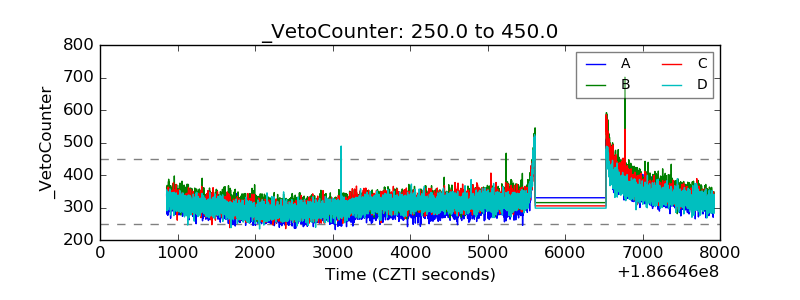 |