| Param | Original file | Final file |
|---|---|---|
| Filename | modeM0/AS1P01_998T01_9000000188_00952cztM0_level2.evt | modeM0/AS1P01_998T01_9000000188_00952cztM0_level2_quad_clean.evt |
| Size (bytes) | 1,038,107,520 | 98,835,840 |
| Size | 990.0 MB | 94.3 MB |
| Events in quadrant A | 7,672,564 | 651,628 |
| Events in quadrant B | 8,084,288 | 650,475 |
| Events in quadrant C | 8,040,194 | 625,469 |
| Events in quadrant D | 7,216,699 | 617,982 |
| Mode M0 | |||
|---|---|---|---|
| Quadrant | BADHDUFLAG | Total packets | Discarded packets |
| A | 0 | 27352 | 0 |
| B | 0 | 28533 | 0 |
| C | 0 | 28459 | 0 |
| D | 0 | 26062 | 0 |
| Mode M9 | |||
|---|---|---|---|
| Quadrant | BADHDUFLAG | Total packets | Discarded packets |
| A | 0 | 10 | 0 |
| B | 0 | 10 | 0 |
| C | 0 | 10 | 0 |
| D | 0 | 10 | 0 |
| Mode SS | |||
|---|---|---|---|
| Quadrant | BADHDUFLAG | Total packets | Discarded packets |
| A | 0 | 132 | 0 |
| B | 0 | 132 | 0 |
| C | 0 | 132 | 0 |
| D | 0 | 132 | 0 |
| Quadrant | Total seconds | Saturated seconds | Saturation percentage |
|---|---|---|---|
| A | 6412 | 34 | 0.530256% |
| B | 6412 | 33 | 0.514660% |
| C | 6412 | 23 | 0.358702% |
| D | 6411 | 74 | 1.154266% |
Noise dominated data is calculated using 1-second bins in cleaned event files. If a bin has >2000 counts, and if more than 50% of those come from <1% of pixels, then it is considered to be noise-dominated and hence unusable.
| Quadrant | # 1 sec bins | Bins with >0 counts | Bins with >2000 counts | High rate bins dominated by noise | Noise dominated (total time) | Noise dominated (detector-on time) | Marked lightcurve |
|---|---|---|---|---|---|---|---|
| A | 7462 | 6413 | 152 | 152 | 2.04% | 2.37% | 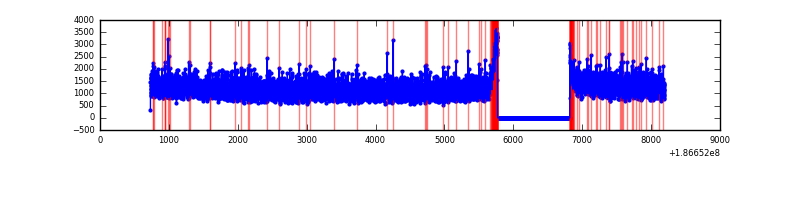 |
| B | 7462 | 6413 | 224 | 224 | 3.00% | 3.49% | 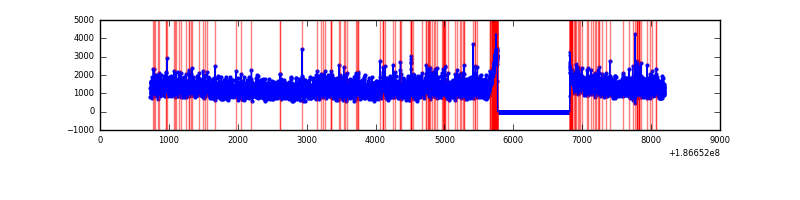 |
| C | 7462 | 6413 | 180 | 180 | 2.41% | 2.81% | 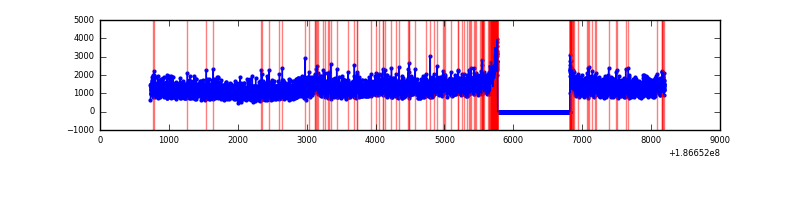 |
| D | 7461 | 6412 | 185 | 185 | 2.48% | 2.89% | 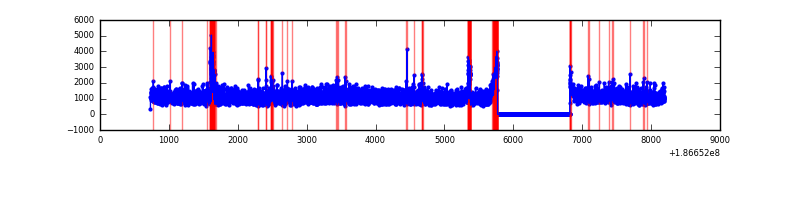 |
Top three noisy pixels from each quadrant. If the there are fewer than three noisy pixels in the level2.evt file, extra rows are filled as -1
| Pixel properties | Quadrant properties | ||||||
|---|---|---|---|---|---|---|---|
| Quadrant | DetID | PixID | Counts | Sigma | Mean | Median | Sigma |
| A | 11 | 79 | 8794 | 14.11 | 1999 | 2015 | 480.4 |
| A | 3 | 111 | 6147 | 8.6 | 1999 | 2015 | 480.4 |
| A | 14 | 203 | 5070 | 6.36 | 1999 | 2015 | 480.4 |
| B | 8 | 234 | 120878 | 246.41 | 2047 | 2056 | 482.2 |
| B | 15 | 22 | 49292 | 97.96 | 2047 | 2056 | 482.2 |
| B | 0 | 220 | 45006 | 89.07 | 2047 | 2056 | 482.2 |
| C | 10 | 34 | 509282 | 989.06 | 1840 | 1897 | 513.0 |
| C | 15 | 241 | 298108 | 577.41 | 1840 | 1897 | 513.0 |
| C | 3 | 111 | 25035 | 45.1 | 1840 | 1897 | 513.0 |
| D | 2 | 16 | 231030 | 411.26 | 1807 | 1866 | 557.2 |
| D | 1 | 4 | 187268 | 332.73 | 1807 | 1866 | 557.2 |
| D | 12 | 22 | 13431 | 20.75 | 1807 | 1866 | 557.2 |
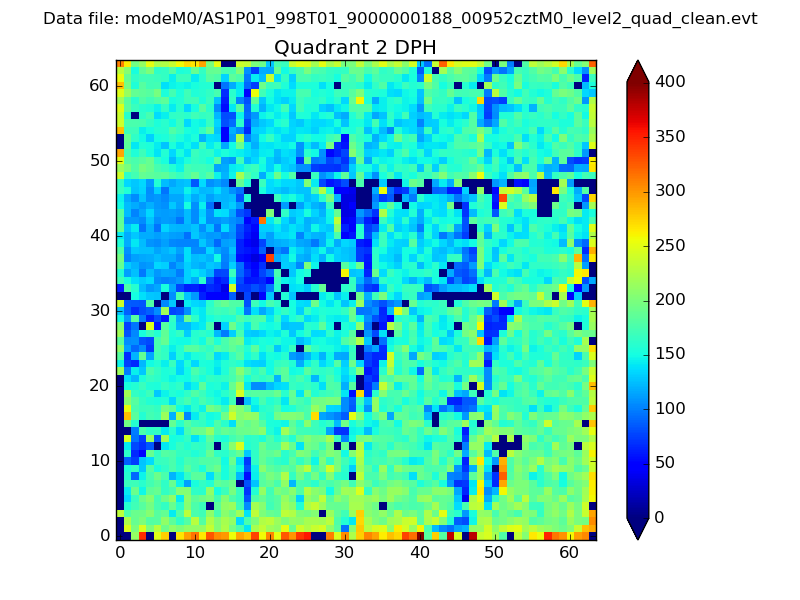
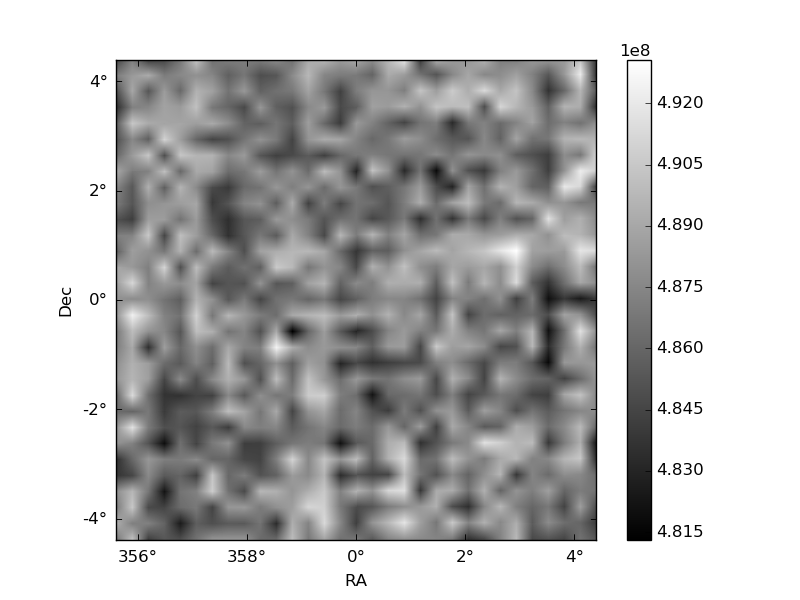
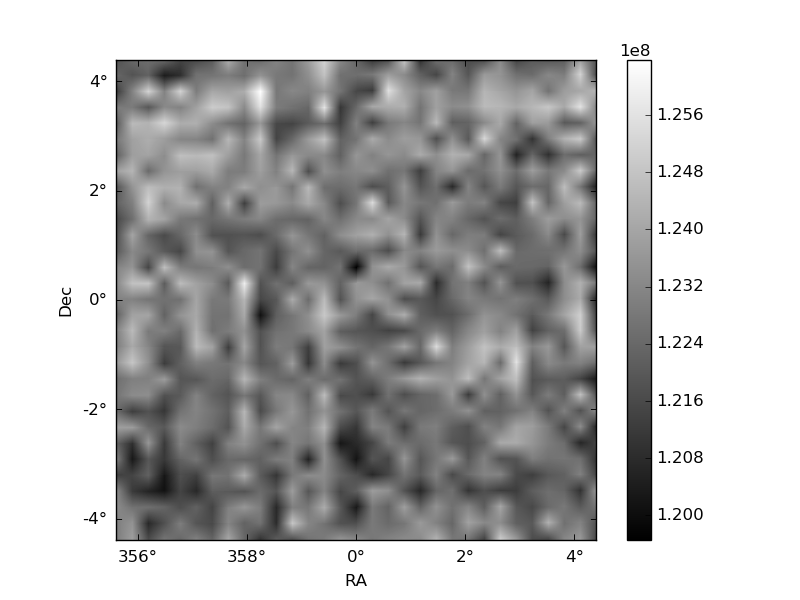
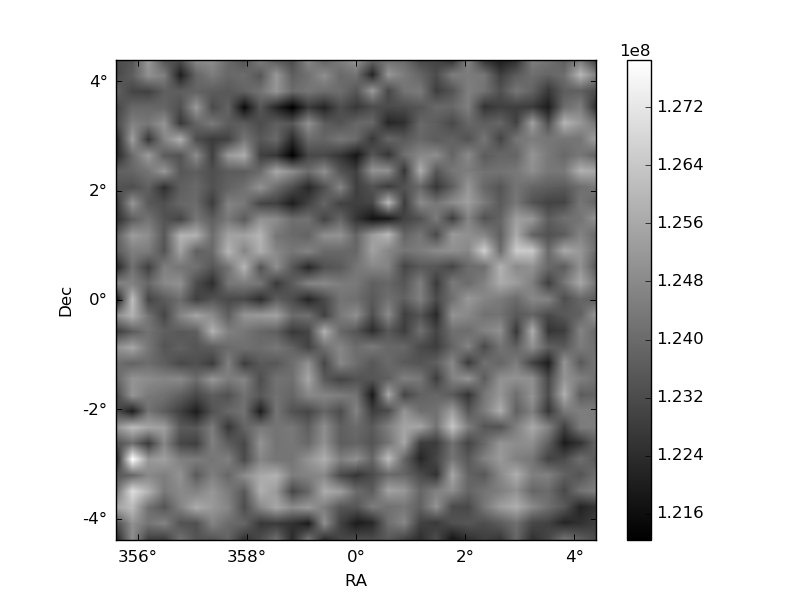
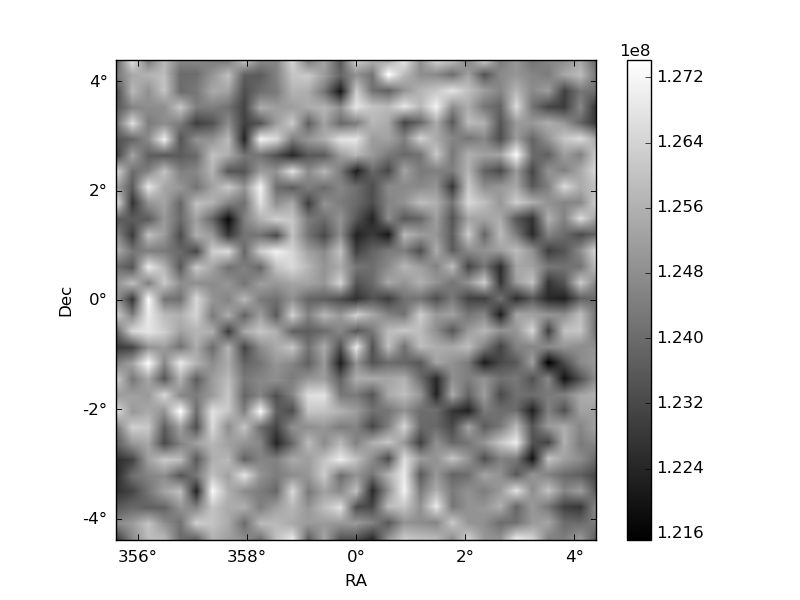
Histogram calculated using DETX and DETY for each event in the final _common_clean file
| Quadrant A | 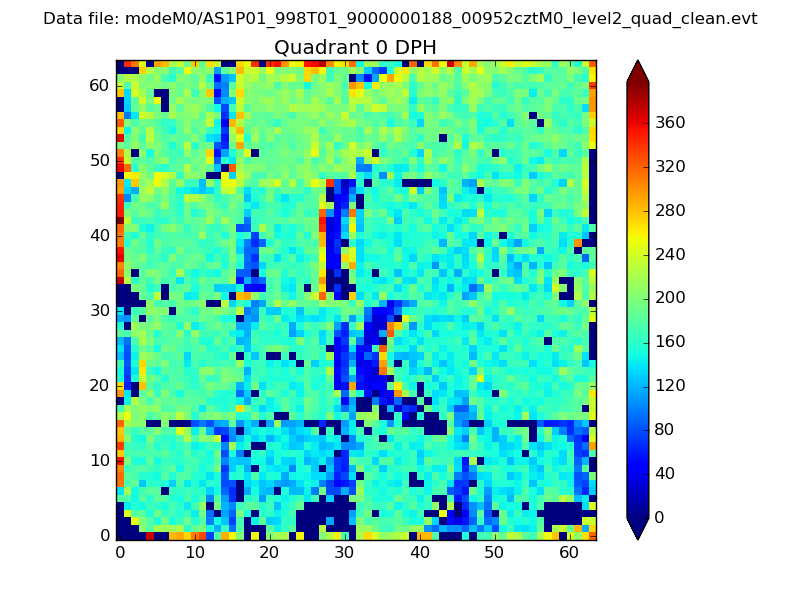 |
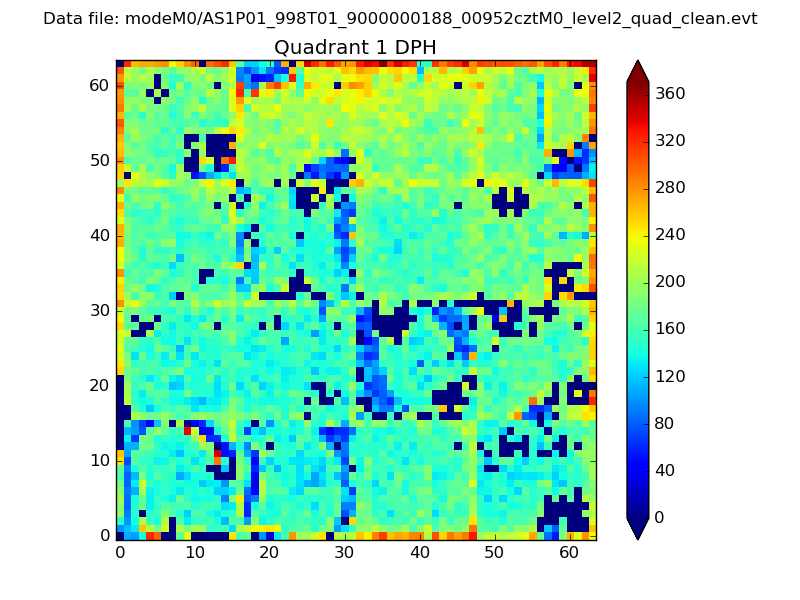 |
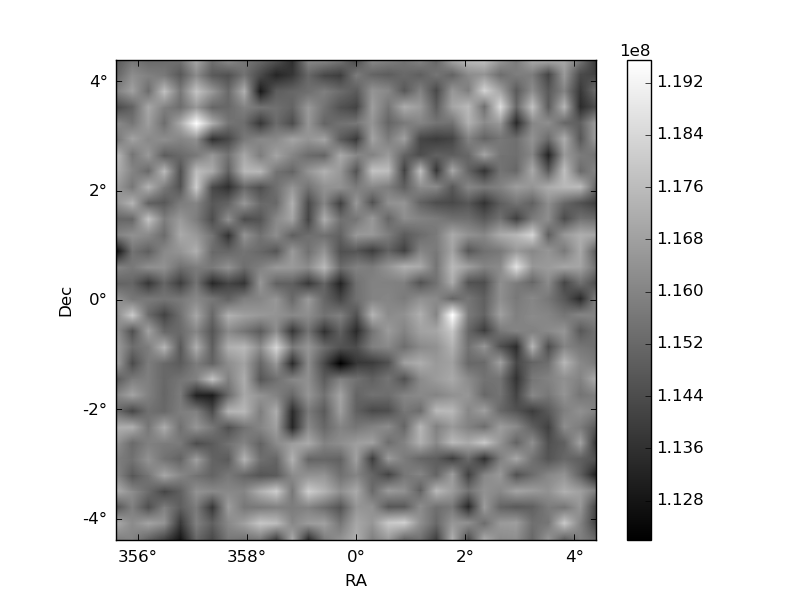
Quadrant B |
|---|---|---|---|
| Quadrant D | 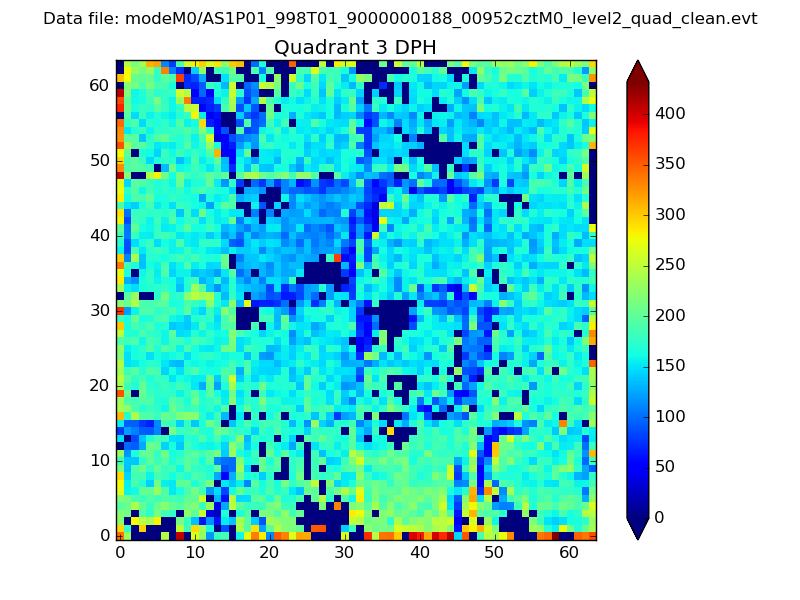 |
 |
Quadrant C |
| Plot type | Count rate plots | Images |
|---|---|---|
| Comparison with Poisson distribution Blue bars denote a histogram of data divided into 1 sec bins. Red curve is a Poisson curve with rate = median count rate of data. |
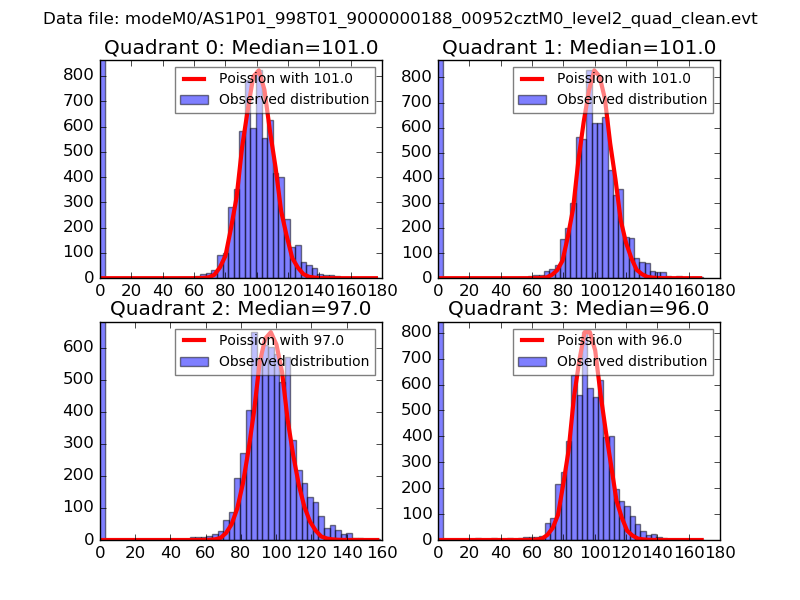 |
 |
| Quadrant-wise count rates Data is divided into 100 sec bins |
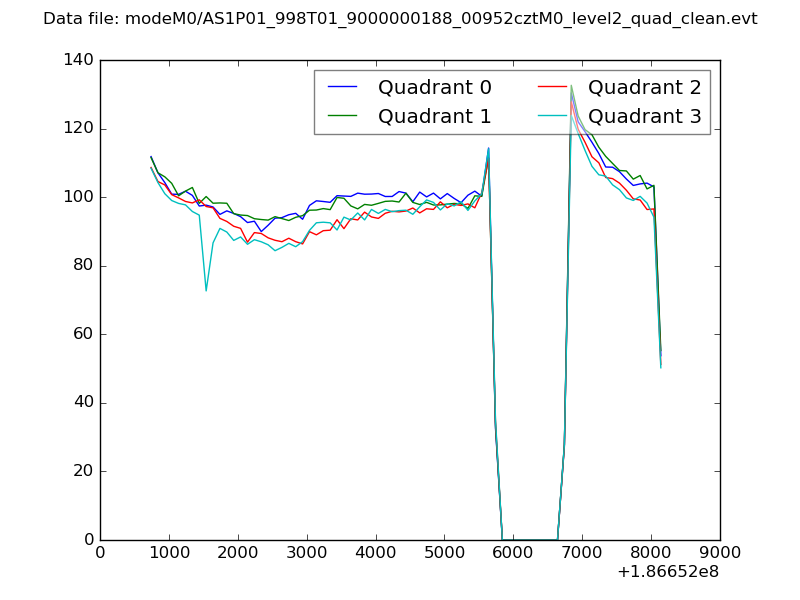 |
|
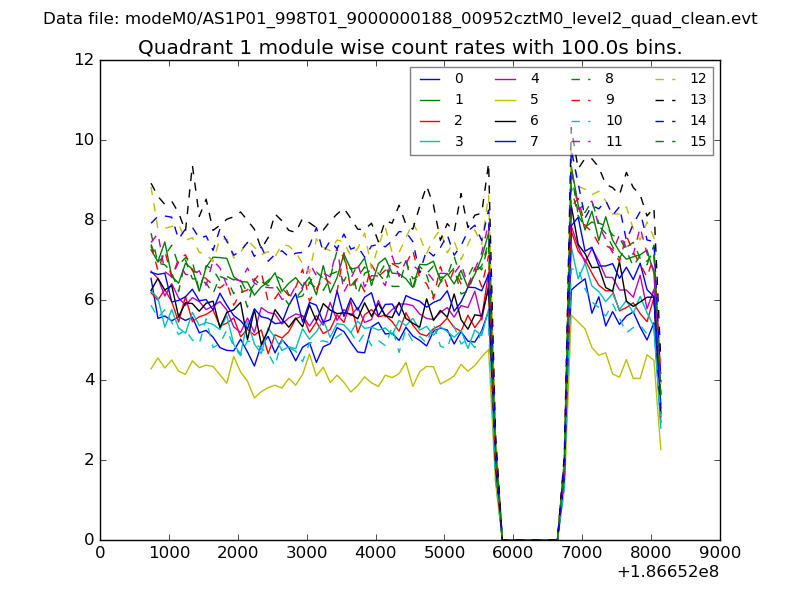
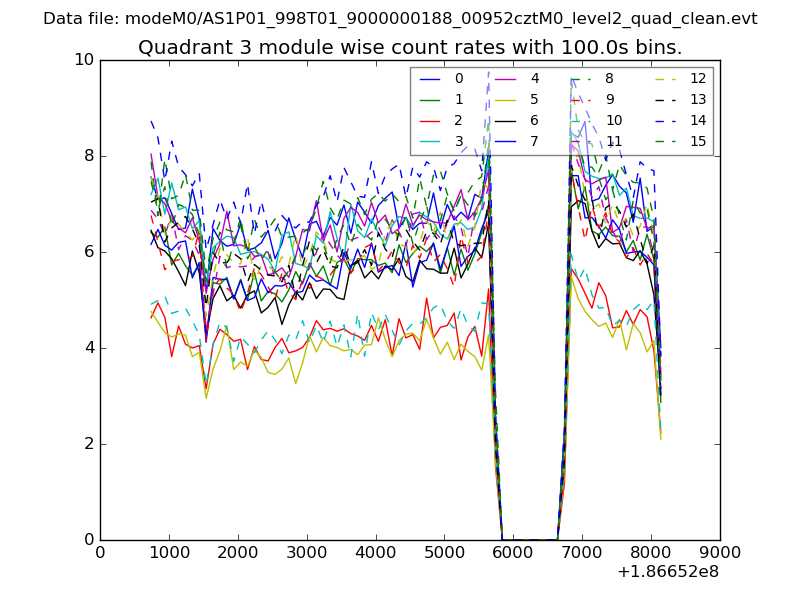
| Module-wise count rates for Quadrant A Data is divided into 100 sec bins |
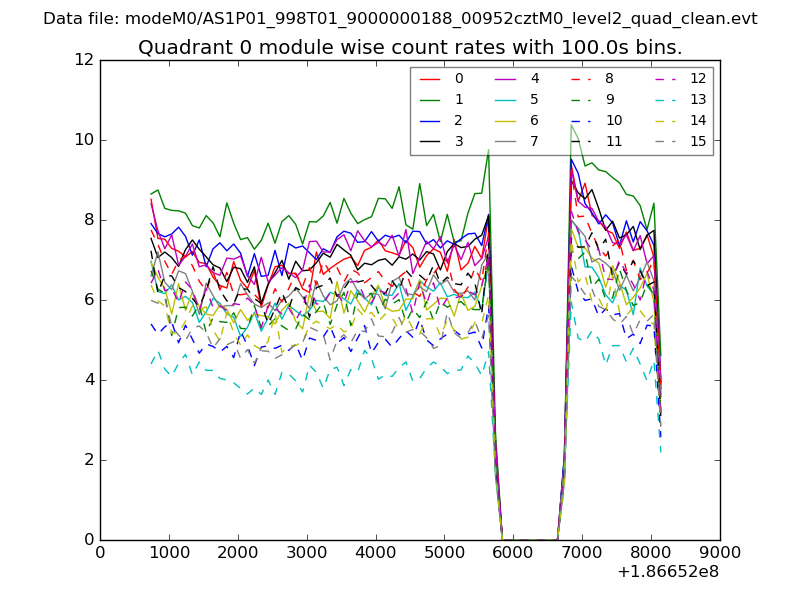 |
 |
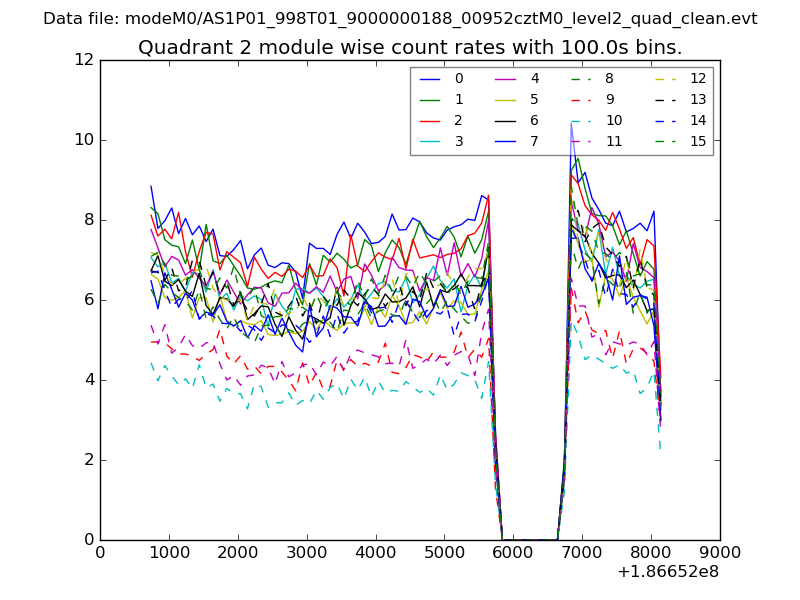
| Module-wise count rates for Quadrant B Data is divided into 100 sec bins |
 |
 |
| Module-wise count rates for Quadrant C Data is divided into 100 sec bins |
 |
 |
| Module-wise count rates for Quadrant D Data is divided into 100 sec bins |
 |
 |
| Parameter | Plot |
|---|---|
| CZT HV Monitor | 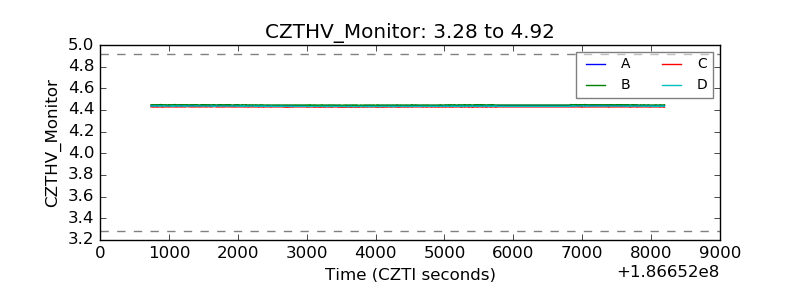 |
| D_VDD | 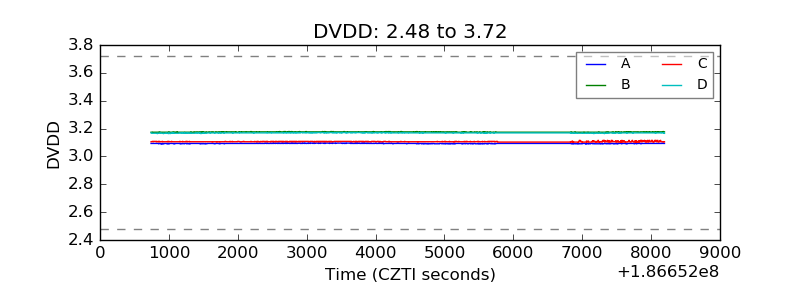 |
| Temperature 1 | 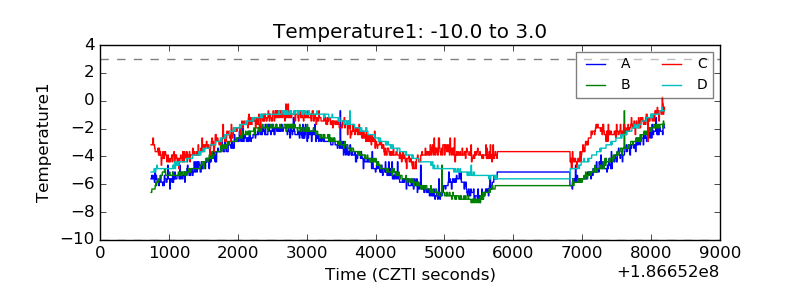 |
| Veto HV Monitor | 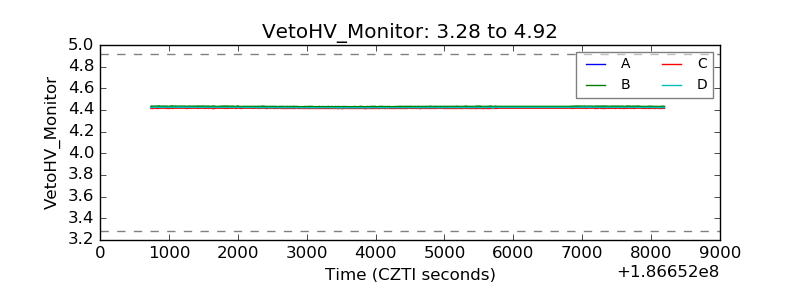 |
| Veto LLD | 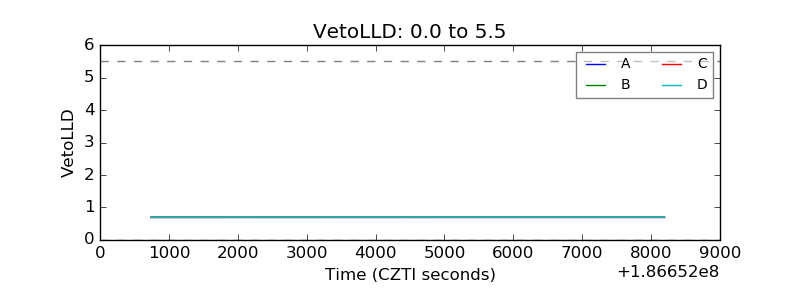 |
| Alpha Counter | 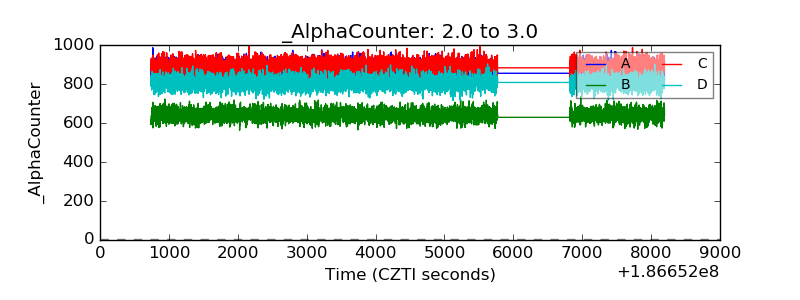 |
| _CPM_Rate | 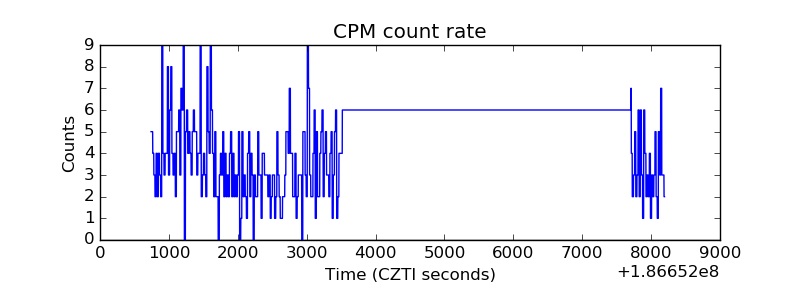 |
| CZT Counter | 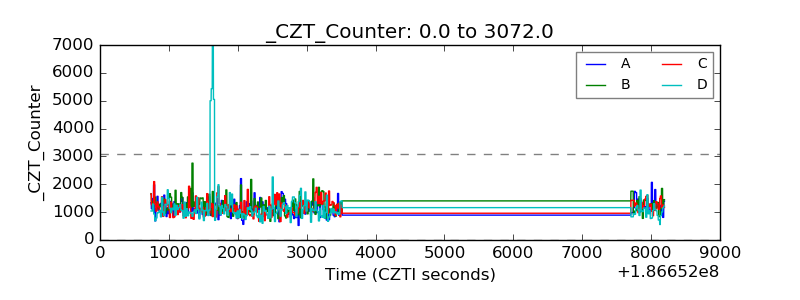 |
| +2.5 Volts monitor |  |
| +5 Volts monitor | 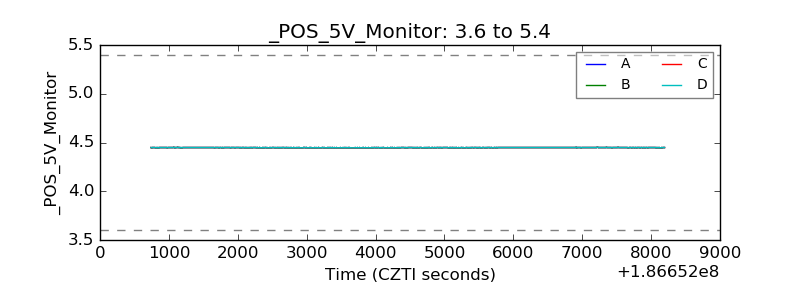 |
| _ROLL_ROT | 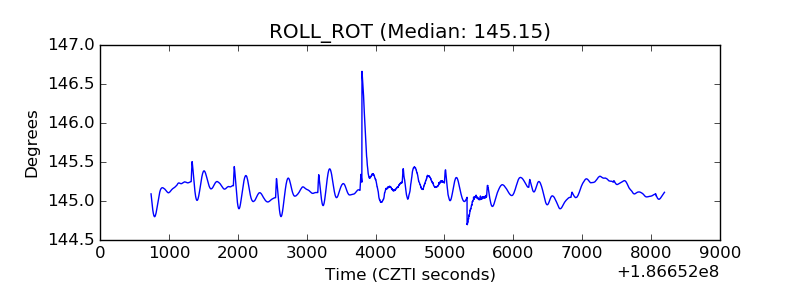 |
| _Roll_DEC | 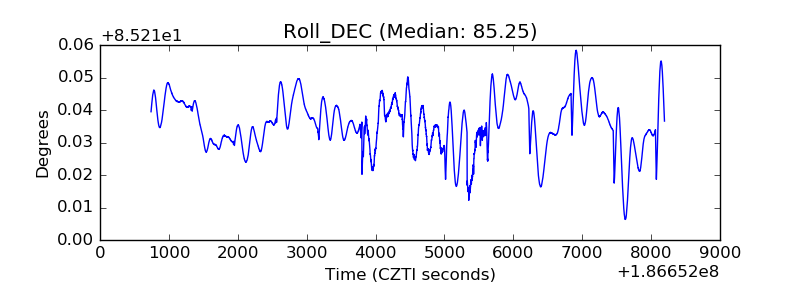 |
| _Roll_RA | 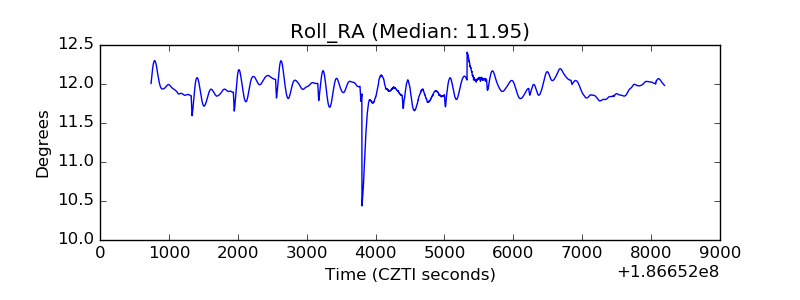 |
| Veto Counter | 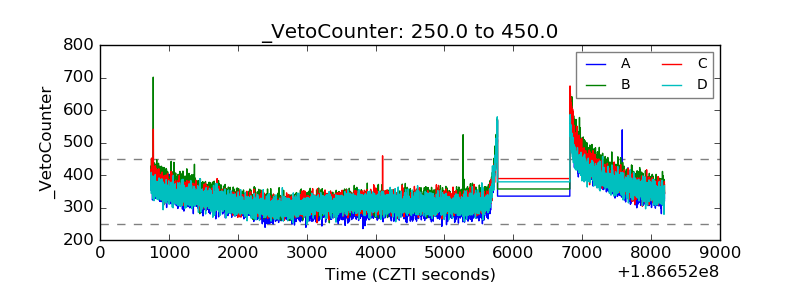 |