| Param | Original file | Final file |
|---|---|---|
| Filename | modeM0/AS1P01_998T01_9000000188_00954cztM0_level2.evt | modeM0/AS1P01_998T01_9000000188_00954cztM0_level2_quad_clean.evt |
| Size (bytes) | 1,056,441,600 | 101,036,160 |
| Size | 1007.5 MB | 96.4 MB |
| Events in quadrant A | 7,669,134 | 676,971 |
| Events in quadrant B | 7,958,621 | 670,061 |
| Events in quadrant C | 8,562,870 | 644,138 |
| Events in quadrant D | 7,395,810 | 638,237 |
| Mode M0 | |||
|---|---|---|---|
| Quadrant | BADHDUFLAG | Total packets | Discarded packets |
| A | 0 | 27164 | 0 |
| B | 0 | 28016 | 0 |
| C | 0 | 29759 | 0 |
| D | 0 | 26309 | 0 |
| Mode M9 | |||
|---|---|---|---|
| Quadrant | BADHDUFLAG | Total packets | Discarded packets |
| A | 0 | 12 | 0 |
| B | 0 | 12 | 0 |
| C | 0 | 12 | 0 |
| D | 0 | 12 | 0 |
| Mode SS | |||
|---|---|---|---|
| Quadrant | BADHDUFLAG | Total packets | Discarded packets |
| A | 0 | 126 | 0 |
| B | 0 | 126 | 0 |
| C | 0 | 126 | 0 |
| D | 0 | 126 | 0 |
| Quadrant | Total seconds | Saturated seconds | Saturation percentage |
|---|---|---|---|
| A | 6167 | 47 | 0.762121% |
| B | 6167 | 58 | 0.940490% |
| C | 6166 | 48 | 0.778463% |
| D | 6166 | 26 | 0.421667% |
Noise dominated data is calculated using 1-second bins in cleaned event files. If a bin has >2000 counts, and if more than 50% of those come from <1% of pixels, then it is considered to be noise-dominated and hence unusable.
| Quadrant | # 1 sec bins | Bins with >0 counts | Bins with >2000 counts | High rate bins dominated by noise | Noise dominated (total time) | Noise dominated (detector-on time) | Marked lightcurve |
|---|---|---|---|---|---|---|---|
| A | 7372 | 6168 | 265 | 265 | 3.59% | 4.30% | 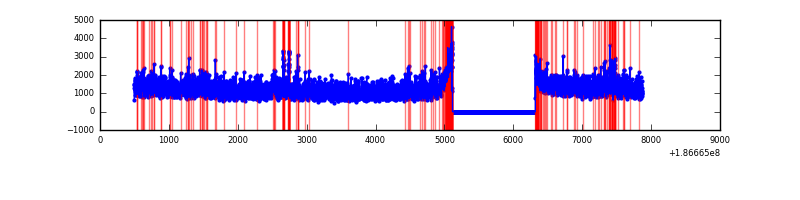 |
| B | 7372 | 6168 | 281 | 281 | 3.81% | 4.56% | 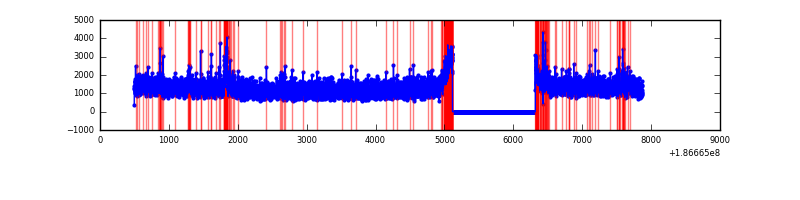 |
| C | 7371 | 6167 | 366 | 366 | 4.97% | 5.93% | 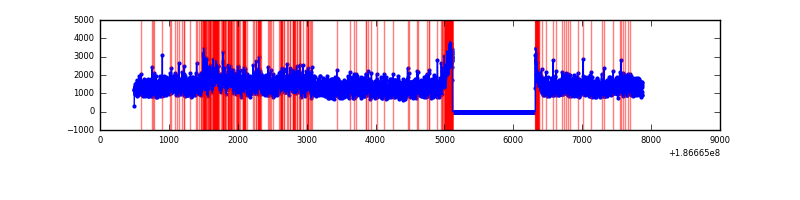 |
| D | 7371 | 6167 | 207 | 207 | 2.81% | 3.36% | 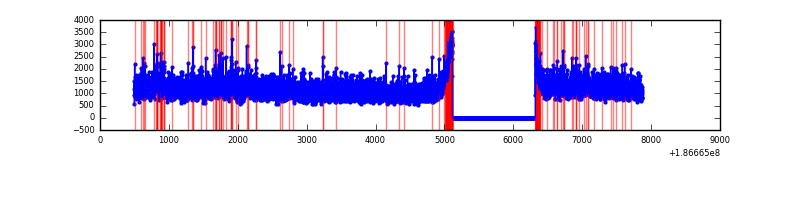 |
Top three noisy pixels from each quadrant. If the there are fewer than three noisy pixels in the level2.evt file, extra rows are filled as -1
| Pixel properties | Quadrant properties | ||||||
|---|---|---|---|---|---|---|---|
| Quadrant | DetID | PixID | Counts | Sigma | Mean | Median | Sigma |
| A | 14 | 170 | 180693 | 388.42 | 1932 | 1944 | 460.2 |
| A | 15 | 233 | 79085 | 167.63 | 1932 | 1944 | 460.2 |
| A | 11 | 79 | 8805 | 14.91 | 1932 | 1944 | 460.2 |
| B | 5 | 63 | 69047 | 145.34 | 1987 | 1994 | 461.4 |
| B | 8 | 234 | 68839 | 144.89 | 1987 | 1994 | 461.4 |
| B | 0 | 220 | 56526 | 118.2 | 1987 | 1994 | 461.4 |
| C | 10 | 34 | 1014845 | 2009.32 | 1831 | 1890 | 504.1 |
| C | 15 | 241 | 291093 | 573.67 | 1831 | 1890 | 504.1 |
| C | 9 | 52 | 42173 | 79.91 | 1831 | 1890 | 504.1 |
| D | 1 | 4 | 496988 | 910.16 | 1801 | 1865 | 544.0 |
| D | 13 | 169 | 51527 | 91.29 | 1801 | 1865 | 544.0 |
| D | 13 | 73 | 45198 | 79.66 | 1801 | 1865 | 544.0 |
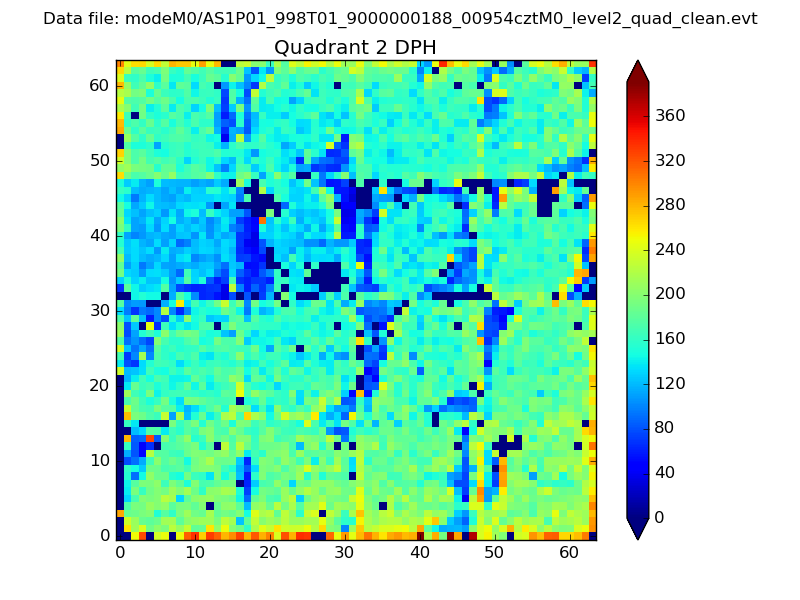
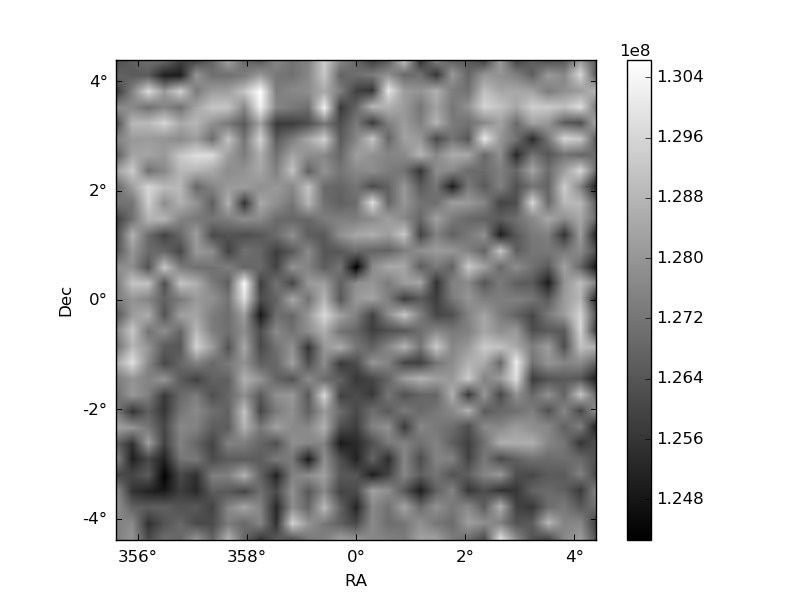
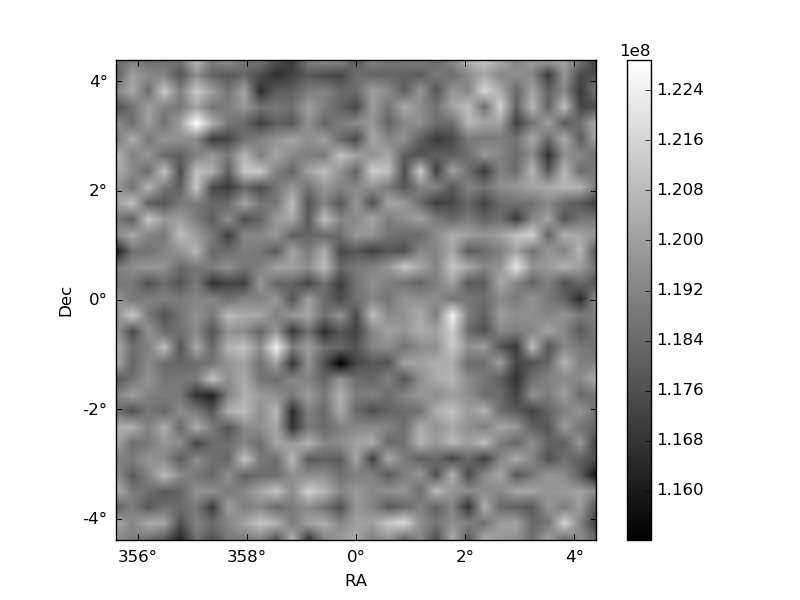
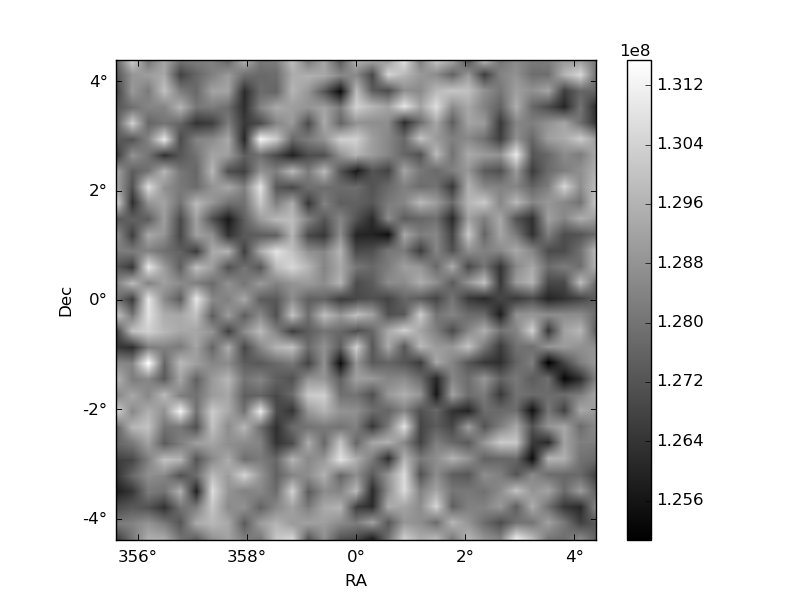
Histogram calculated using DETX and DETY for each event in the final _common_clean file
| Quadrant A | 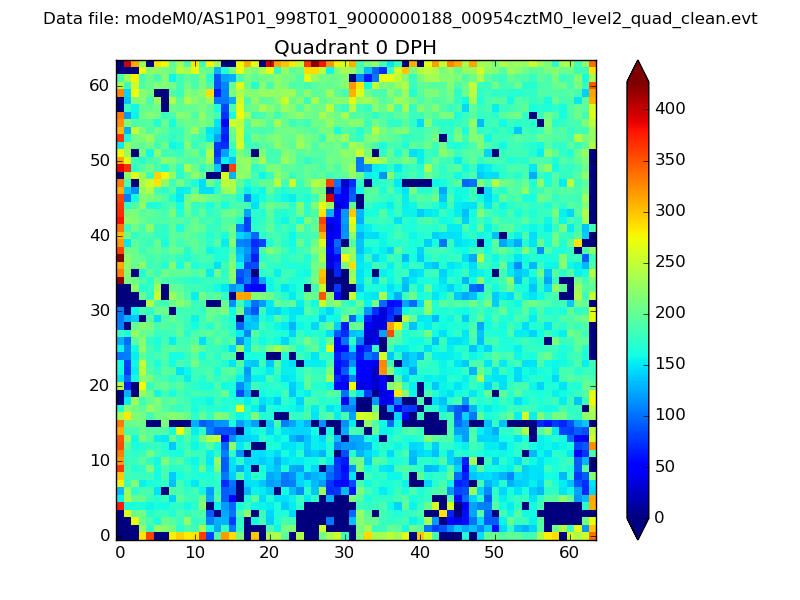 |
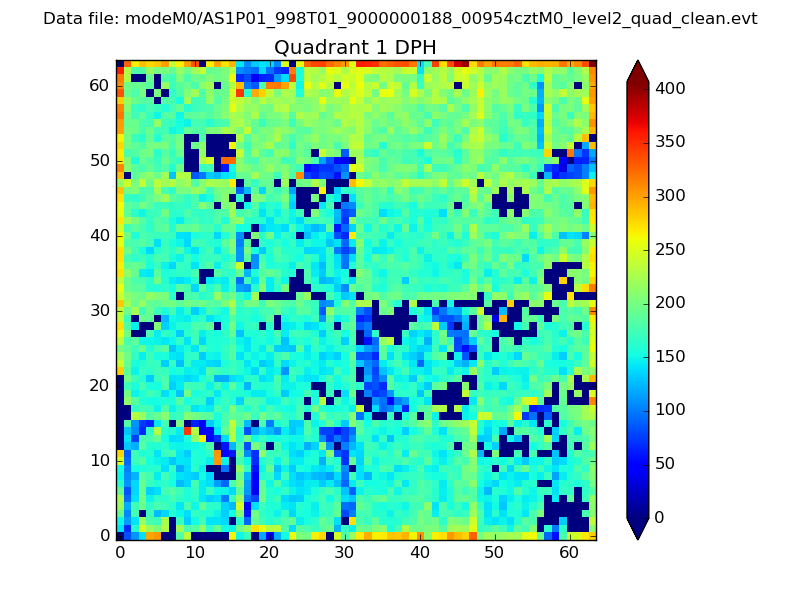 |
Quadrant B |
|---|---|---|---|
| Quadrant D | 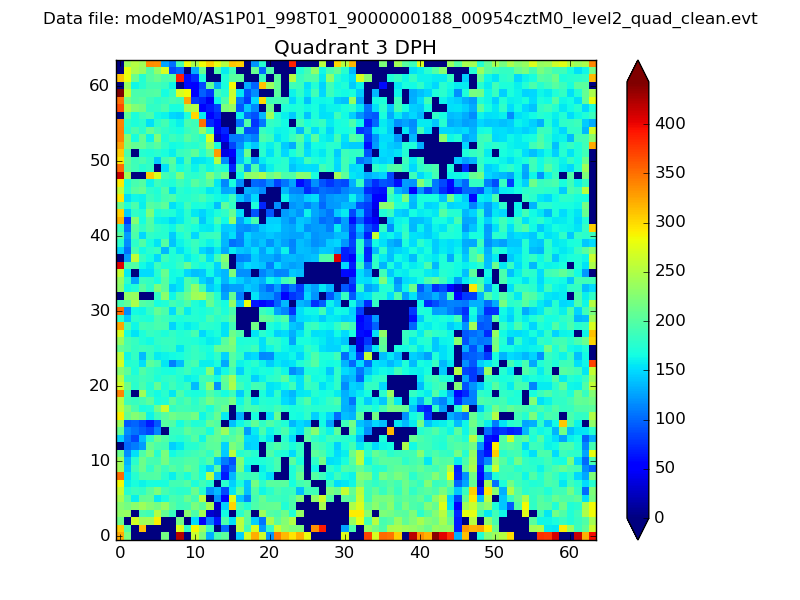 |
 |
Quadrant C |
| Plot type | Count rate plots | Images |
|---|---|---|
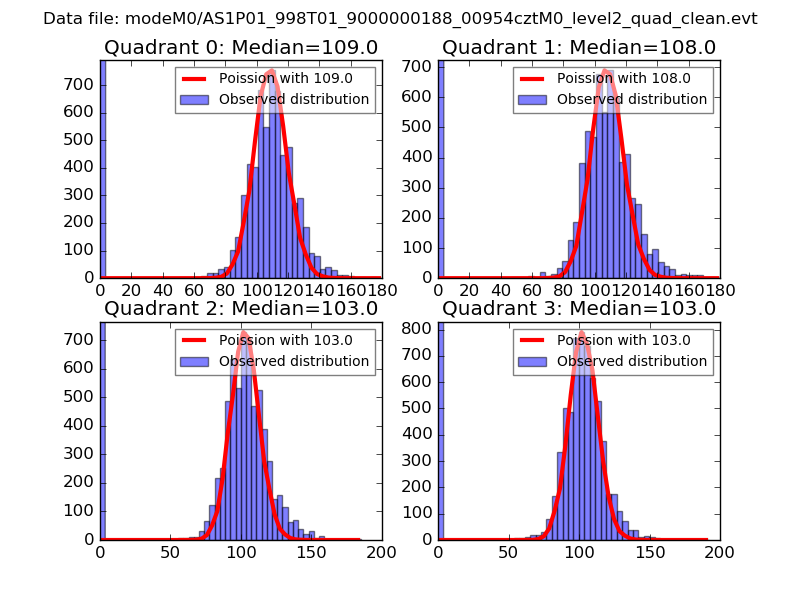
| Comparison with Poisson distribution Blue bars denote a histogram of data divided into 1 sec bins. Red curve is a Poisson curve with rate = median count rate of data. |
 |
 |
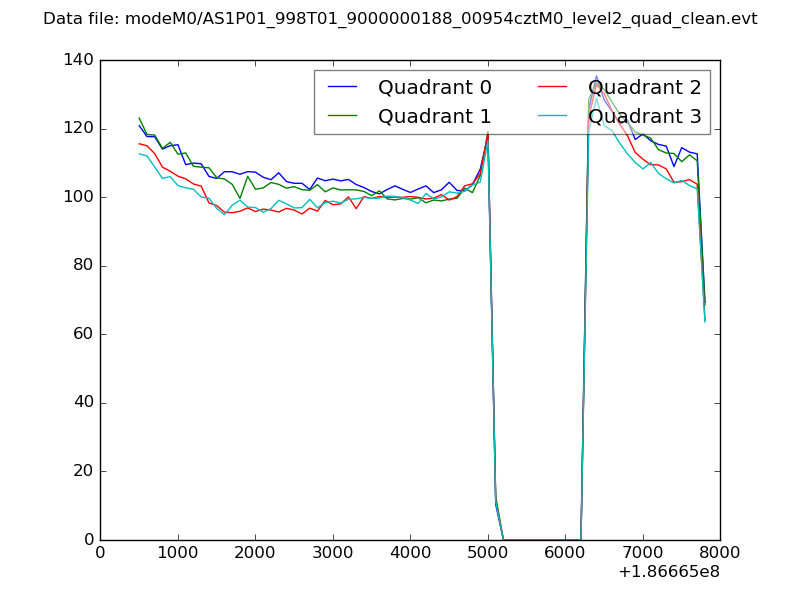
| Quadrant-wise count rates Data is divided into 100 sec bins |
 |
|
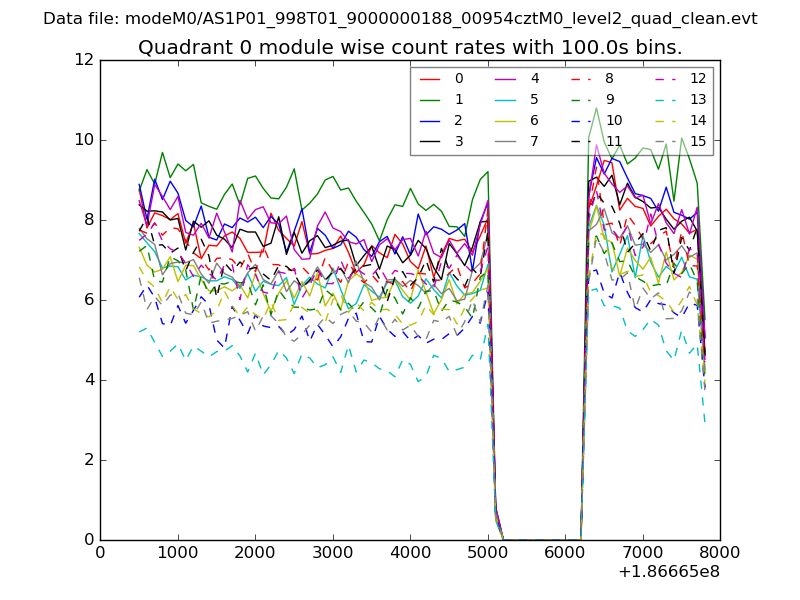
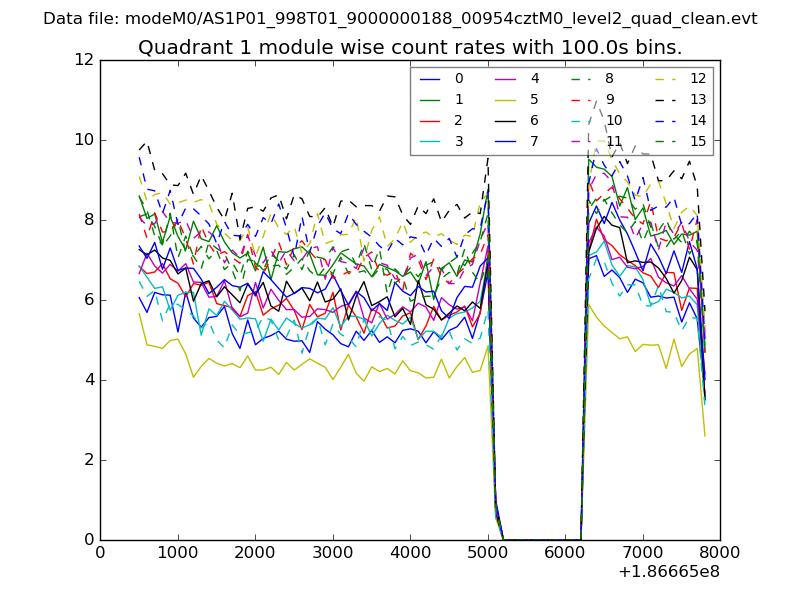
| Module-wise count rates for Quadrant A Data is divided into 100 sec bins |
 |
 |
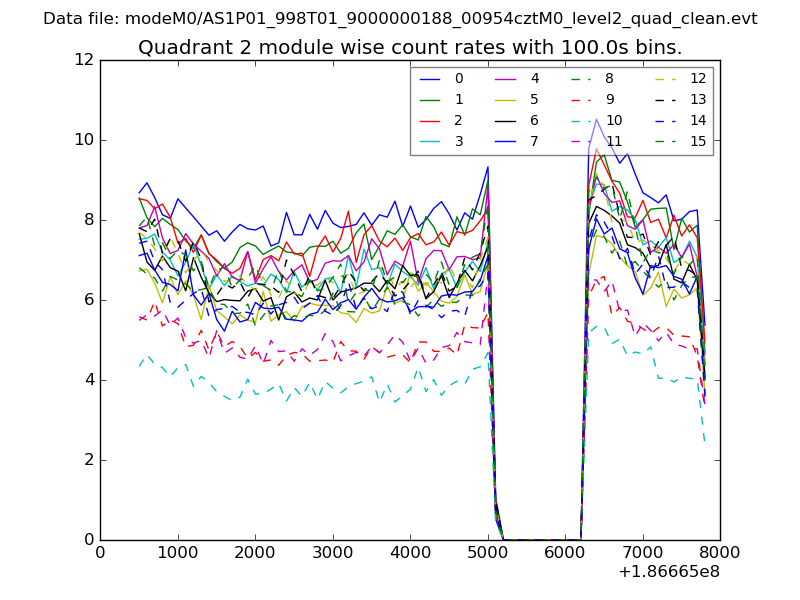
| Module-wise count rates for Quadrant B Data is divided into 100 sec bins |
 |
 |
| Module-wise count rates for Quadrant C Data is divided into 100 sec bins |
 |
 |
| Module-wise count rates for Quadrant D Data is divided into 100 sec bins |
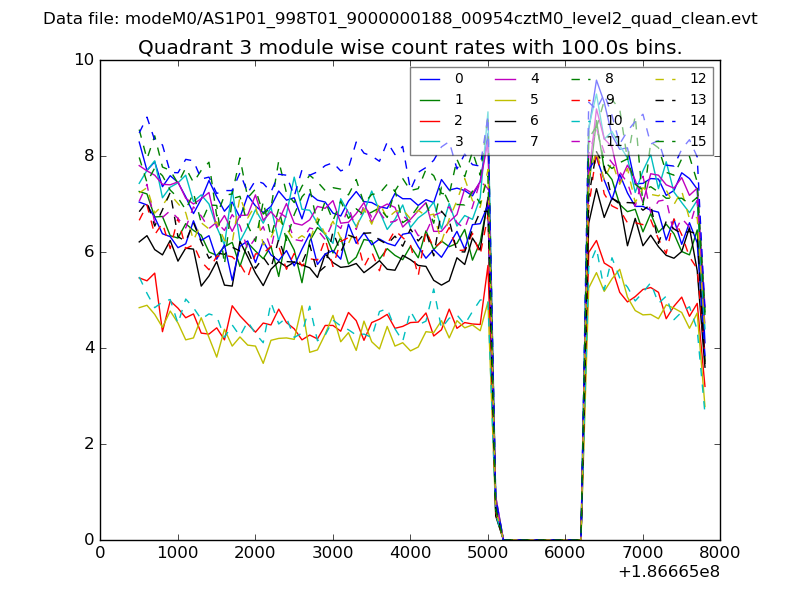 |
 |
| Parameter | Plot |
|---|---|
| CZT HV Monitor | 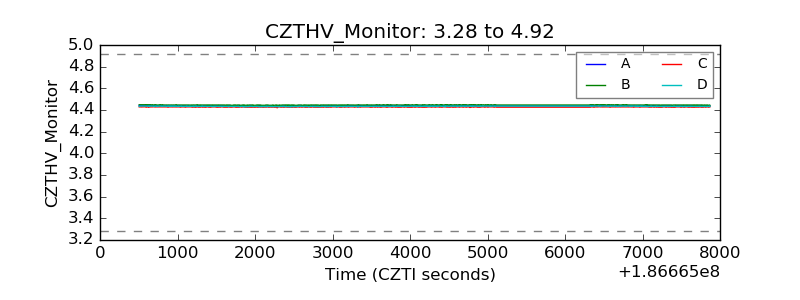 |
| D_VDD | 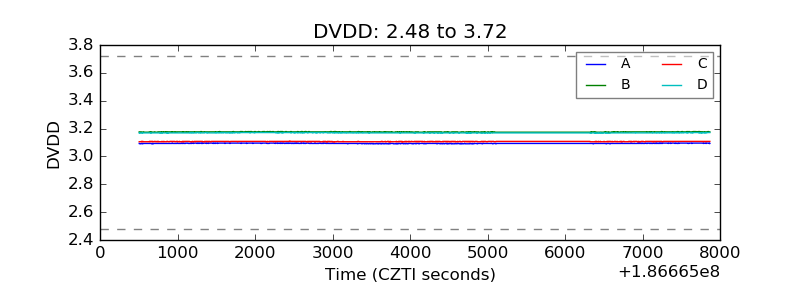 |
| Temperature 1 | 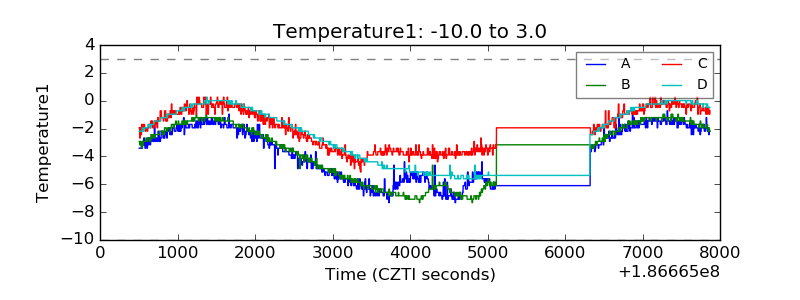 |
| Veto HV Monitor | 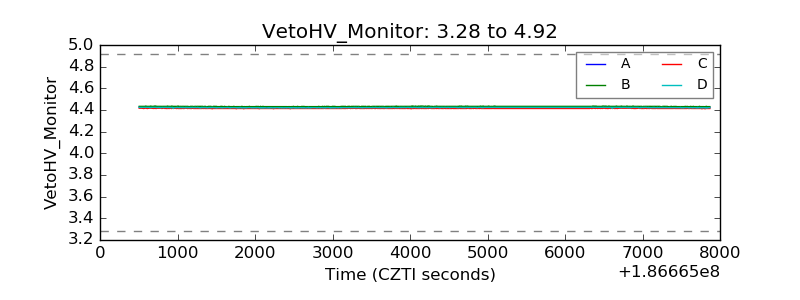 |
| Veto LLD | 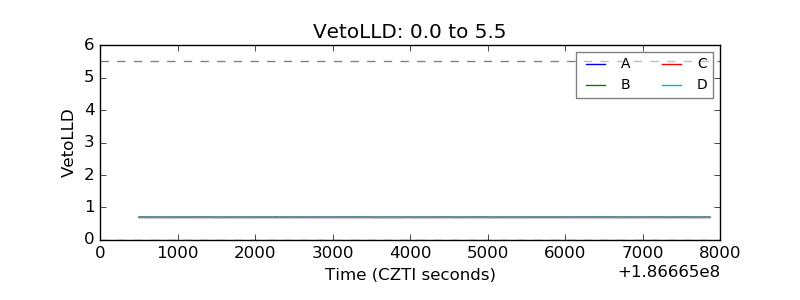 |
| Alpha Counter | 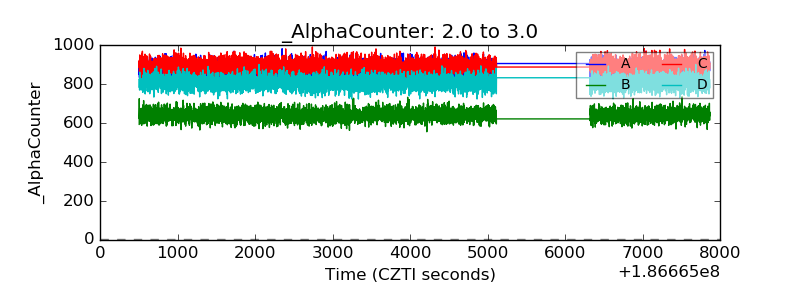 |
| _CPM_Rate | 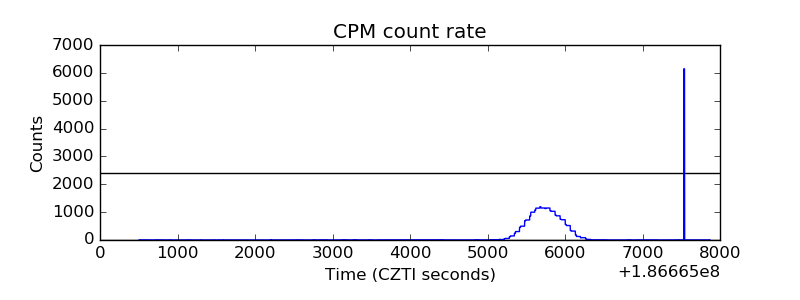 |
| CZT Counter | 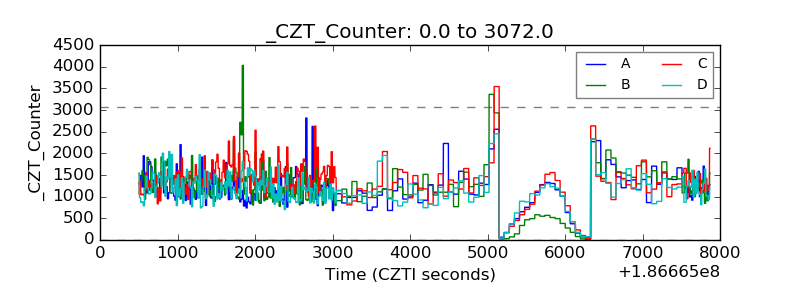 |
| +2.5 Volts monitor |  |
| +5 Volts monitor |  |
| _ROLL_ROT | 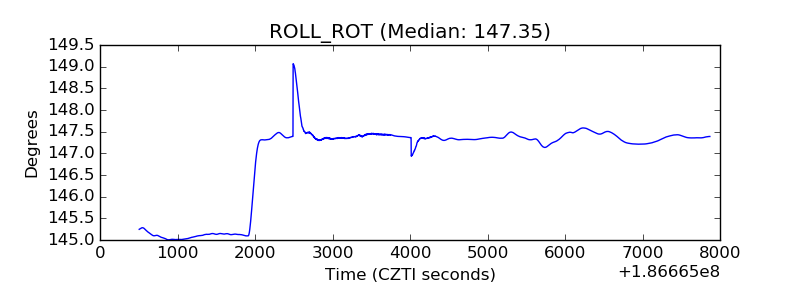 |
| _Roll_DEC | 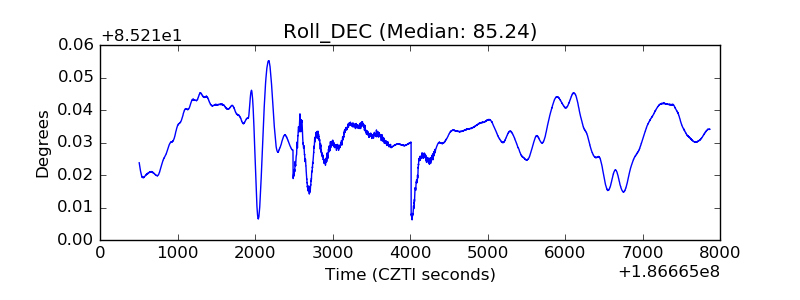 |
| _Roll_RA | 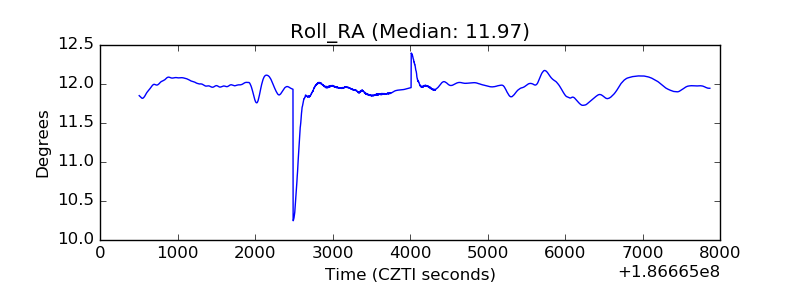 |
| Veto Counter | 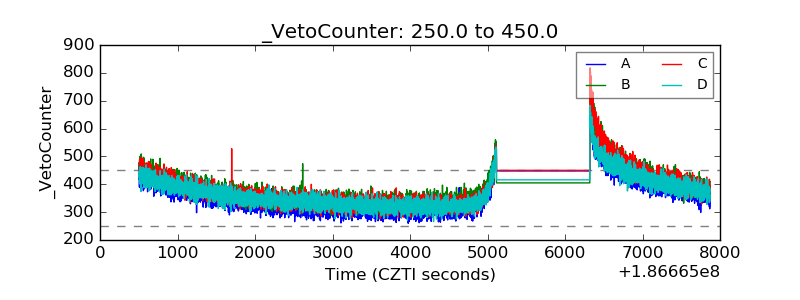 |