| Param | Original file | Final file |
|---|---|---|
| Filename | modeM0/AS1P01_998T01_9000000188_00955cztM0_level2.evt | modeM0/AS1P01_998T01_9000000188_00955cztM0_level2_quad_clean.evt |
| Size (bytes) | 946,569,600 | 92,609,280 |
| Size | 902.7 MB | 88.3 MB |
| Events in quadrant A | 6,794,447 | 617,879 |
| Events in quadrant B | 7,381,878 | 610,888 |
| Events in quadrant C | 7,352,685 | 594,186 |
| Events in quadrant D | 6,761,974 | 585,077 |
| Mode M0 | |||
|---|---|---|---|
| Quadrant | BADHDUFLAG | Total packets | Discarded packets |
| A | 0 | 24222 | 0 |
| B | 0 | 25942 | 0 |
| C | 0 | 25885 | 0 |
| D | 0 | 24066 | 0 |
| Mode M9 | |||
|---|---|---|---|
| Quadrant | BADHDUFLAG | Total packets | Discarded packets |
| A | 0 | 12 | 0 |
| B | 0 | 12 | 0 |
| C | 0 | 12 | 0 |
| D | 0 | 12 | 0 |
| Mode SS | |||
|---|---|---|---|
| Quadrant | BADHDUFLAG | Total packets | Discarded packets |
| A | 0 | 116 | 0 |
| B | 0 | 116 | 0 |
| C | 0 | 116 | 0 |
| D | 0 | 116 | 0 |
| Quadrant | Total seconds | Saturated seconds | Saturation percentage |
|---|---|---|---|
| A | 5669 | 54 | 0.952549% |
| B | 5669 | 65 | 1.146587% |
| C | 5669 | 53 | 0.934909% |
| D | 5669 | 38 | 0.670312% |
Noise dominated data is calculated using 1-second bins in cleaned event files. If a bin has >2000 counts, and if more than 50% of those come from <1% of pixels, then it is considered to be noise-dominated and hence unusable.
| Quadrant | # 1 sec bins | Bins with >0 counts | Bins with >2000 counts | High rate bins dominated by noise | Noise dominated (total time) | Noise dominated (detector-on time) | Marked lightcurve |
|---|---|---|---|---|---|---|---|
| A | 6894 | 5670 | 233 | 233 | 3.38% | 4.11% | 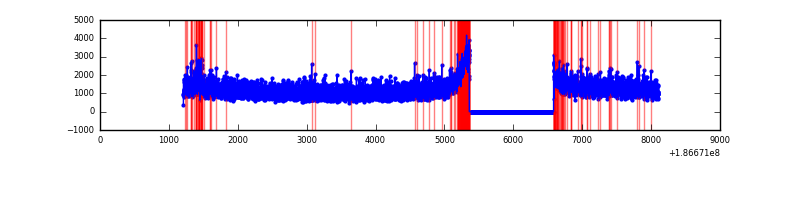 |
| B | 6894 | 5670 | 289 | 289 | 4.19% | 5.10% | 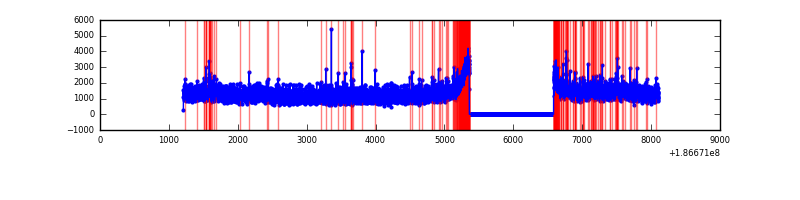 |
| C | 6894 | 5670 | 241 | 241 | 3.50% | 4.25% | 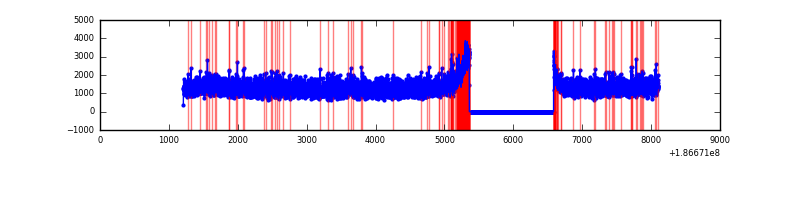 |
| D | 6894 | 5670 | 203 | 203 | 2.94% | 3.58% | 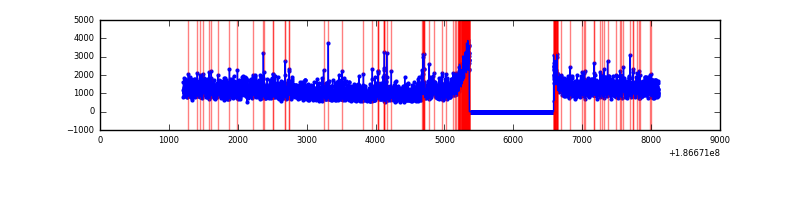 |
Top three noisy pixels from each quadrant. If the there are fewer than three noisy pixels in the level2.evt file, extra rows are filled as -1
| Pixel properties | Quadrant properties | ||||||
|---|---|---|---|---|---|---|---|
| Quadrant | DetID | PixID | Counts | Sigma | Mean | Median | Sigma |
| A | 15 | 233 | 61515 | 143.69 | 1753 | 1760 | 415.9 |
| A | 11 | 79 | 6795 | 12.11 | 1753 | 1760 | 415.9 |
| A | 14 | 170 | 6362 | 11.06 | 1753 | 1760 | 415.9 |
| B | 7 | 221 | 110042 | 254.07 | 1824 | 1826 | 425.9 |
| B | 0 | 220 | 96149 | 221.45 | 1824 | 1826 | 425.9 |
| B | 4 | 232 | 48649 | 109.93 | 1824 | 1826 | 425.9 |
| C | 10 | 34 | 335525 | 708.23 | 1704 | 1762 | 471.3 |
| C | 15 | 241 | 271837 | 573.09 | 1704 | 1762 | 471.3 |
| C | 3 | 79 | 33053 | 66.4 | 1704 | 1762 | 471.3 |
| D | 1 | 4 | 283302 | 562.42 | 1646 | 1703 | 500.7 |
| D | 13 | 169 | 113564 | 223.41 | 1646 | 1703 | 500.7 |
| D | 0 | 255 | 69572 | 135.55 | 1646 | 1703 | 500.7 |
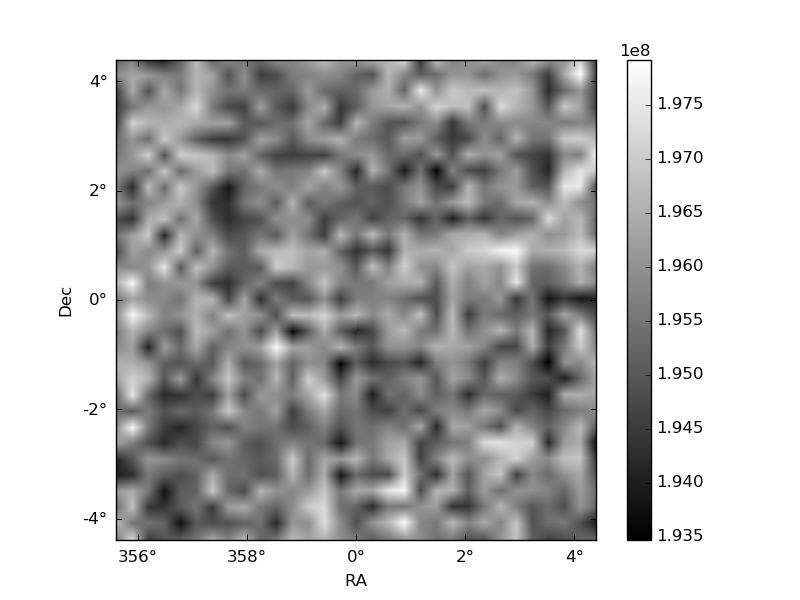
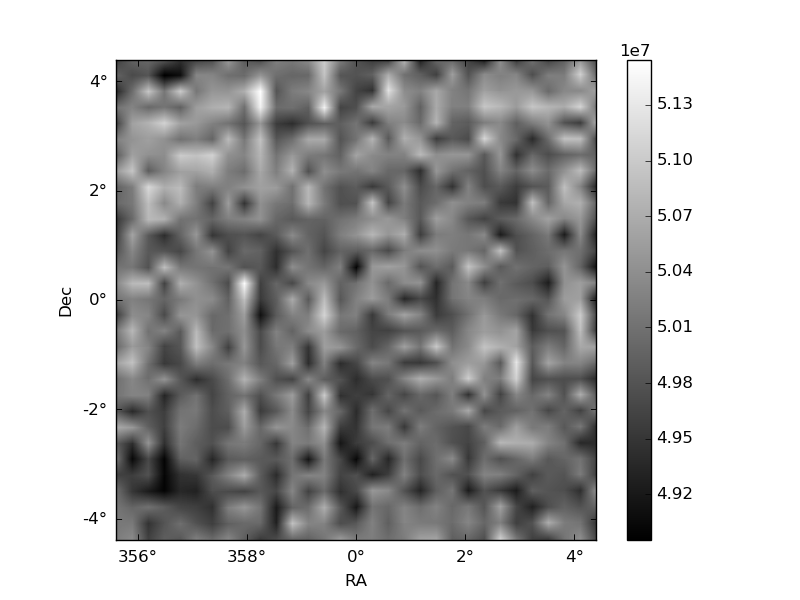
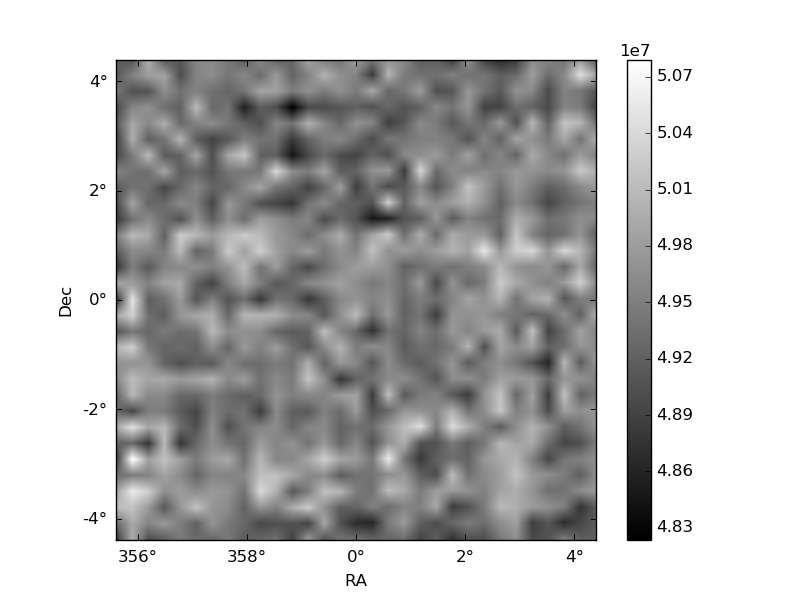
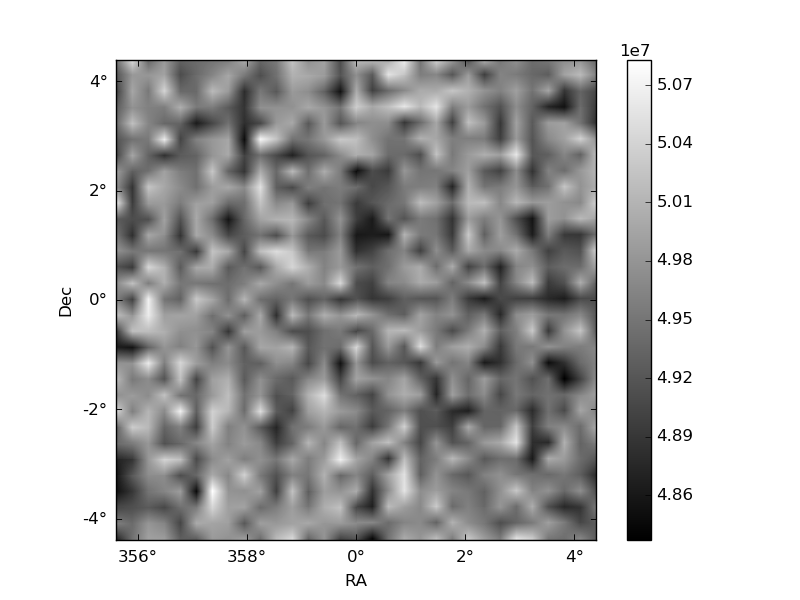
Histogram calculated using DETX and DETY for each event in the final _common_clean file
| Quadrant A | 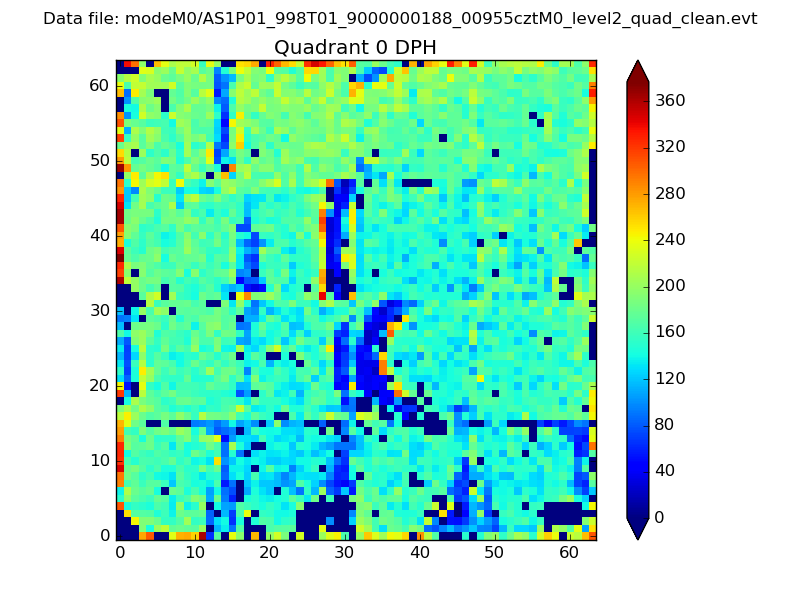 |
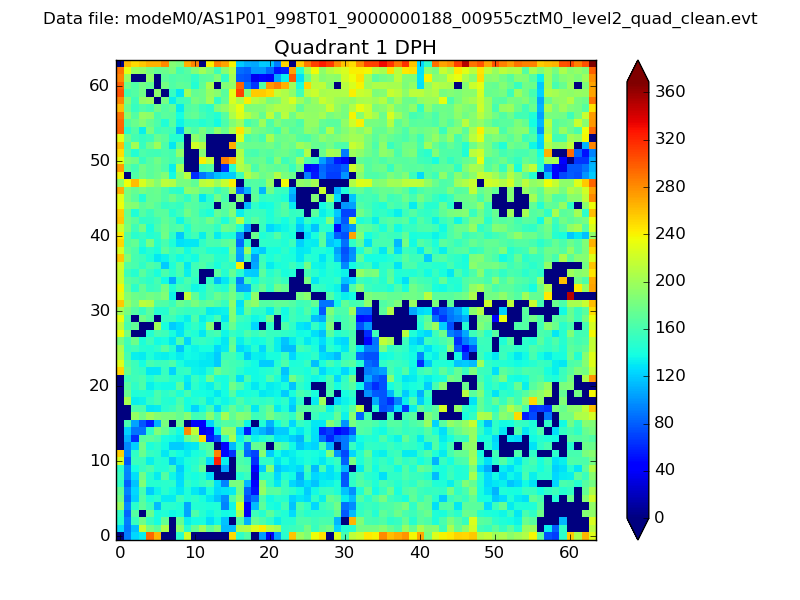 |
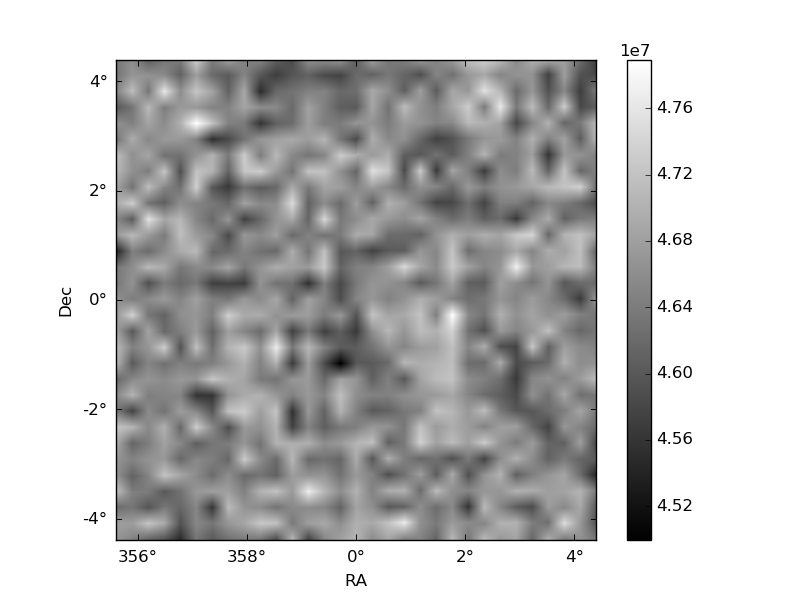
Quadrant B |
|---|---|---|---|
| Quadrant D | 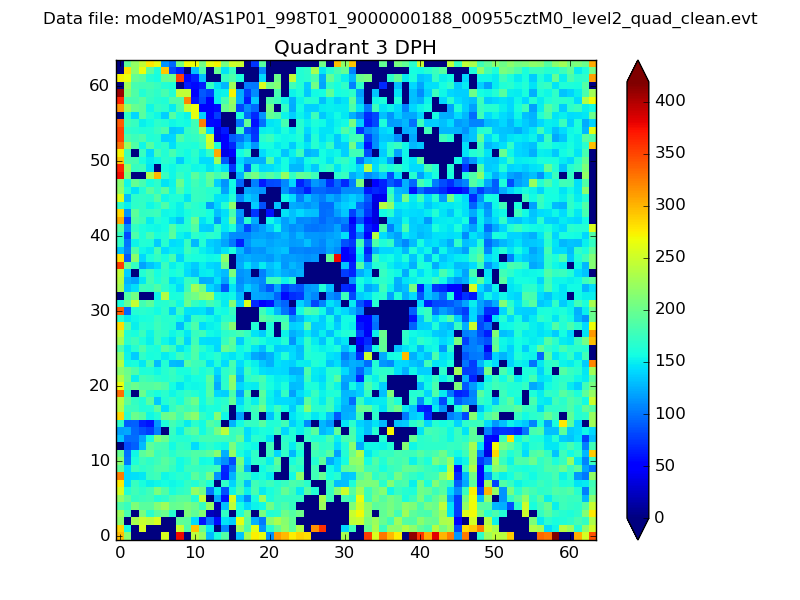 |
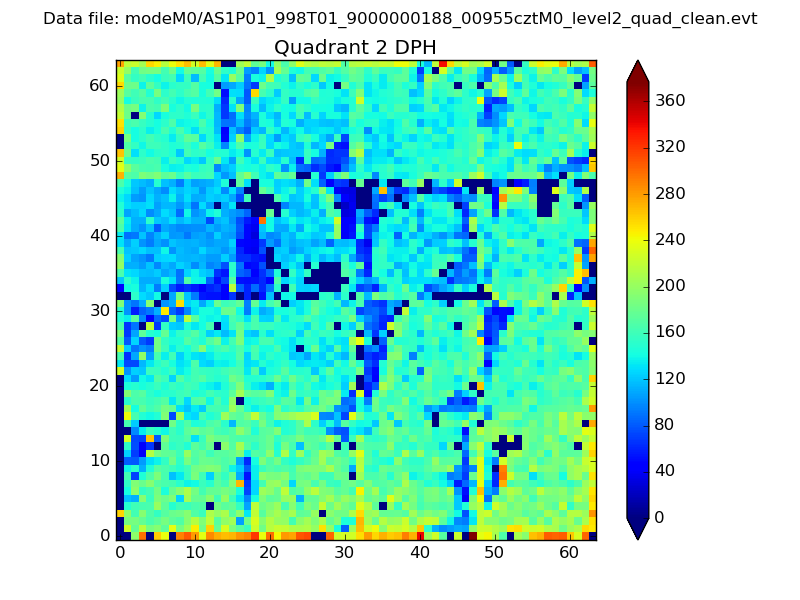 |
Quadrant C |
| Plot type | Count rate plots | Images |
|---|---|---|
| Comparison with Poisson distribution Blue bars denote a histogram of data divided into 1 sec bins. Red curve is a Poisson curve with rate = median count rate of data. |
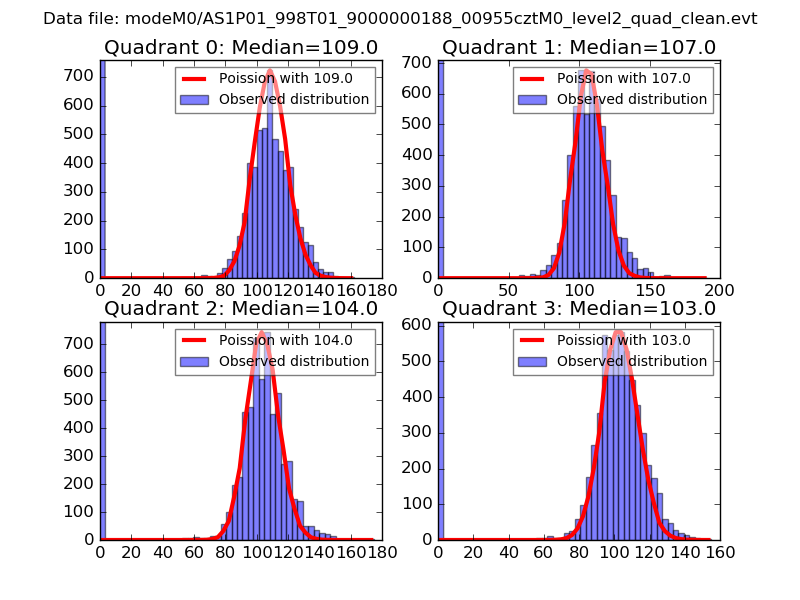 |
 |
| Quadrant-wise count rates Data is divided into 100 sec bins |
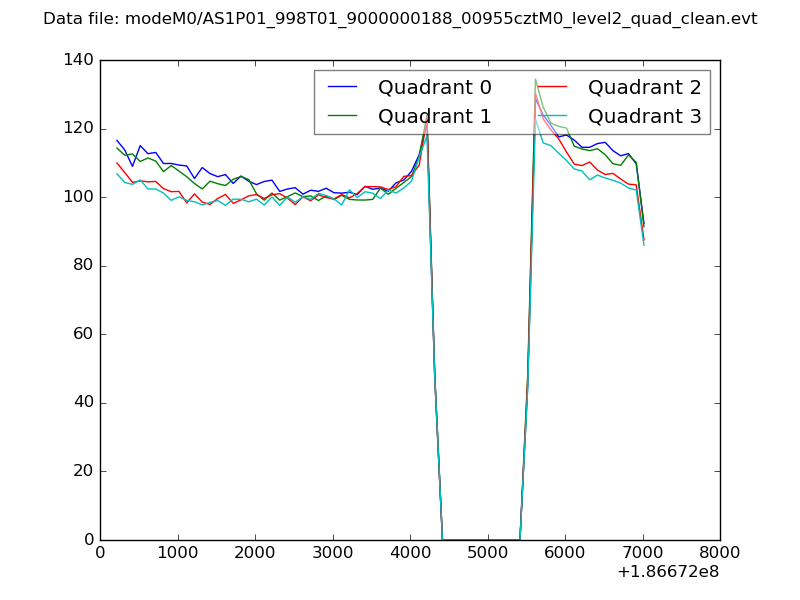 |
|
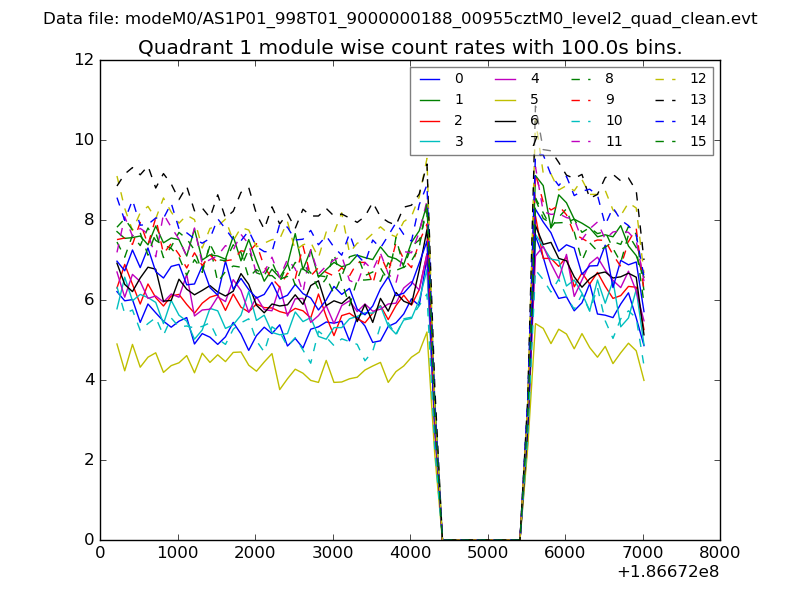
| Module-wise count rates for Quadrant A Data is divided into 100 sec bins |
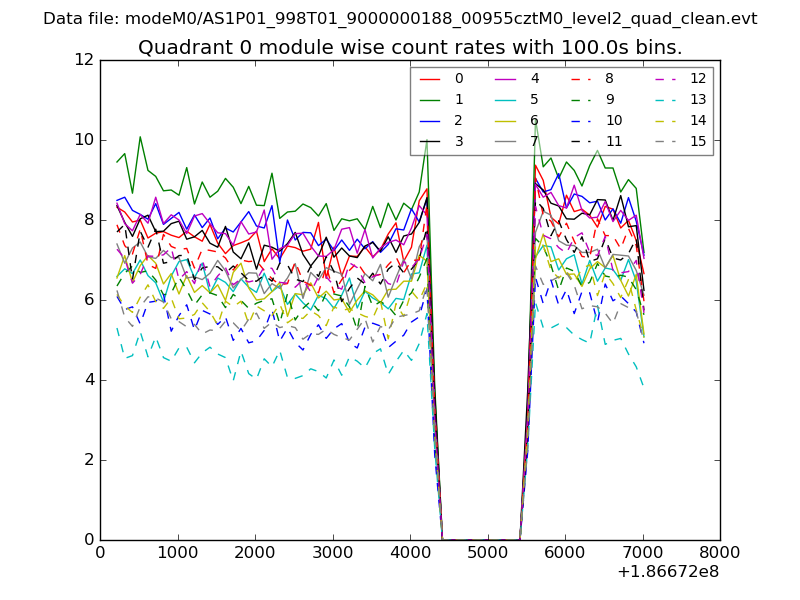 |
 |
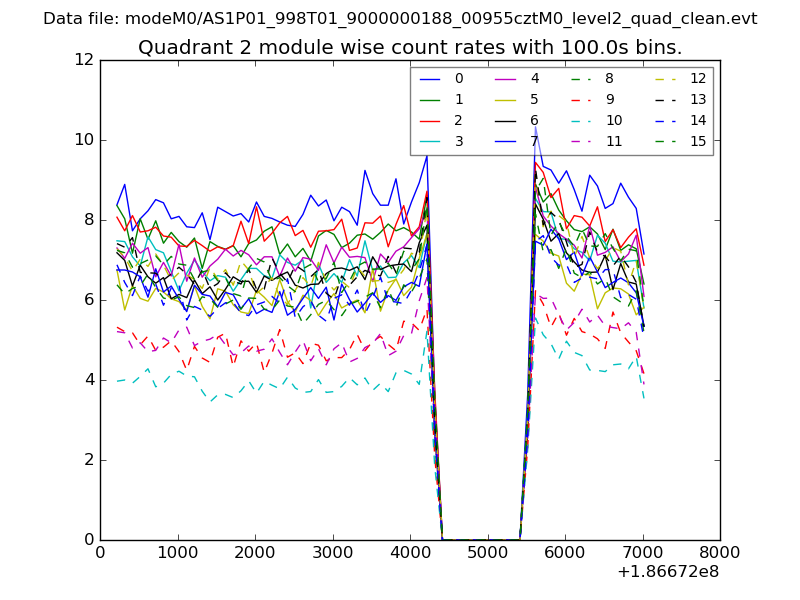
| Module-wise count rates for Quadrant B Data is divided into 100 sec bins |
 |
 |
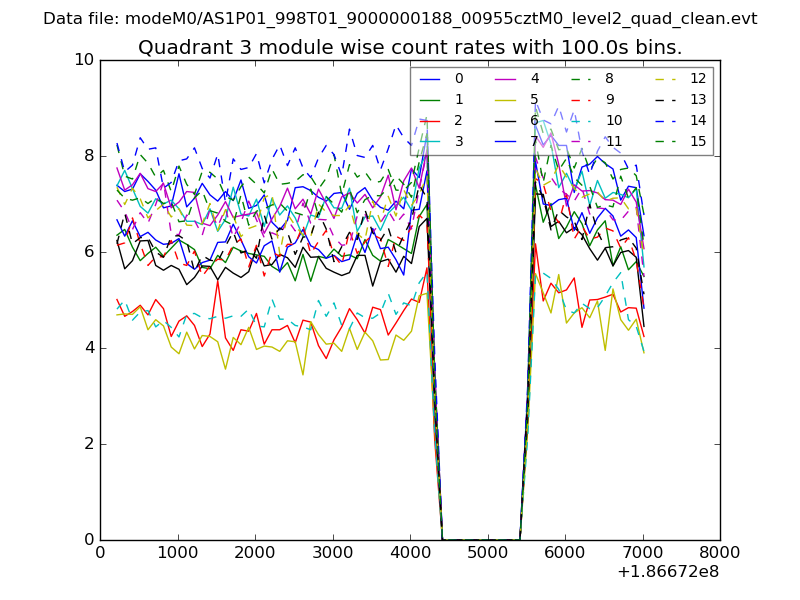
| Module-wise count rates for Quadrant C Data is divided into 100 sec bins |
 |
 |
| Module-wise count rates for Quadrant D Data is divided into 100 sec bins |
 |
 |
| Parameter | Plot |
|---|---|
| CZT HV Monitor | 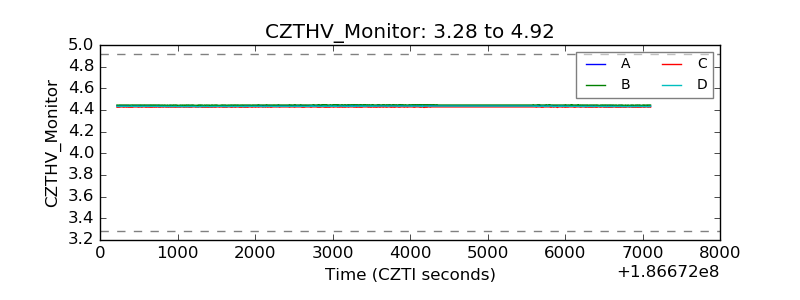 |
| D_VDD | 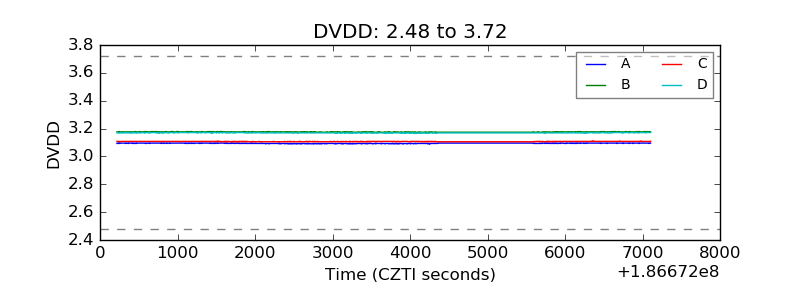 |
| Temperature 1 | 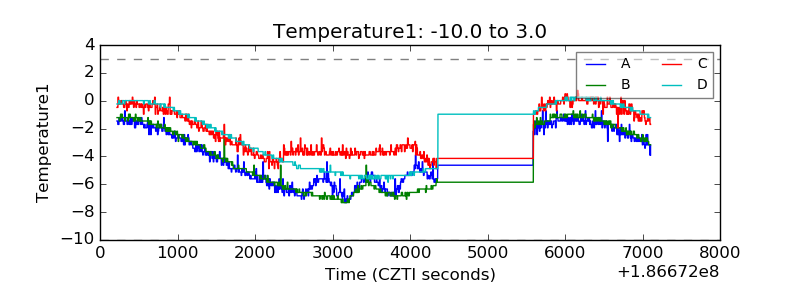 |
| Veto HV Monitor |  |
| Veto LLD | 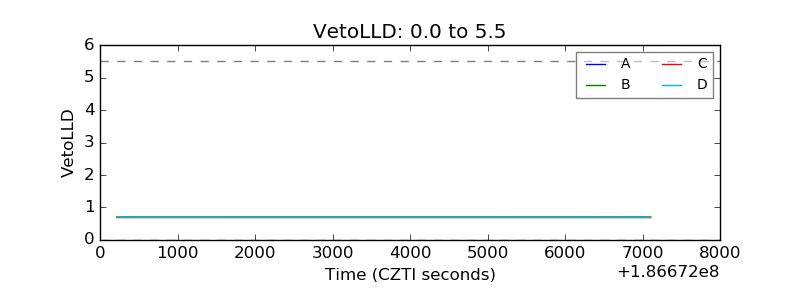 |
| Alpha Counter | 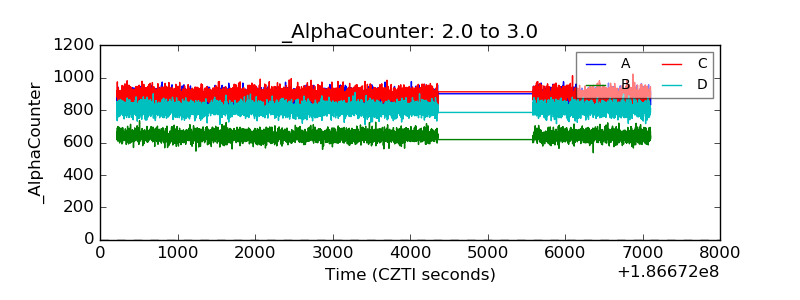 |
| _CPM_Rate | 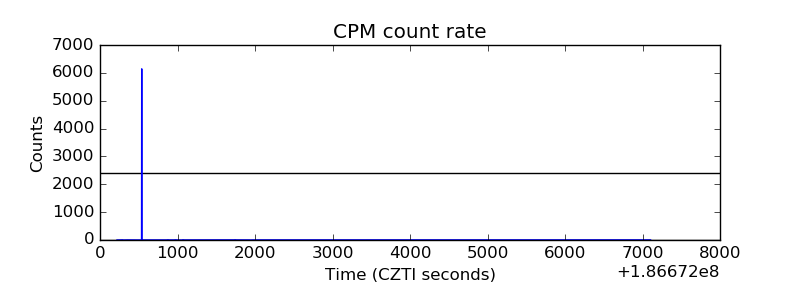 |
| CZT Counter | 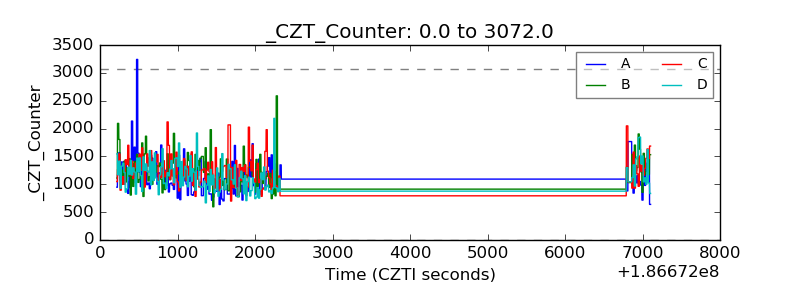 |
| +2.5 Volts monitor |  |
| +5 Volts monitor |  |
| _ROLL_ROT | 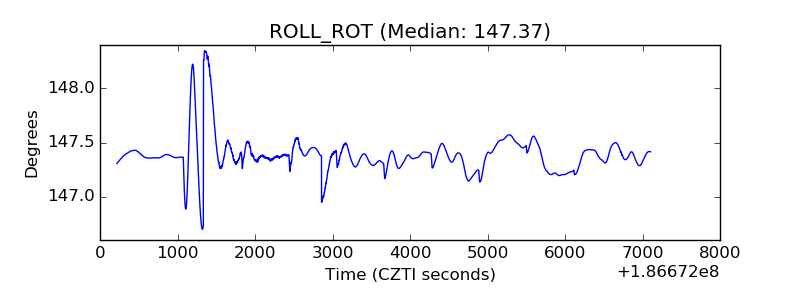 |
| _Roll_DEC | 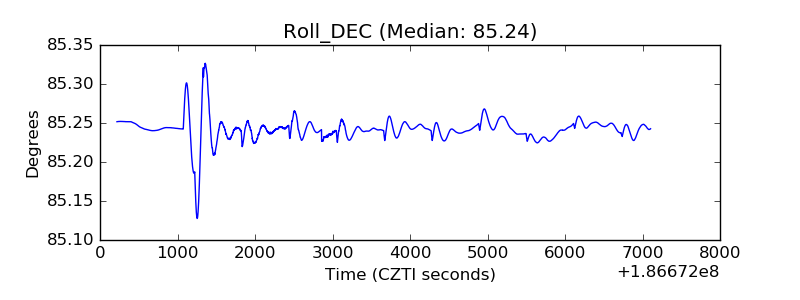 |
| _Roll_RA | 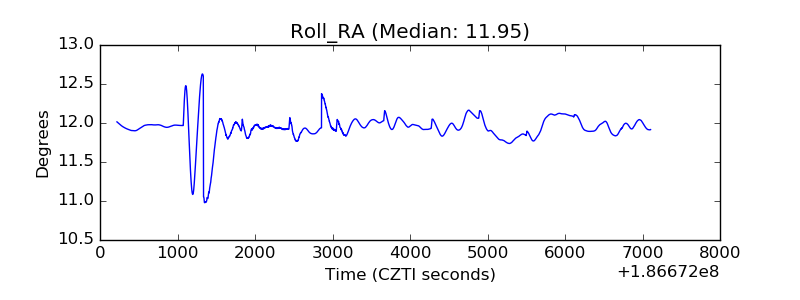 |
| Veto Counter | 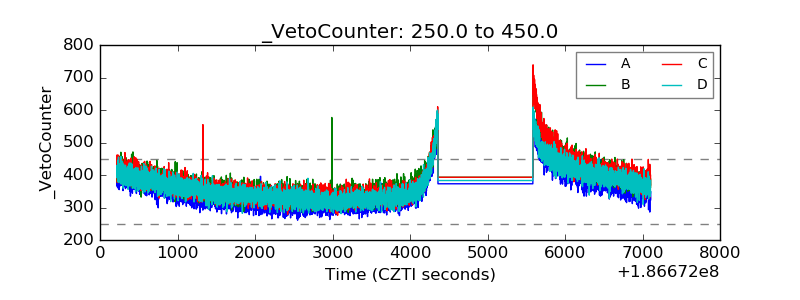 |