| Param | Original file | Final file |
|---|---|---|
| Filename | modeM0/AS1P01_998T01_9000000188_00958cztM0_level2.evt | modeM0/AS1P01_998T01_9000000188_00958cztM0_level2_quad_clean.evt |
| Size (bytes) | 1,180,811,520 | 106,790,400 |
| Size | 1.1 GB | 101.8 MB |
| Events in quadrant A | 8,416,098 | 701,516 |
| Events in quadrant B | 8,802,933 | 700,188 |
| Events in quadrant C | 9,581,200 | 677,444 |
| Events in quadrant D | 8,500,371 | 670,036 |
| Mode M0 | |||
|---|---|---|---|
| Quadrant | BADHDUFLAG | Total packets | Discarded packets |
| A | 0 | 29955 | 0 |
| B | 0 | 31074 | 0 |
| C | 0 | 33413 | 0 |
| D | 0 | 30196 | 0 |
| Mode M9 | |||
|---|---|---|---|
| Quadrant | BADHDUFLAG | Total packets | Discarded packets |
| A | 0 | 9 | 0 |
| B | 0 | 9 | 0 |
| C | 0 | 9 | 0 |
| D | 0 | 9 | 0 |
| Mode SS | |||
|---|---|---|---|
| Quadrant | BADHDUFLAG | Total packets | Discarded packets |
| A | 0 | 142 | 0 |
| B | 0 | 142 | 0 |
| C | 0 | 142 | 0 |
| D | 0 | 142 | 0 |
| Quadrant | Total seconds | Saturated seconds | Saturation percentage |
|---|---|---|---|
| A | 6961 | 28 | 0.402241% |
| B | 6961 | 35 | 0.502801% |
| C | 6961 | 24 | 0.344778% |
| D | 6960 | 94 | 1.350575% |
Noise dominated data is calculated using 1-second bins in cleaned event files. If a bin has >2000 counts, and if more than 50% of those come from <1% of pixels, then it is considered to be noise-dominated and hence unusable.
| Quadrant | # 1 sec bins | Bins with >0 counts | Bins with >2000 counts | High rate bins dominated by noise | Noise dominated (total time) | Noise dominated (detector-on time) | Marked lightcurve |
|---|---|---|---|---|---|---|---|
| A | 7601 | 6962 | 376 | 376 | 4.95% | 5.40% | 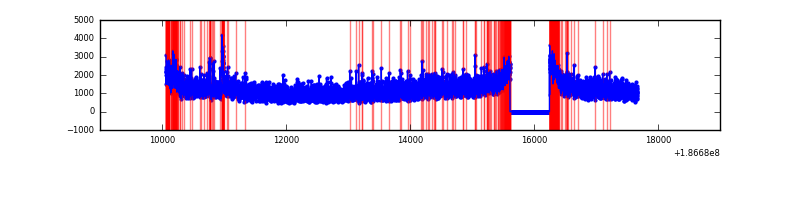 |
| B | 7601 | 6962 | 365 | 365 | 4.80% | 5.24% | 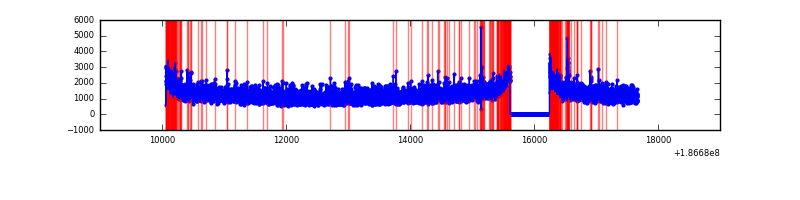 |
| C | 7601 | 6962 | 475 | 475 | 6.25% | 6.82% | 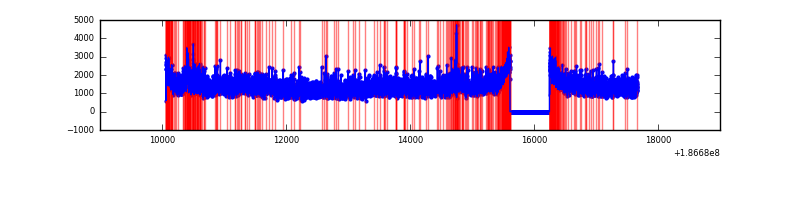 |
| D | 7600 | 6961 | 529 | 529 | 6.96% | 7.60% | 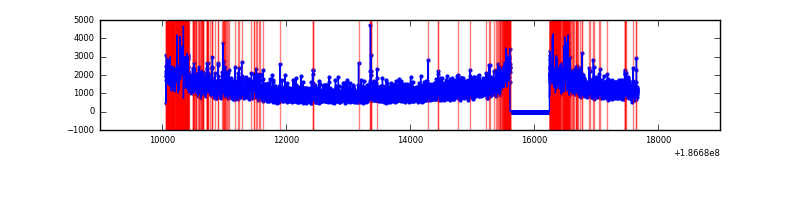 |
Top three noisy pixels from each quadrant. If the there are fewer than three noisy pixels in the level2.evt file, extra rows are filled as -1
| Pixel properties | Quadrant properties | ||||||
|---|---|---|---|---|---|---|---|
| Quadrant | DetID | PixID | Counts | Sigma | Mean | Median | Sigma |
| A | 14 | 170 | 209384 | 407.47 | 2122 | 2133 | 508.6 |
| A | 15 | 233 | 59631 | 113.04 | 2122 | 2133 | 508.6 |
| A | 0 | 253 | 7884 | 11.31 | 2122 | 2133 | 508.6 |
| B | 0 | 220 | 54520 | 100.34 | 2228 | 2235 | 521.1 |
| B | 8 | 234 | 50294 | 92.23 | 2228 | 2235 | 521.1 |
| B | 3 | 32 | 46394 | 84.74 | 2228 | 2235 | 521.1 |
| C | 10 | 34 | 697223 | 1204.97 | 2075 | 2147 | 576.8 |
| C | 15 | 241 | 318676 | 548.73 | 2075 | 2147 | 576.8 |
| C | 9 | 144 | 174850 | 299.39 | 2075 | 2147 | 576.8 |
| D | 1 | 4 | 638899 | 1039.01 | 1989 | 2057 | 612.9 |
| D | 7 | 222 | 137792 | 221.45 | 1989 | 2057 | 612.9 |
| D | 13 | 252 | 131961 | 211.94 | 1989 | 2057 | 612.9 |
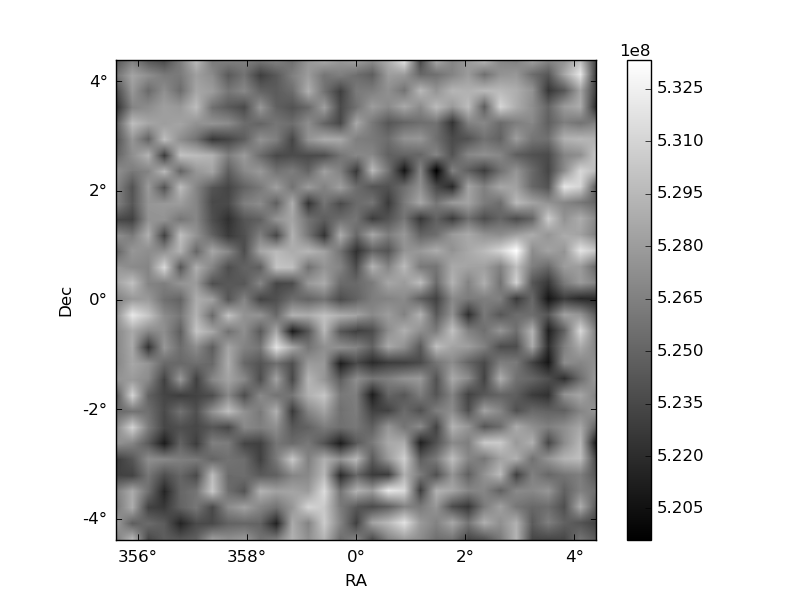
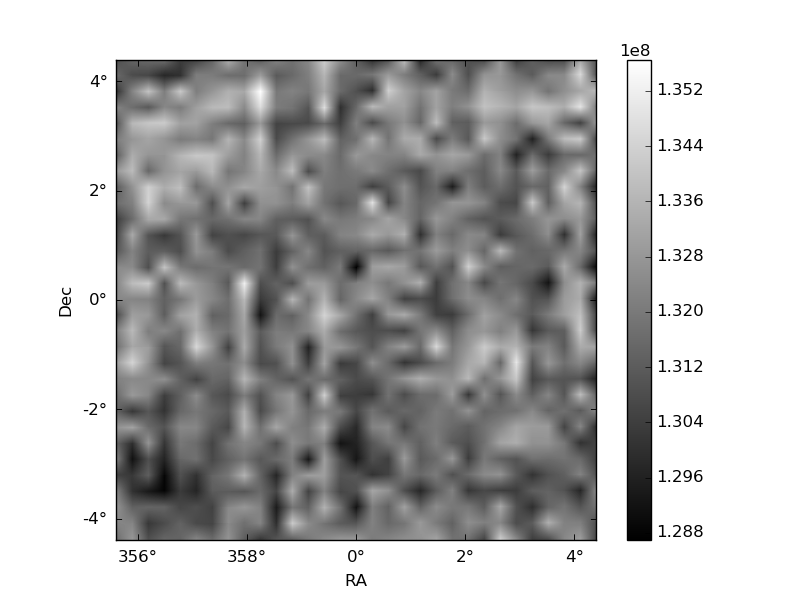
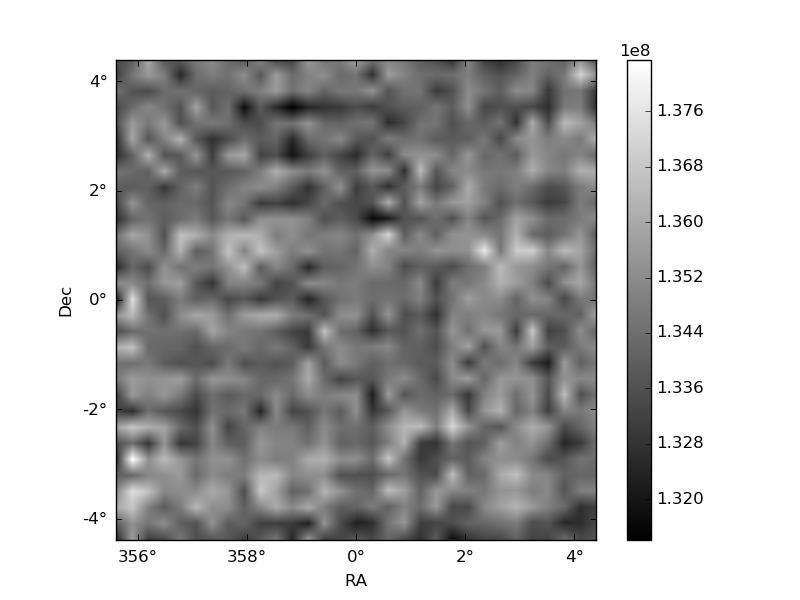
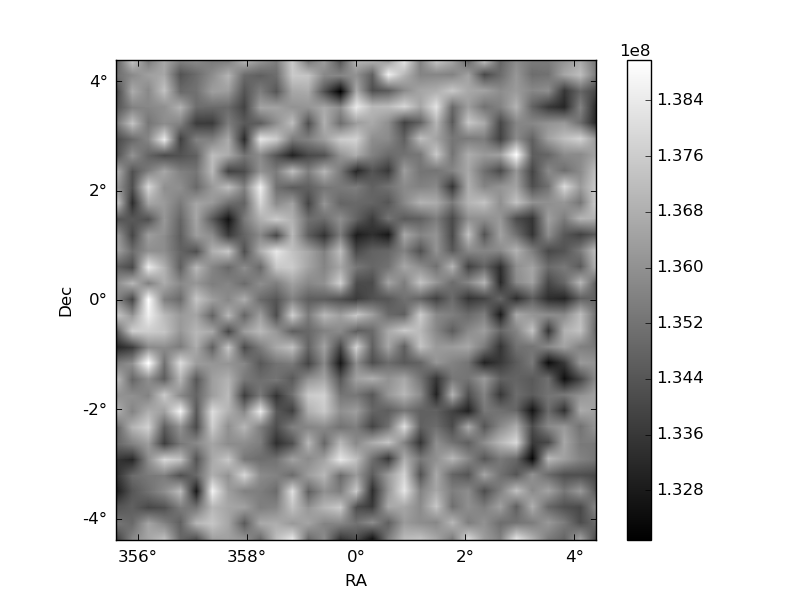
Histogram calculated using DETX and DETY for each event in the final _common_clean file
| Quadrant A | 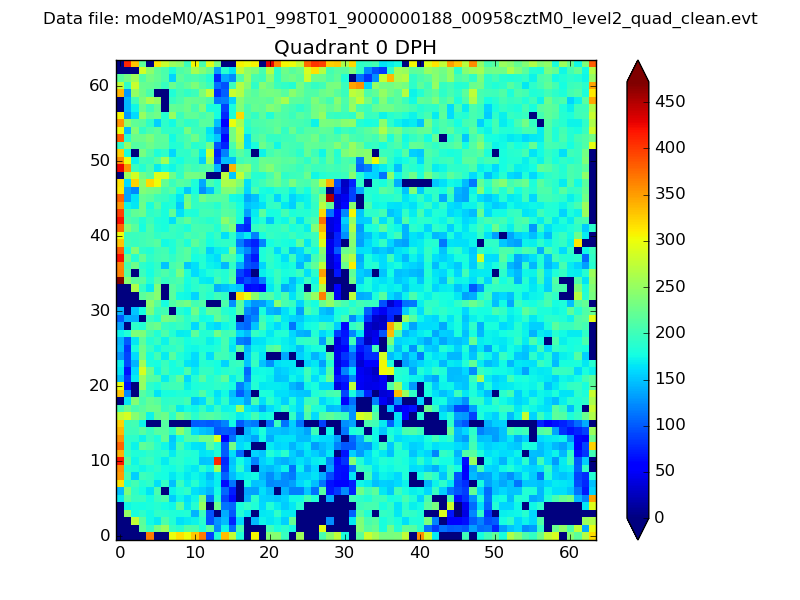 |
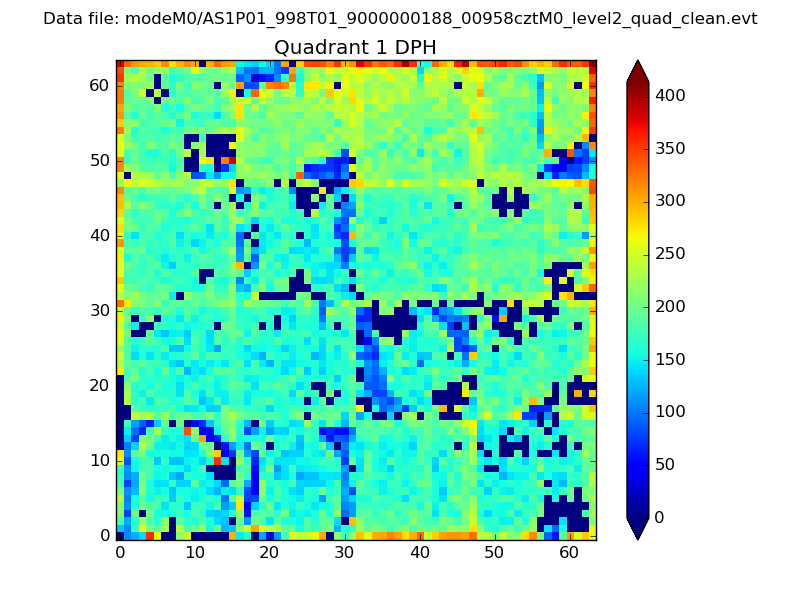 |
Quadrant B |
|---|---|---|---|
| Quadrant D | 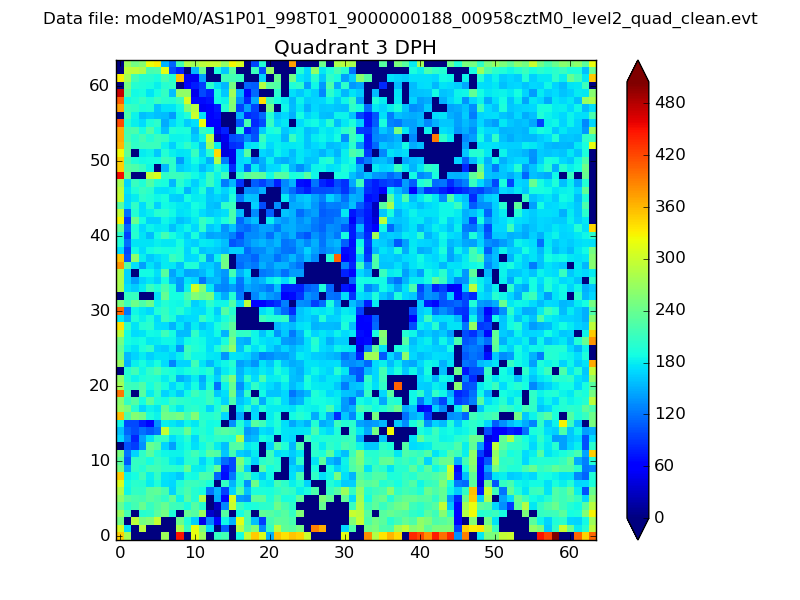 |
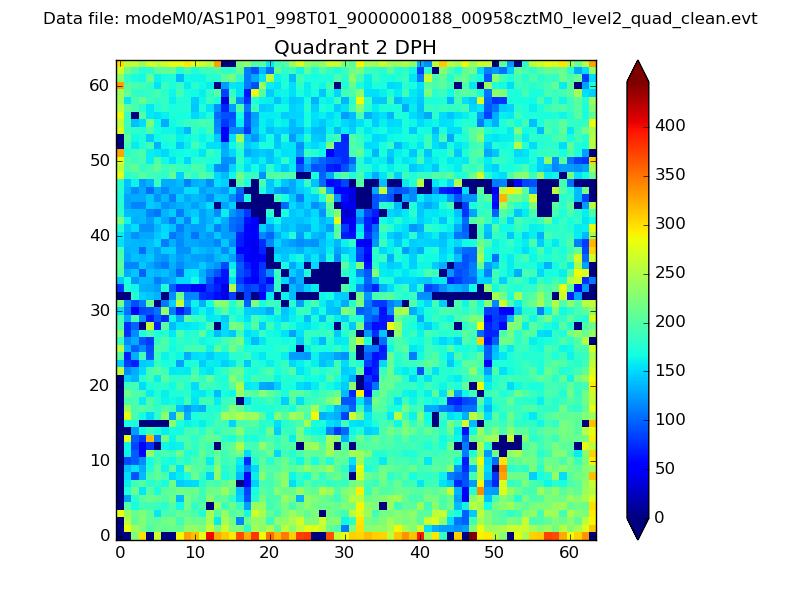 |
Quadrant C |
| Plot type | Count rate plots | Images |
|---|---|---|
| Comparison with Poisson distribution Blue bars denote a histogram of data divided into 1 sec bins. Red curve is a Poisson curve with rate = median count rate of data. |
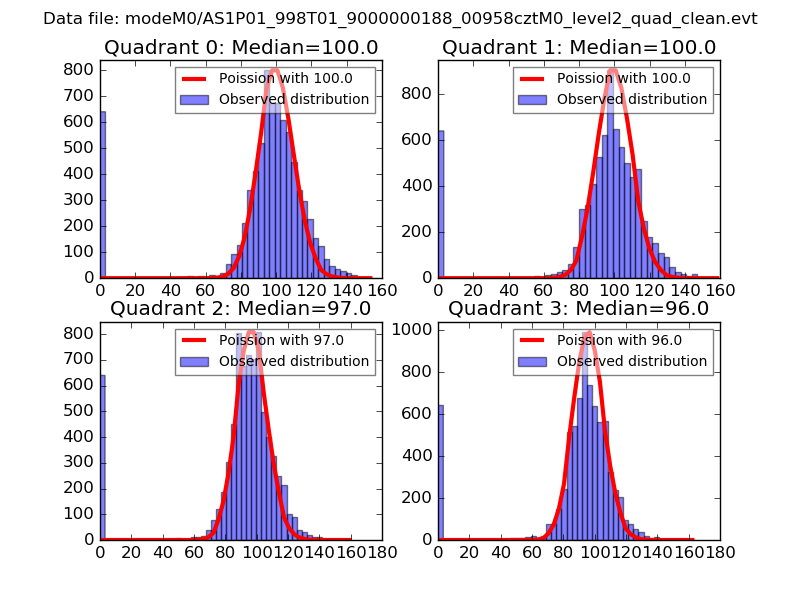 |
 |
| Quadrant-wise count rates Data is divided into 100 sec bins |
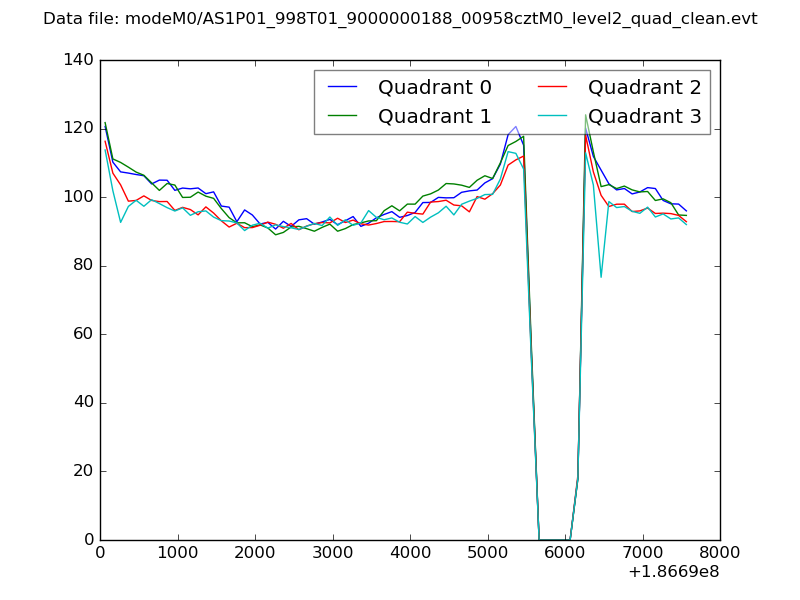 |
|
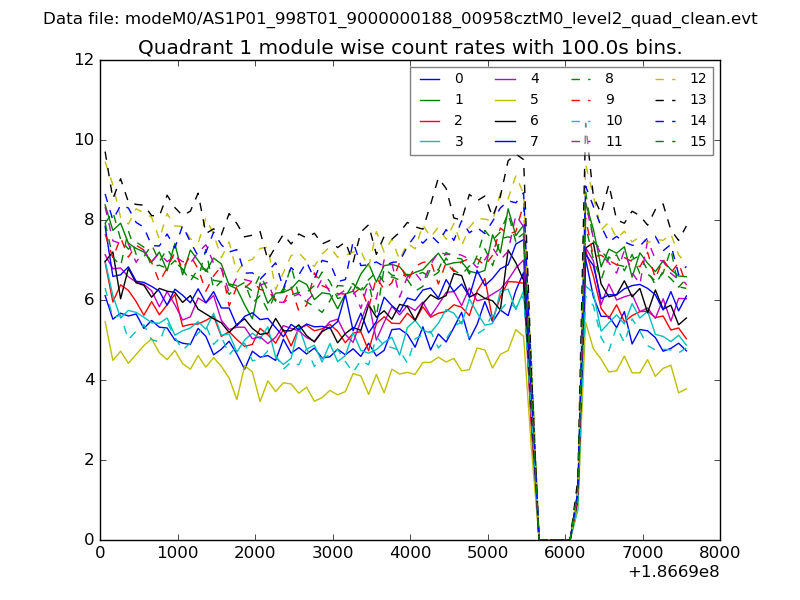
| Module-wise count rates for Quadrant A Data is divided into 100 sec bins |
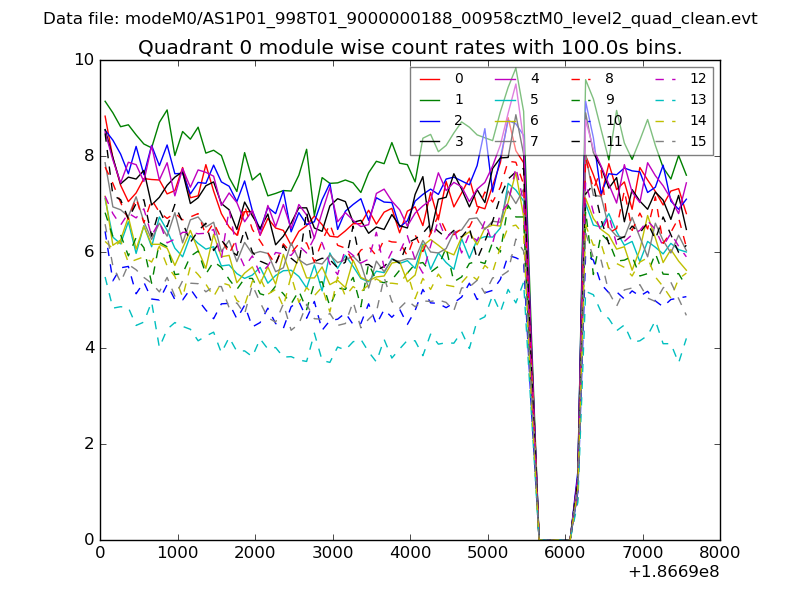 |
 |
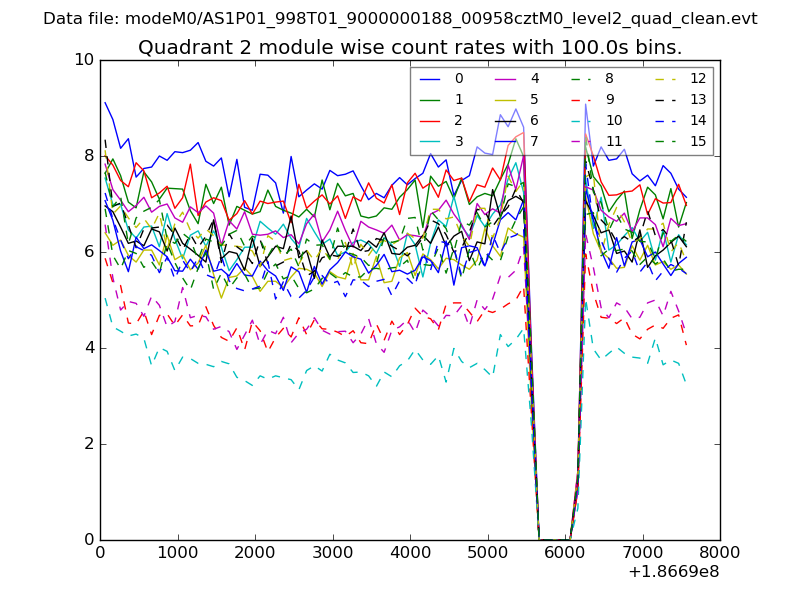
| Module-wise count rates for Quadrant B Data is divided into 100 sec bins |
 |
 |
| Module-wise count rates for Quadrant C Data is divided into 100 sec bins |
 |
 |
| Module-wise count rates for Quadrant D Data is divided into 100 sec bins |
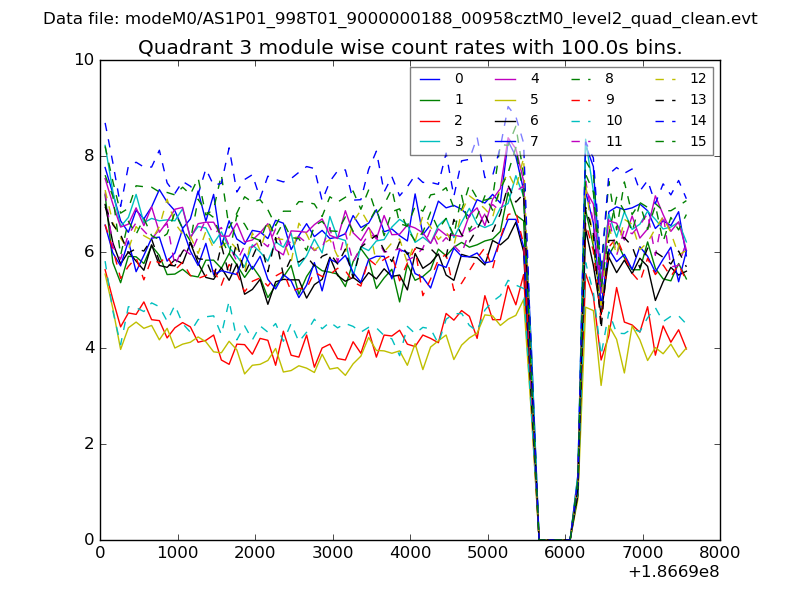 |
 |
| Parameter | Plot |
|---|---|
| CZT HV Monitor | 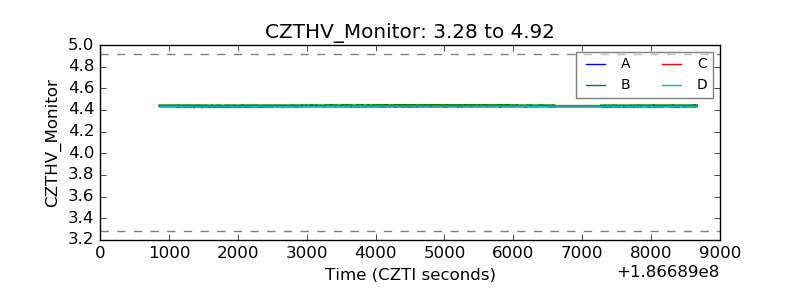 |
| D_VDD | 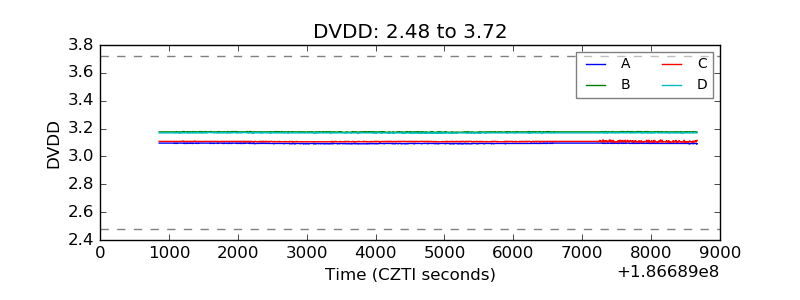 |
| Temperature 1 | 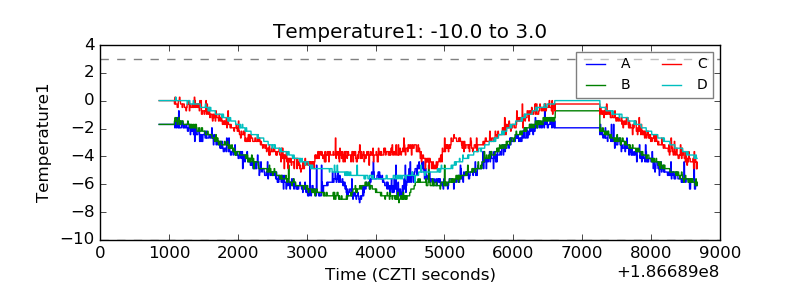 |
| Veto HV Monitor | 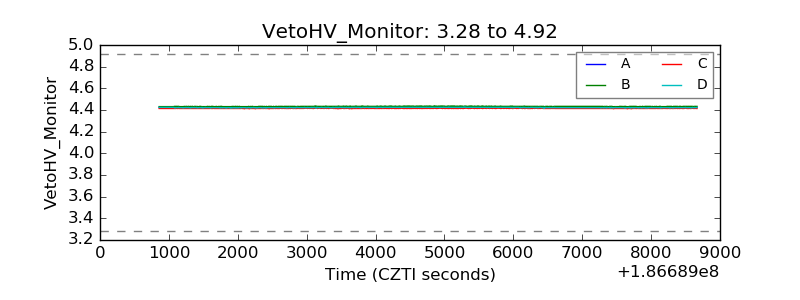 |
| Veto LLD | 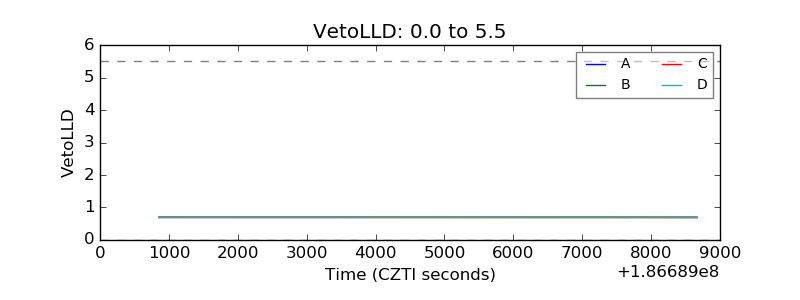 |
| Alpha Counter | 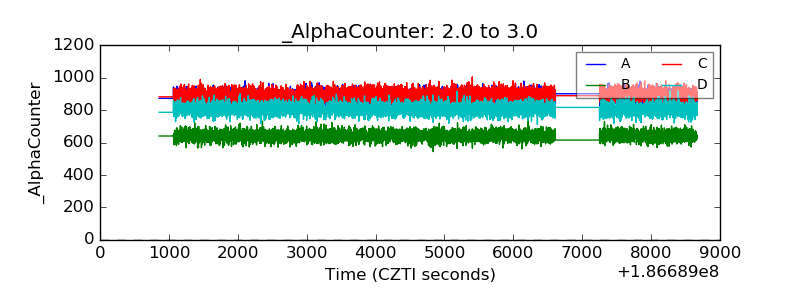 |
| _CPM_Rate | 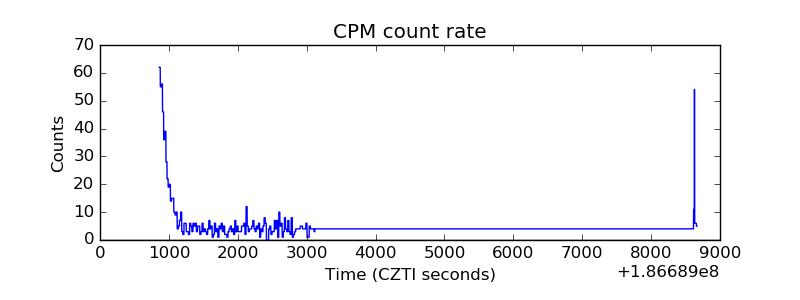 |
| CZT Counter | 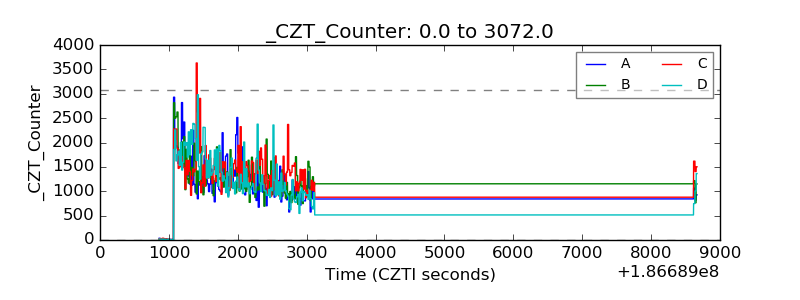 |
| +2.5 Volts monitor |  |
| +5 Volts monitor | 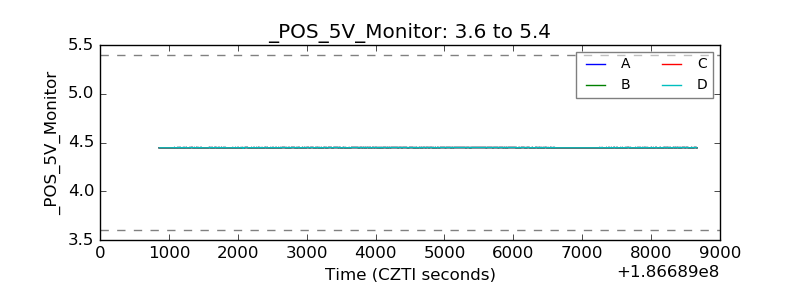 |
| _ROLL_ROT | 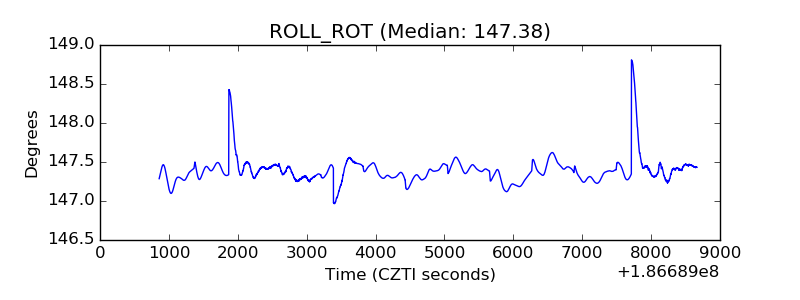 |
| _Roll_DEC | 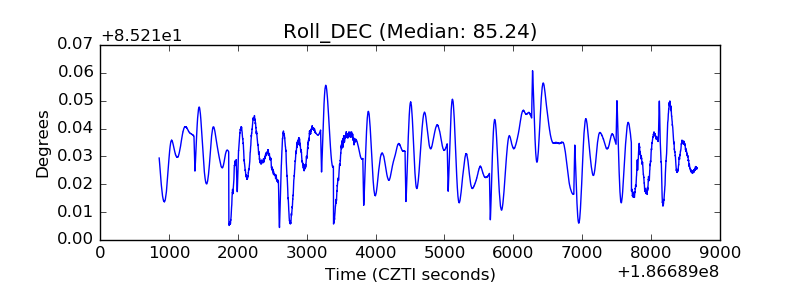 |
| _Roll_RA | 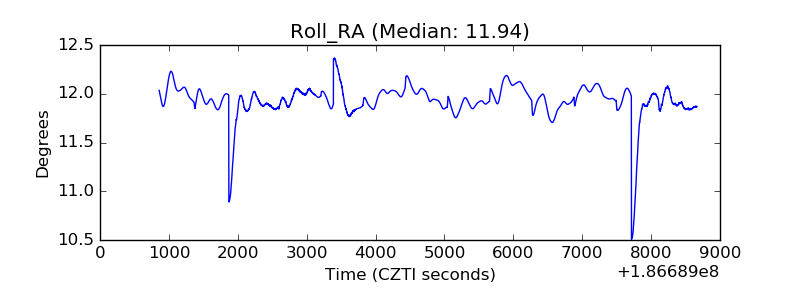 |
| Veto Counter | 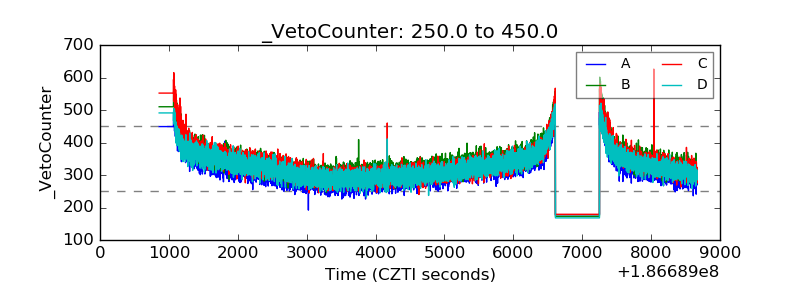 |