| Param | Original file | Final file |
|---|---|---|
| Filename | modeM0/AS1P01_998T01_9000000188_00964cztM0_level2.evt | modeM0/AS1P01_998T01_9000000188_00964cztM0_level2_quad_clean.evt |
| Size (bytes) | 3,645,662,400 | 247,455,360 |
| Size | 3.4 GB | 236.0 MB |
| Events in quadrant A | 21,206,121 | 1,732,070 |
| Events in quadrant B | 22,376,839 | 1,731,069 |
| Events in quadrant C | 23,609,808 | 1,682,966 |
| Events in quadrant D | 42,041,642 | 1,111,209 |
| Mode M0 | |||
|---|---|---|---|
| Quadrant | BADHDUFLAG | Total packets | Discarded packets |
| A | 0 | 75742 | 0 |
| B | 0 | 79112 | 0 |
| C | 0 | 82732 | 0 |
| D | 0 | 138864 | 0 |
| Mode M9 | |||
|---|---|---|---|
| Quadrant | BADHDUFLAG | Total packets | Discarded packets |
| A | 0 | 21 | 0 |
| B | 0 | 21 | 0 |
| C | 0 | 21 | 0 |
| D | 0 | 21 | 0 |
| Mode SS | |||
|---|---|---|---|
| Quadrant | BADHDUFLAG | Total packets | Discarded packets |
| A | 0 | 362 | 0 |
| B | 0 | 362 | 0 |
| C | 0 | 360 | 0 |
| D | 0 | 362 | 0 |
| Quadrant | Total seconds | Saturated seconds | Saturation percentage |
|---|---|---|---|
| A | 17910 | 24 | 0.134003% |
| B | 17909 | 62 | 0.346195% |
| C | 17910 | 13 | 0.072585% |
| D | 17910 | 8690 | 48.520380% |
Noise dominated data is calculated using 1-second bins in cleaned event files. If a bin has >2000 counts, and if more than 50% of those come from <1% of pixels, then it is considered to be noise-dominated and hence unusable.
| Quadrant | # 1 sec bins | Bins with >0 counts | Bins with >2000 counts | High rate bins dominated by noise | Noise dominated (total time) | Noise dominated (detector-on time) | Marked lightcurve |
|---|---|---|---|---|---|---|---|
| A | 19930 | 17913 | 392 | 392 | 1.97% | 2.19% | 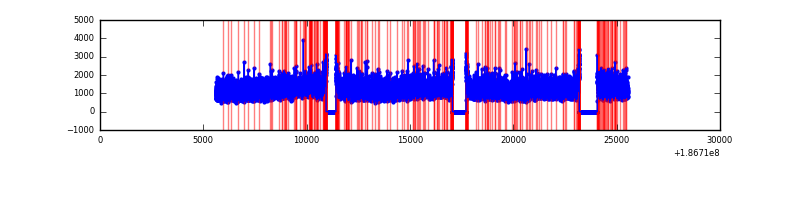 |
| B | 19929 | 17912 | 550 | 550 | 2.76% | 3.07% | 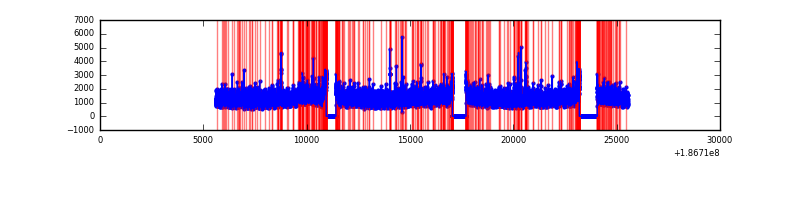 |
| C | 19930 | 17913 | 635 | 635 | 3.19% | 3.54% | 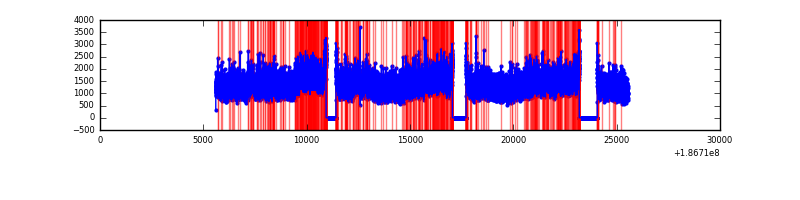 |
| D | 19930 | 17912 | 10950 | 10950 | 54.94% | 61.13% | 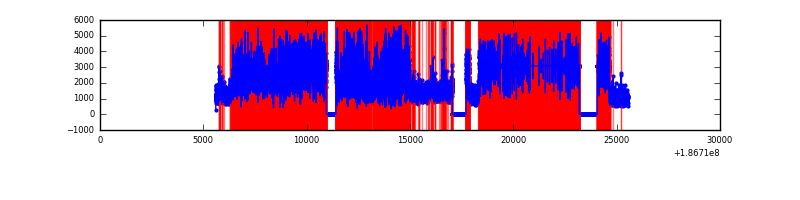 |
Top three noisy pixels from each quadrant. If the there are fewer than three noisy pixels in the level2.evt file, extra rows are filled as -1
| Pixel properties | Quadrant properties | ||||||
|---|---|---|---|---|---|---|---|
| Quadrant | DetID | PixID | Counts | Sigma | Mean | Median | Sigma |
| A | 14 | 170 | 97596 | 69.59 | 5488 | 5534 | 1322.9 |
| A | 0 | 253 | 33738 | 21.32 | 5488 | 5534 | 1322.9 |
| A | 12 | 189 | 27753 | 16.8 | 5488 | 5534 | 1322.9 |
| B | 8 | 234 | 170541 | 122.85 | 5704 | 5723 | 1341.6 |
| B | 5 | 249 | 144677 | 103.57 | 5704 | 5723 | 1341.6 |
| B | 15 | 22 | 143734 | 102.87 | 5704 | 5723 | 1341.6 |
| C | 10 | 34 | 2454163 | 1707.37 | 5141 | 5312 | 1434.3 |
| C | 15 | 241 | 820931 | 568.66 | 5141 | 5312 | 1434.3 |
| C | 3 | 111 | 71463 | 46.12 | 5141 | 5312 | 1434.3 |
| D | 12 | 188 | 27354928 | 25354.63 | 3682 | 3772 | 1078.7 |
| D | 11 | 131 | 576620 | 531.03 | 3682 | 3772 | 1078.7 |
| D | 1 | 4 | 332117 | 304.38 | 3682 | 3772 | 1078.7 |
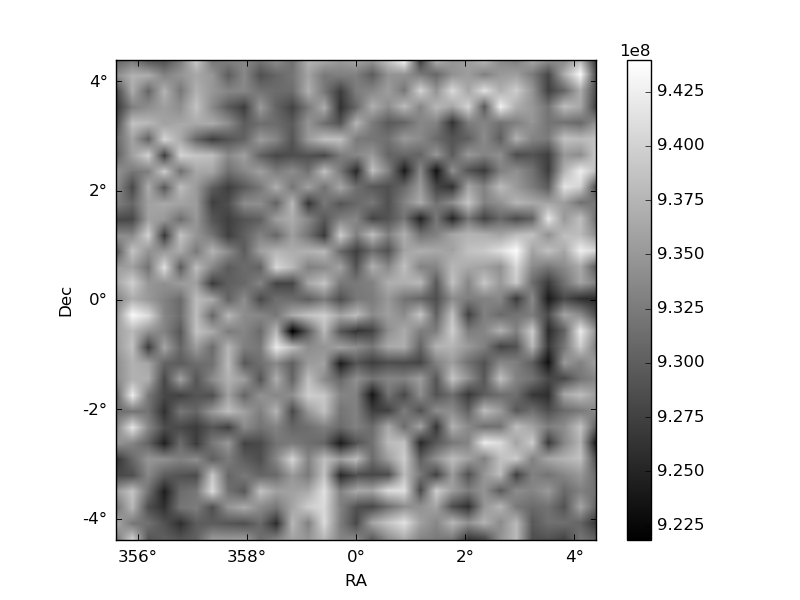
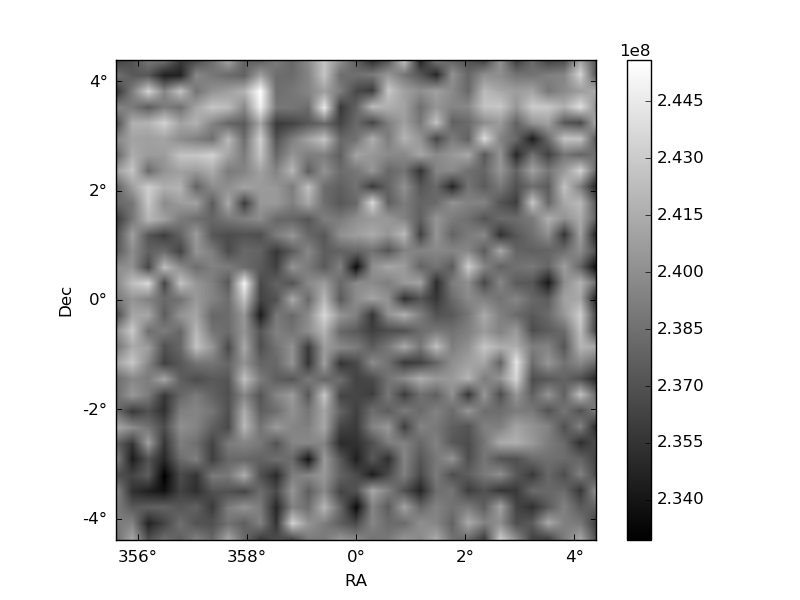
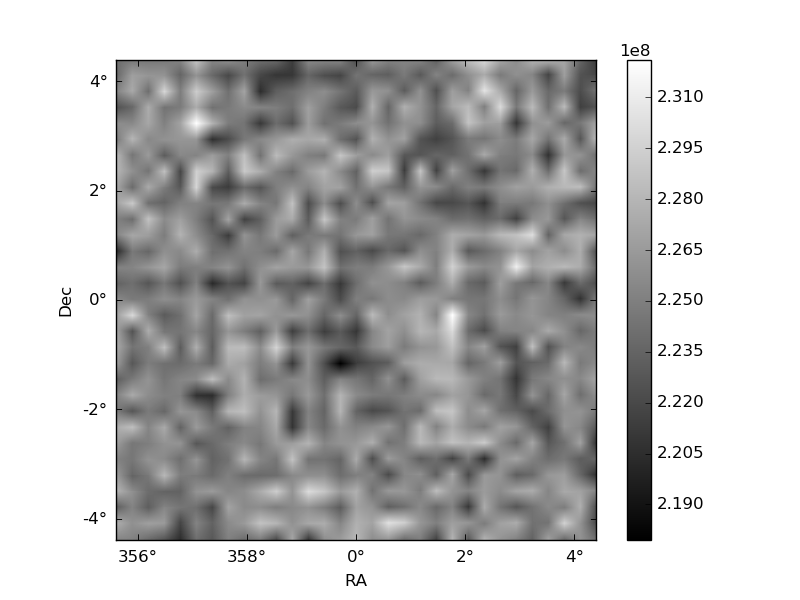
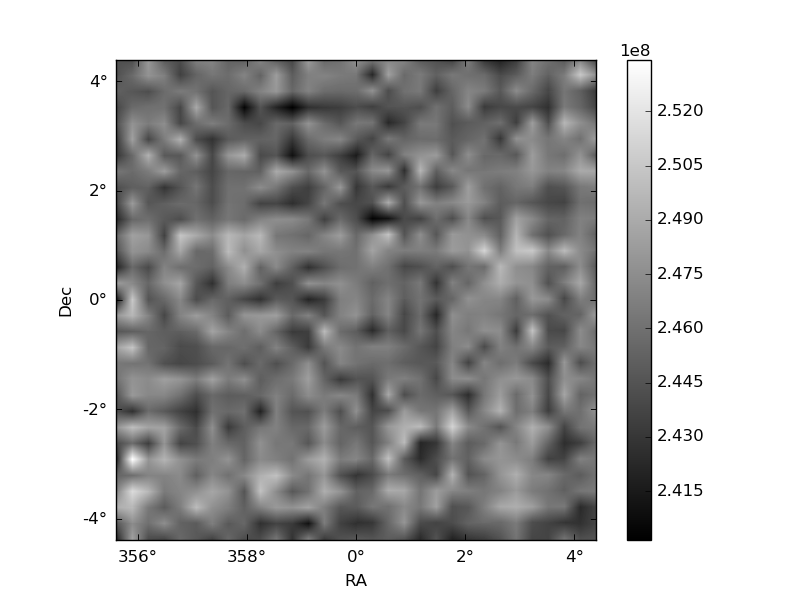
Histogram calculated using DETX and DETY for each event in the final _common_clean file
| Quadrant A | 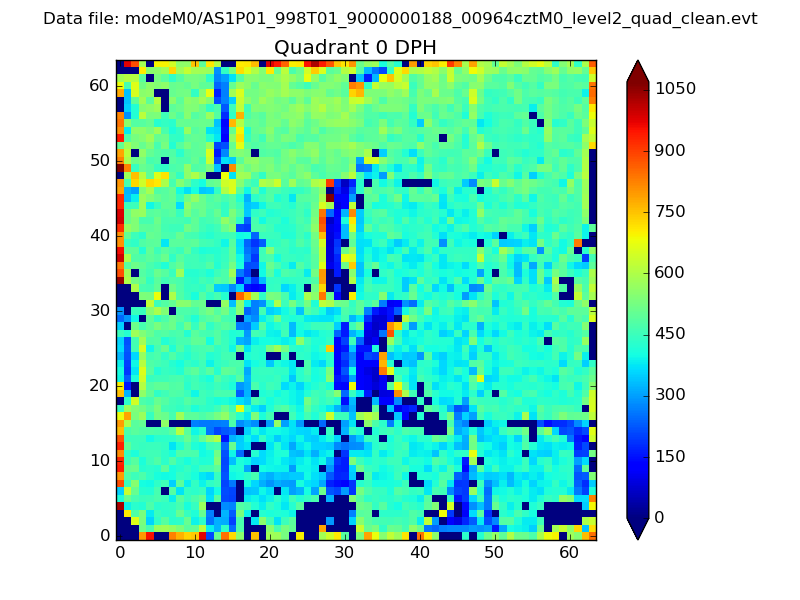 |
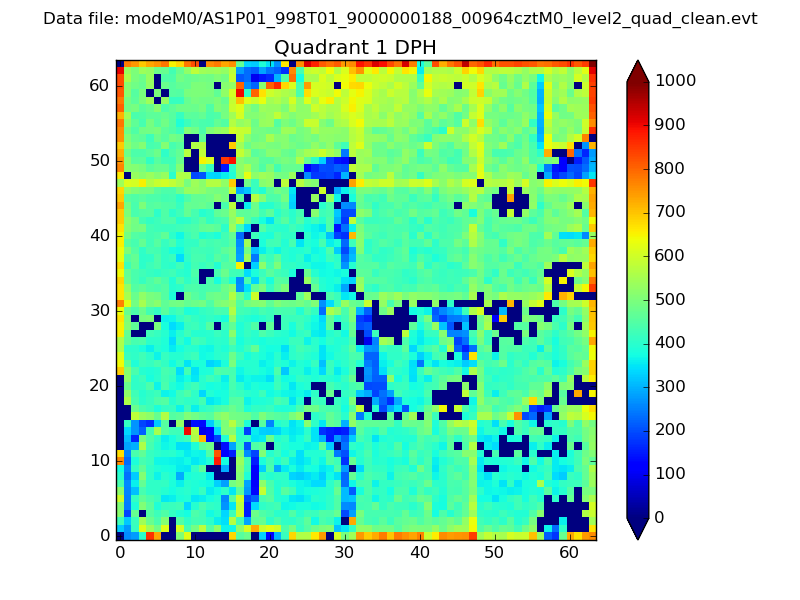 |
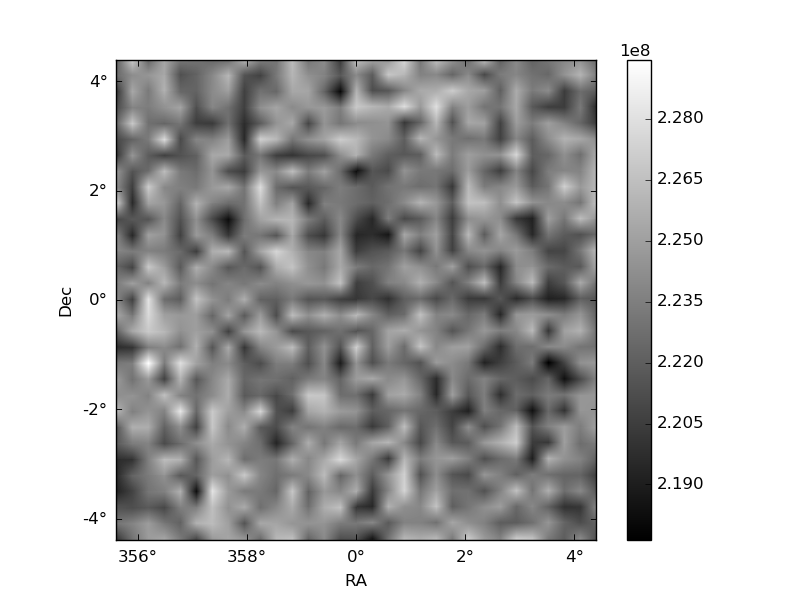
Quadrant B |
|---|---|---|---|
| Quadrant D | 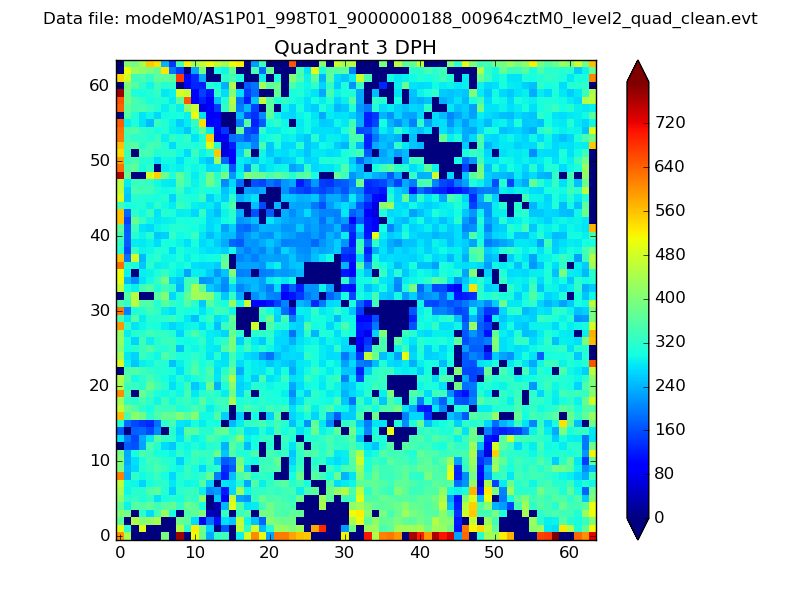 |
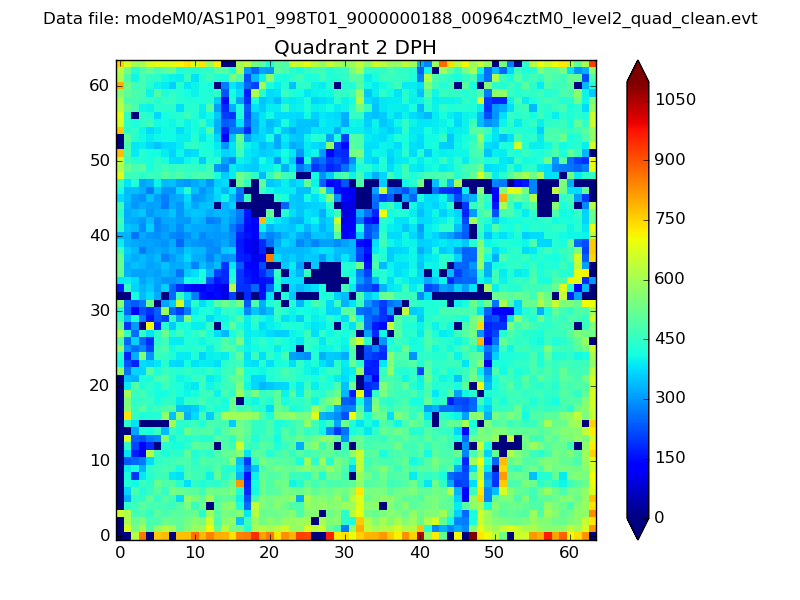 |
Quadrant C |
| Plot type | Count rate plots | Images |
|---|---|---|
| Comparison with Poisson distribution Blue bars denote a histogram of data divided into 1 sec bins. Red curve is a Poisson curve with rate = median count rate of data. |
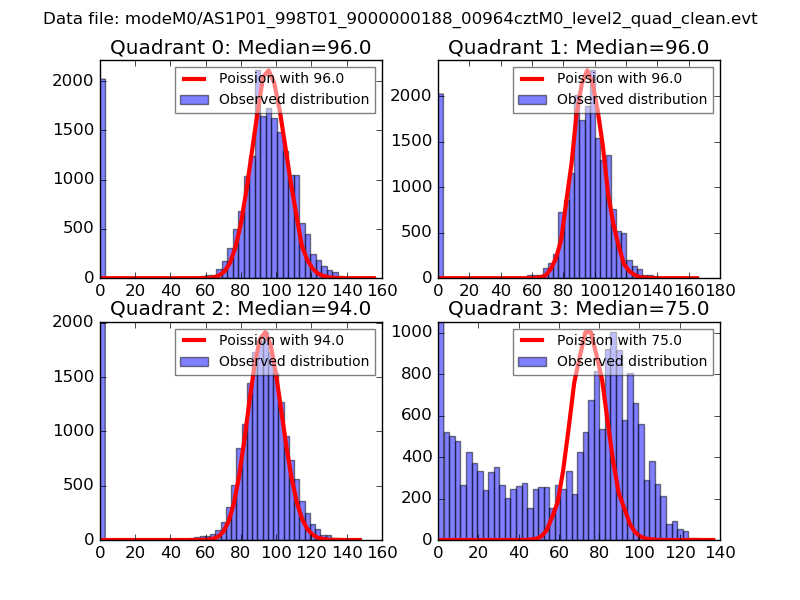 |
 |
| Quadrant-wise count rates Data is divided into 100 sec bins |
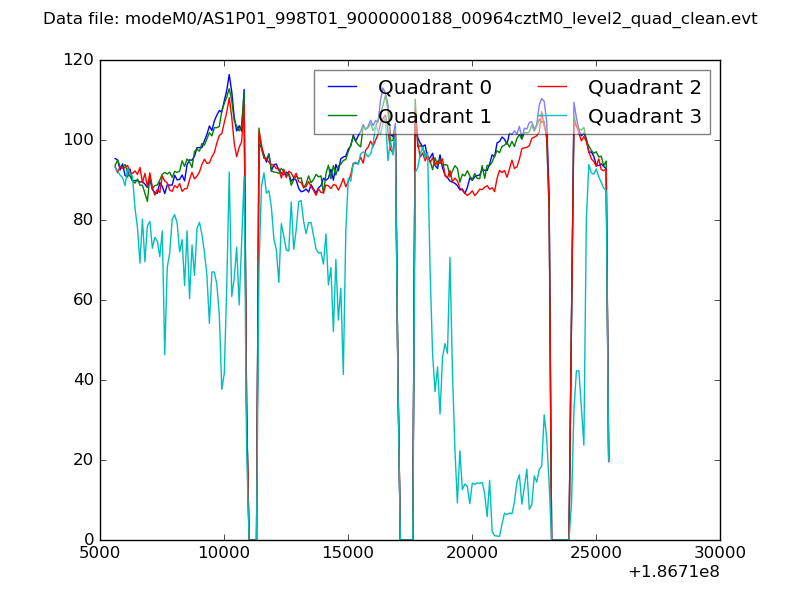 |
|
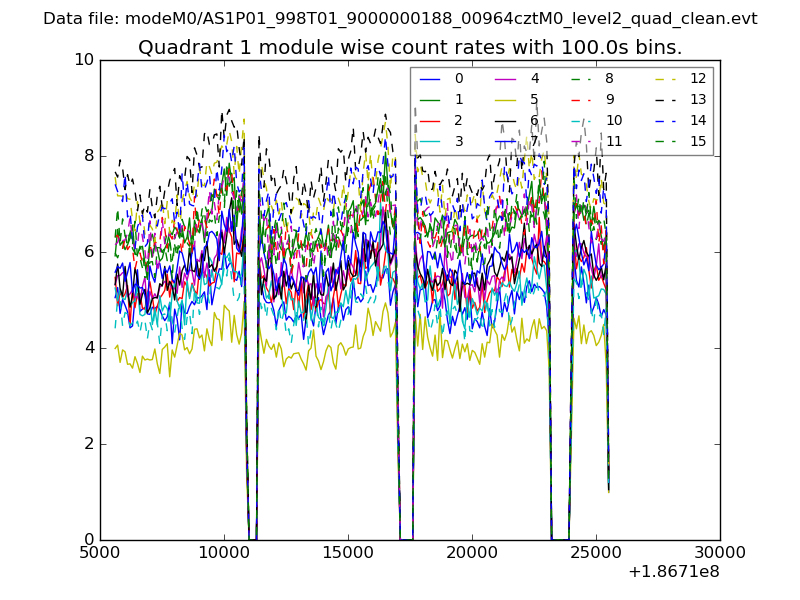
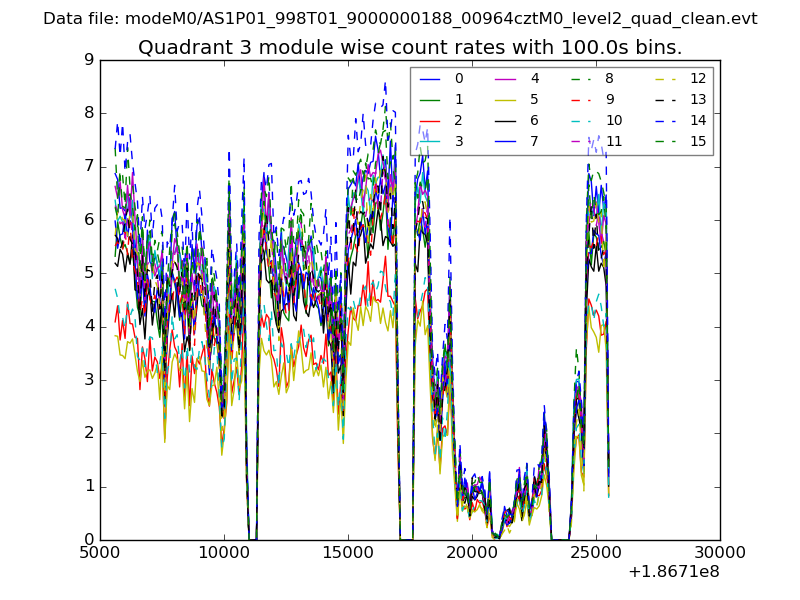
| Module-wise count rates for Quadrant A Data is divided into 100 sec bins |
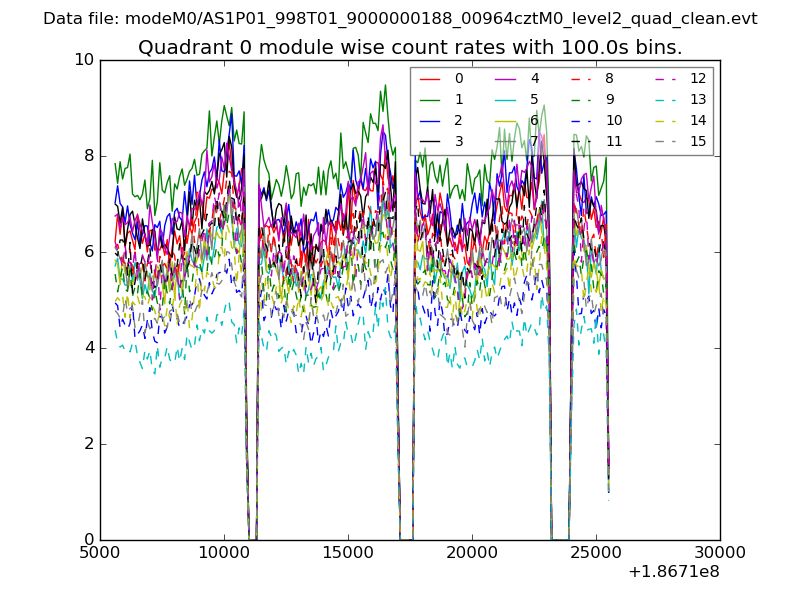 |
 |
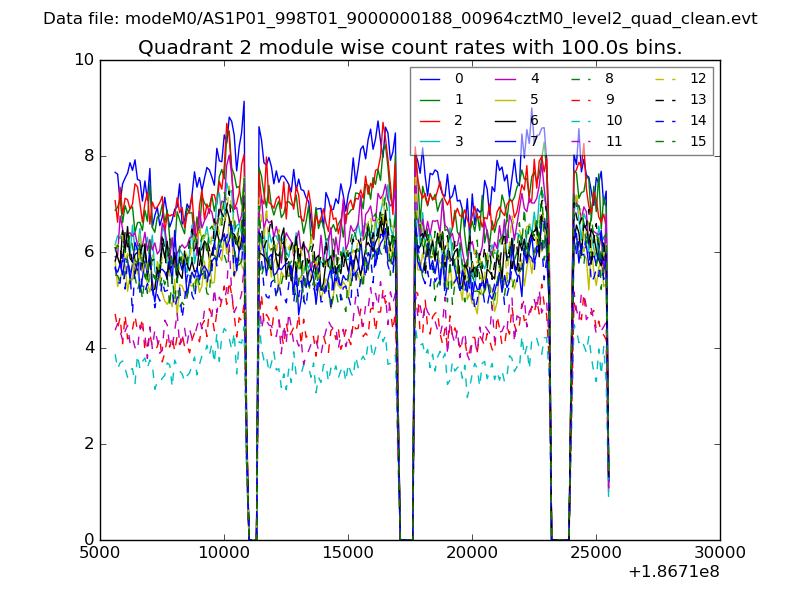
| Module-wise count rates for Quadrant B Data is divided into 100 sec bins |
 |
 |
| Module-wise count rates for Quadrant C Data is divided into 100 sec bins |
 |
 |
| Module-wise count rates for Quadrant D Data is divided into 100 sec bins |
 |
 |
| Parameter | Plot |
|---|---|
| CZT HV Monitor | 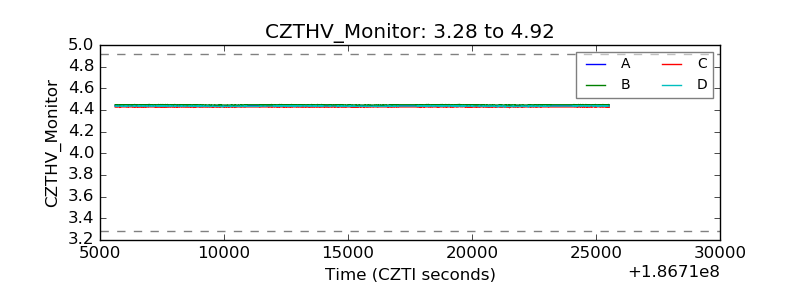 |
| D_VDD | 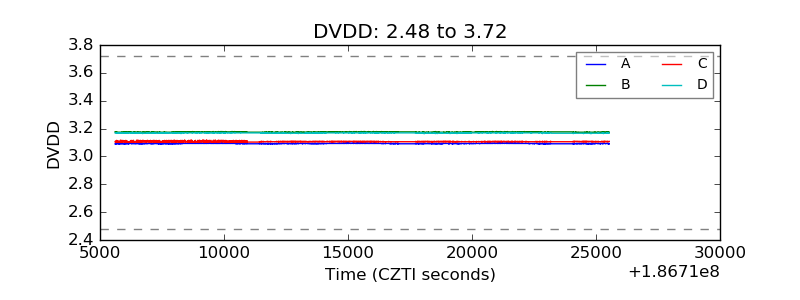 |
| Temperature 1 | 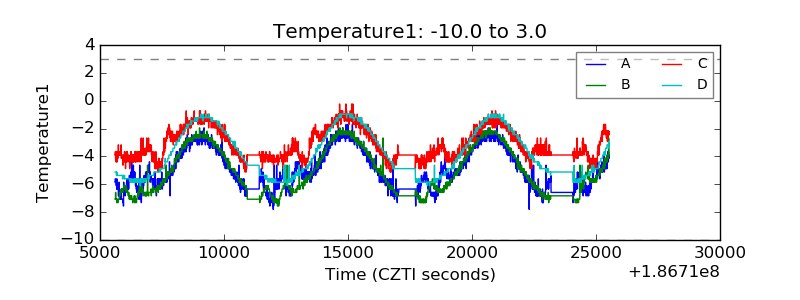 |
| Veto HV Monitor | 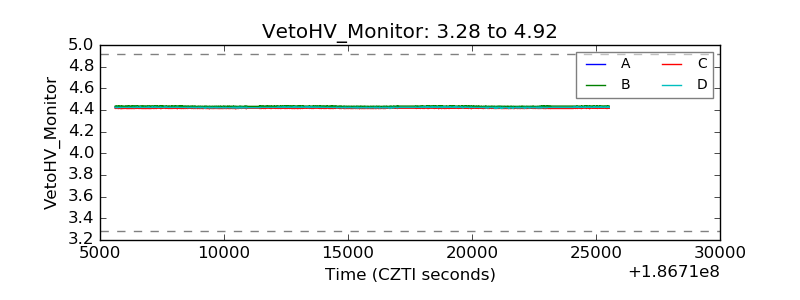 |
| Veto LLD | 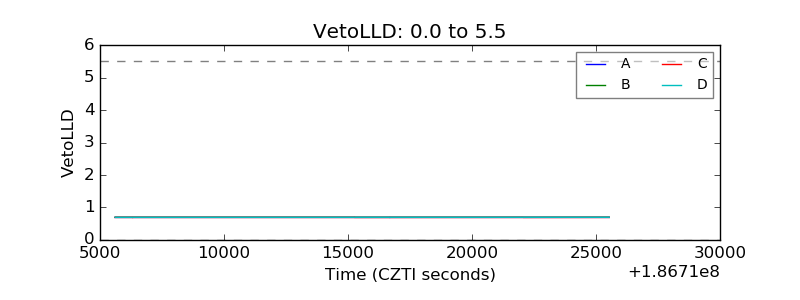 |
| Alpha Counter | 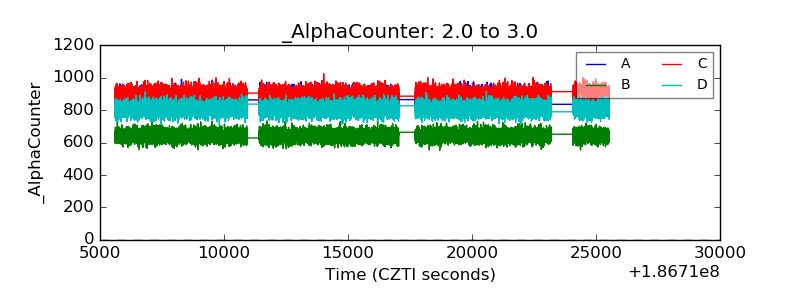 |
| _CPM_Rate | 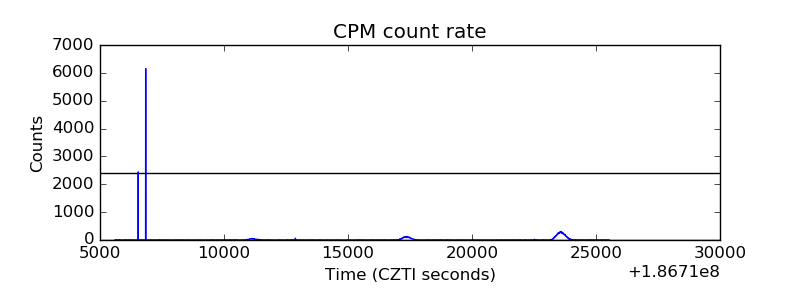 |
| CZT Counter | 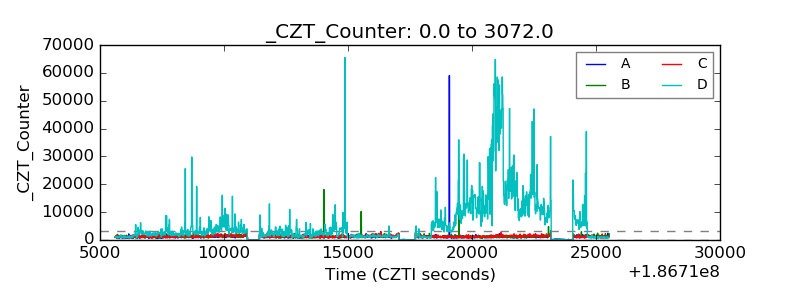 |
| +2.5 Volts monitor | 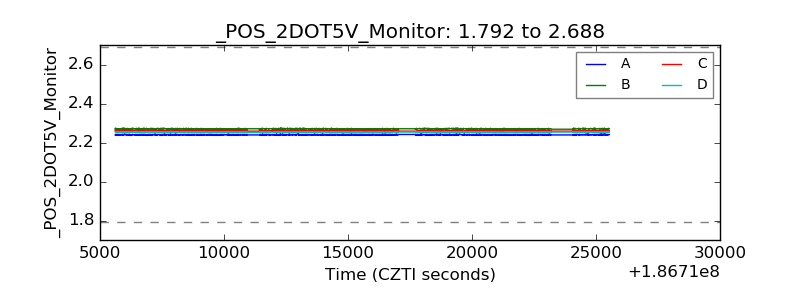 |
| +5 Volts monitor | 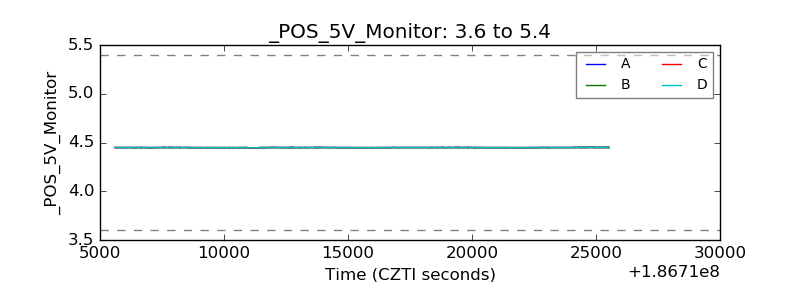 |
| _ROLL_ROT | 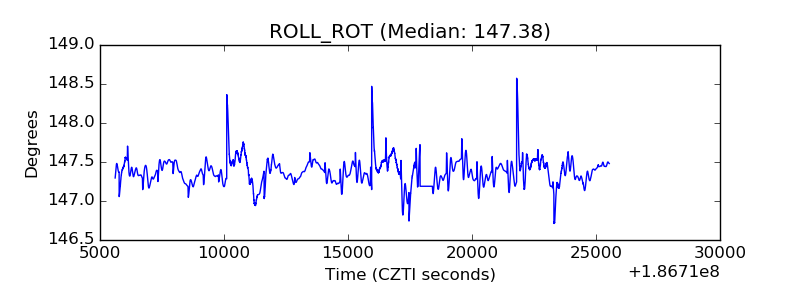 |
| _Roll_DEC | 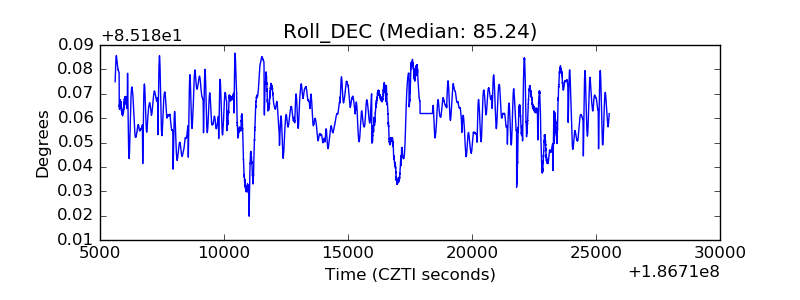 |
| _Roll_RA | 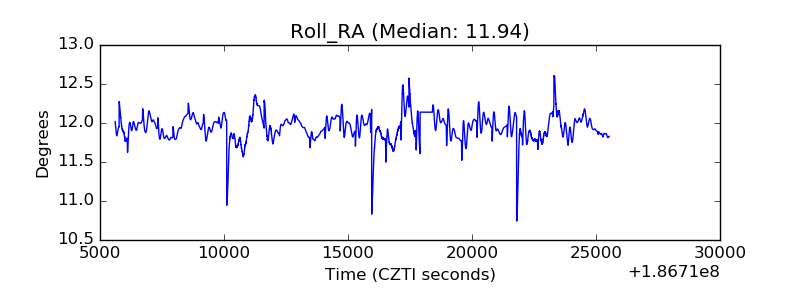 |
| Veto Counter | 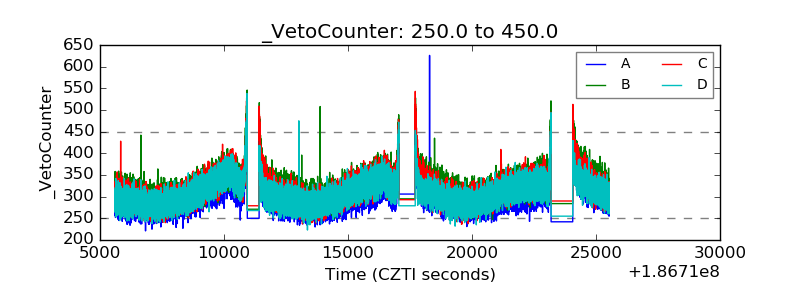 |