| Param | Original file | Final file |
|---|---|---|
| Filename | modeM0/AS1P01_998T01_9000000188_00965cztM0_level2.evt | modeM0/AS1P01_998T01_9000000188_00965cztM0_level2_quad_clean.evt |
| Size (bytes) | 4,323,565,440 | 312,543,360 |
| Size | 4.0 GB | 298.1 MB |
| Events in quadrant A | 26,452,286 | 2,164,693 |
| Events in quadrant B | 27,865,419 | 2,162,709 |
| Events in quadrant C | 28,651,898 | 2,095,620 |
| Events in quadrant D | 46,516,456 | 1,515,767 |
| Mode M0 | |||
|---|---|---|---|
| Quadrant | BADHDUFLAG | Total packets | Discarded packets |
| A | 0 | 94335 | 0 |
| B | 0 | 98445 | 0 |
| C | 0 | 100711 | 0 |
| D | 0 | 155166 | 0 |
| Mode M9 | |||
|---|---|---|---|
| Quadrant | BADHDUFLAG | Total packets | Discarded packets |
| A | 0 | 31 | 0 |
| B | 0 | 31 | 0 |
| C | 0 | 31 | 0 |
| D | 0 | 31 | 0 |
| Mode SS | |||
|---|---|---|---|
| Quadrant | BADHDUFLAG | Total packets | Discarded packets |
| A | 0 | 448 | 0 |
| B | 0 | 448 | 0 |
| C | 0 | 448 | 0 |
| D | 0 | 448 | 0 |
| Quadrant | Total seconds | Saturated seconds | Saturation percentage |
|---|---|---|---|
| A | 22147 | 69 | 0.311555% |
| B | 22147 | 103 | 0.465074% |
| C | 22147 | 26 | 0.117397% |
| D | 22148 | 8715 | 39.348925% |
Noise dominated data is calculated using 1-second bins in cleaned event files. If a bin has >2000 counts, and if more than 50% of those come from <1% of pixels, then it is considered to be noise-dominated and hence unusable.
| Quadrant | # 1 sec bins | Bins with >0 counts | Bins with >2000 counts | High rate bins dominated by noise | Noise dominated (total time) | Noise dominated (detector-on time) | Marked lightcurve |
|---|---|---|---|---|---|---|---|
| A | 25142 | 22151 | 549 | 549 | 2.18% | 2.48% | 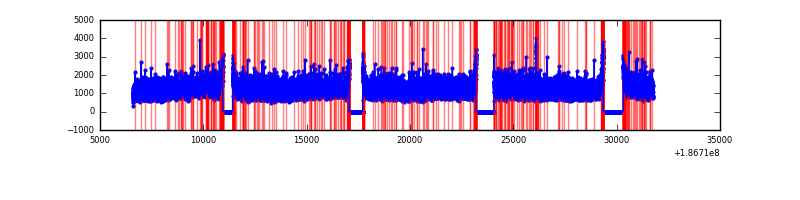 |
| B | 25142 | 22151 | 766 | 766 | 3.05% | 3.46% | 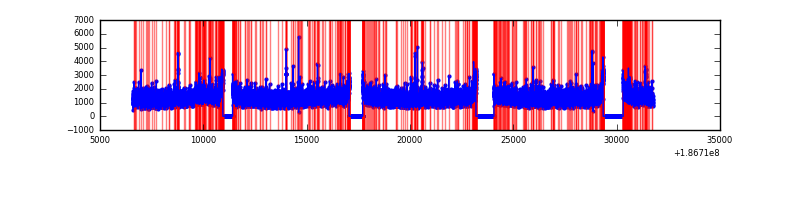 |
| C | 25143 | 22152 | 750 | 750 | 2.98% | 3.39% | 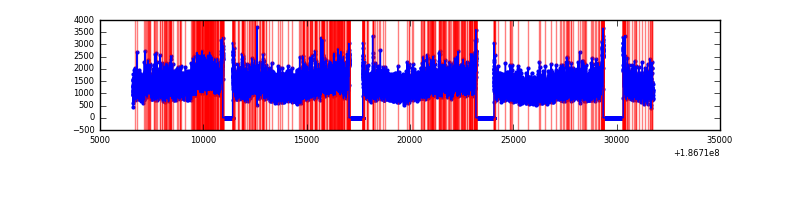 |
| D | 25143 | 22151 | 11005 | 11005 | 43.77% | 49.68% | 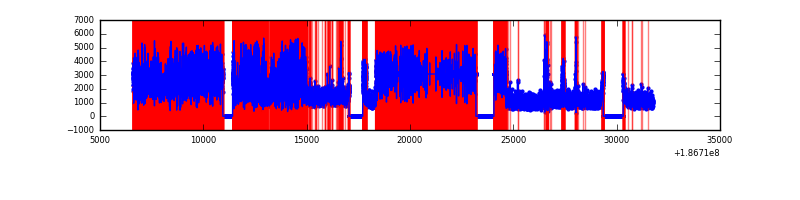 |
Top three noisy pixels from each quadrant. If the there are fewer than three noisy pixels in the level2.evt file, extra rows are filled as -1
| Pixel properties | Quadrant properties | ||||||
|---|---|---|---|---|---|---|---|
| Quadrant | DetID | PixID | Counts | Sigma | Mean | Median | Sigma |
| A | 14 | 170 | 99813 | 56.36 | 6841 | 6898 | 1648.6 |
| A | 15 | 233 | 58838 | 31.5 | 6841 | 6898 | 1648.6 |
| A | 12 | 189 | 36826 | 18.15 | 6841 | 6898 | 1648.6 |
| B | 5 | 249 | 202986 | 117.38 | 7075 | 7100 | 1668.8 |
| B | 8 | 234 | 194158 | 112.09 | 7075 | 7100 | 1668.8 |
| B | 15 | 22 | 166117 | 95.29 | 7075 | 7100 | 1668.8 |
| C | 10 | 34 | 2357223 | 1320.95 | 6392 | 6604 | 1779.5 |
| C | 15 | 241 | 1010683 | 564.25 | 6392 | 6604 | 1779.5 |
| C | 3 | 111 | 88685 | 46.13 | 6392 | 6604 | 1779.5 |
| D | 12 | 188 | 26971576 | 18601.37 | 4928 | 5061 | 1449.7 |
| D | 11 | 131 | 479035 | 326.94 | 4928 | 5061 | 1449.7 |
| D | 1 | 4 | 387898 | 264.08 | 4928 | 5061 | 1449.7 |
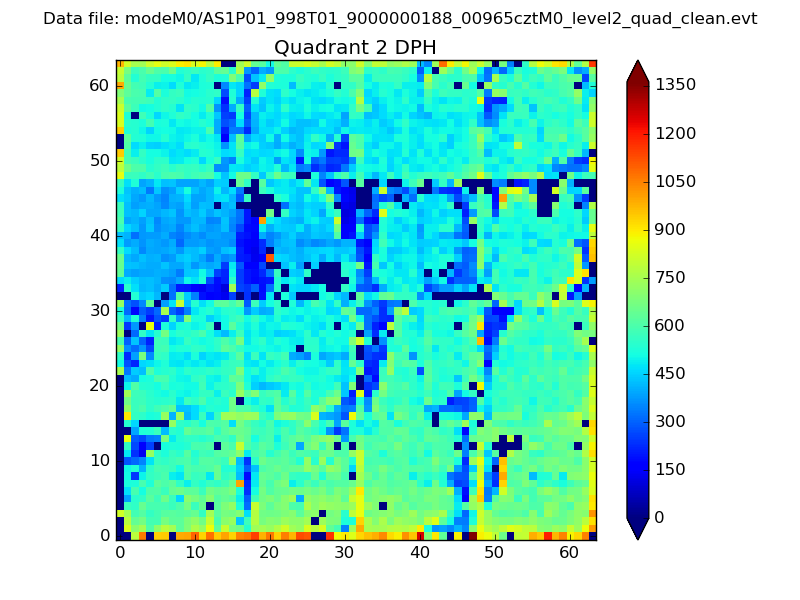
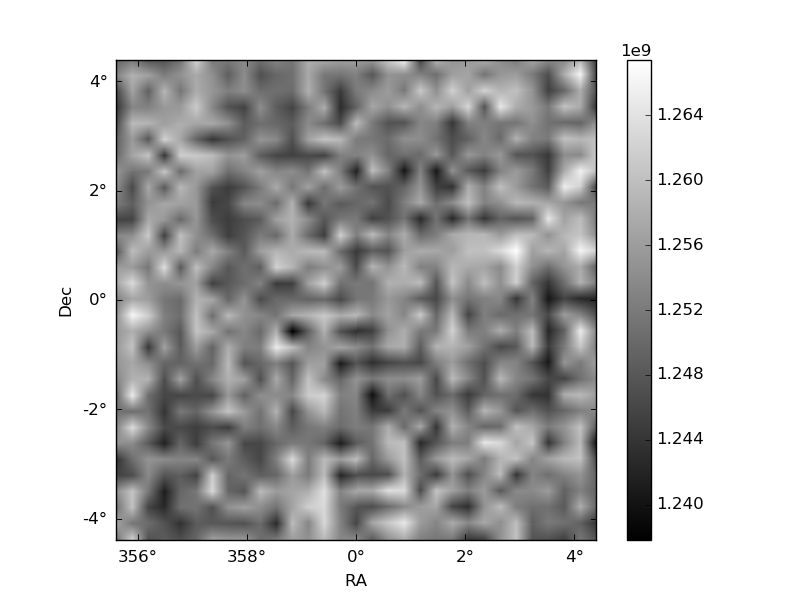
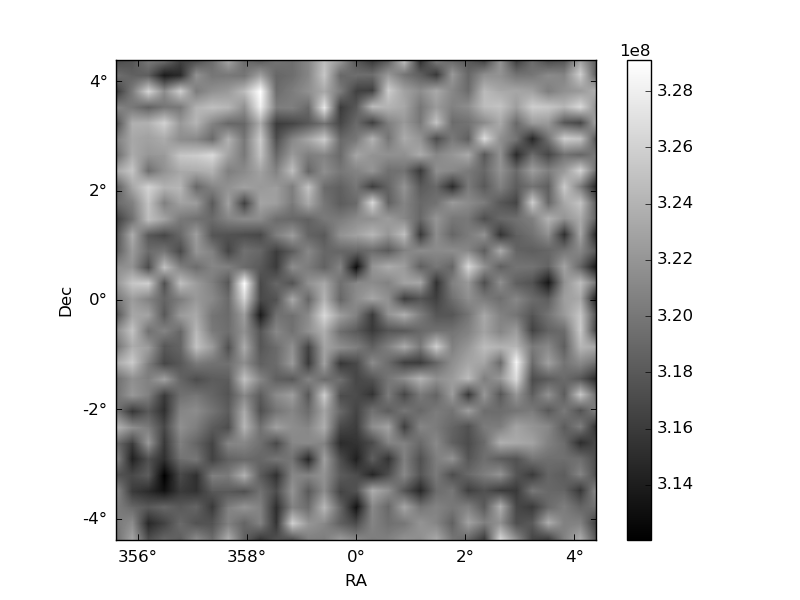
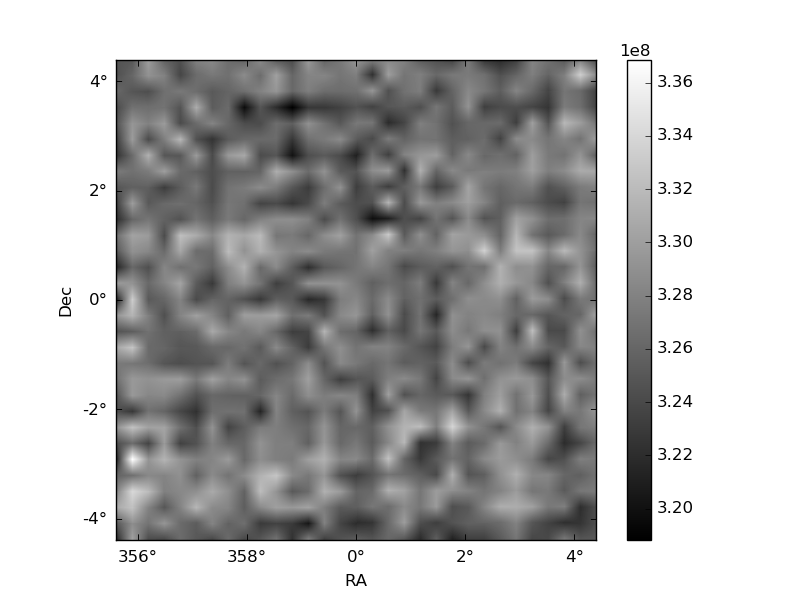
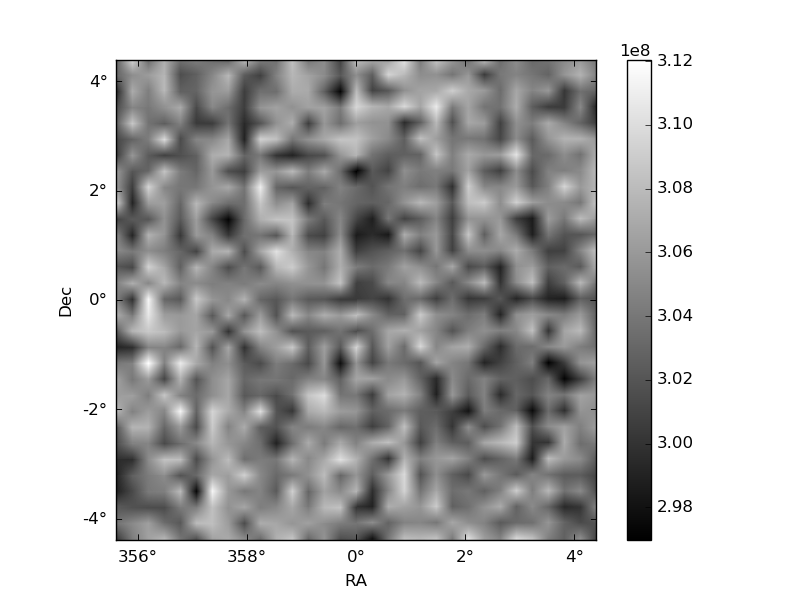
Histogram calculated using DETX and DETY for each event in the final _common_clean file
| Quadrant A | 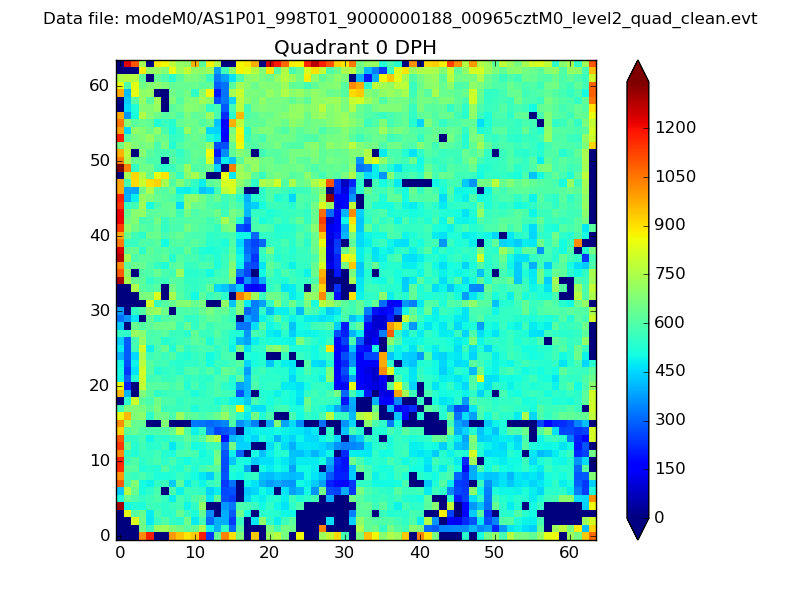 |
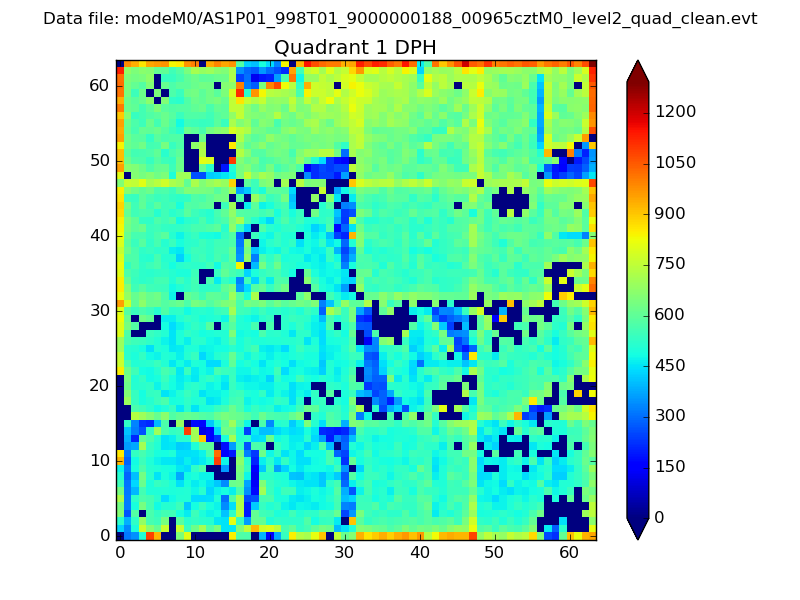 |
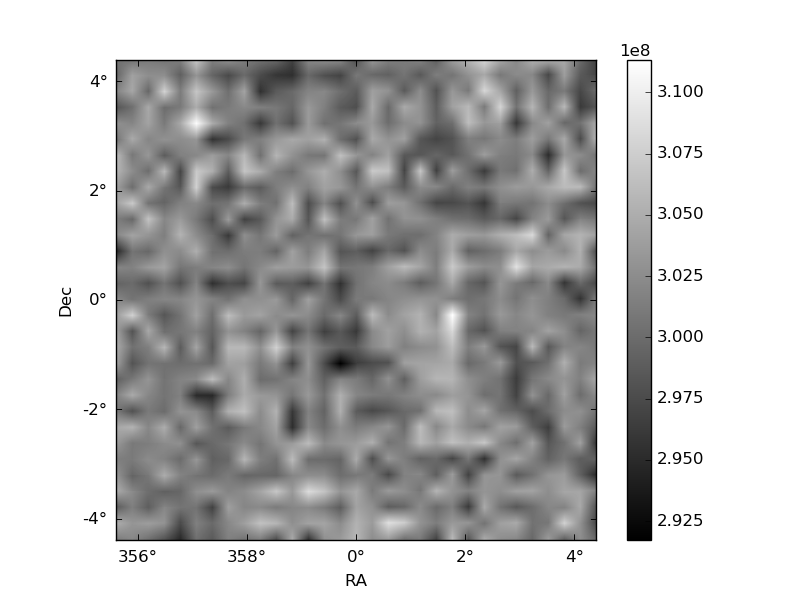
Quadrant B |
|---|---|---|---|
| Quadrant D | 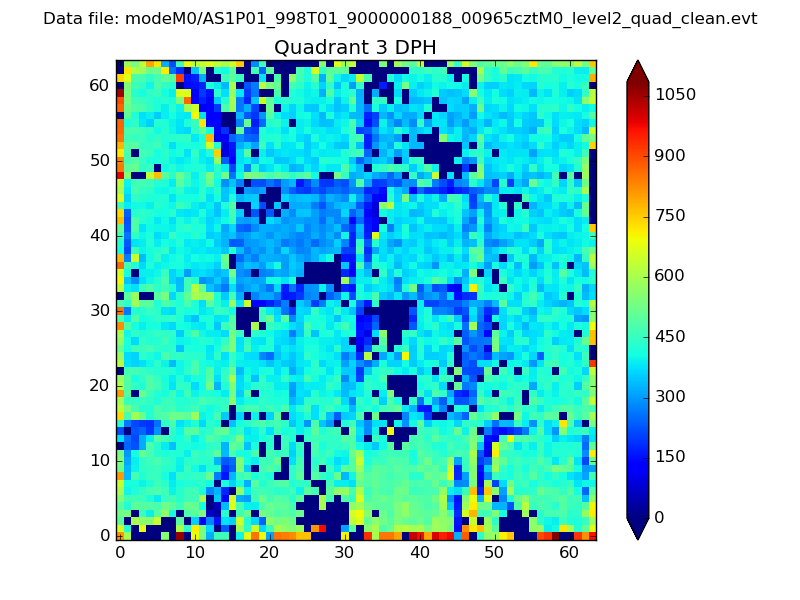 |
 |
Quadrant C |
| Plot type | Count rate plots | Images |
|---|---|---|
| Comparison with Poisson distribution Blue bars denote a histogram of data divided into 1 sec bins. Red curve is a Poisson curve with rate = median count rate of data. |
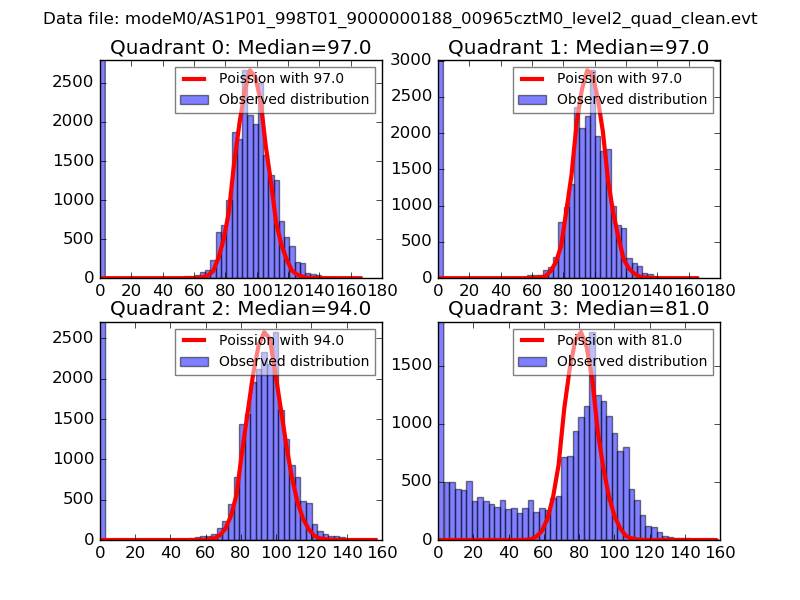 |
 |
| Quadrant-wise count rates Data is divided into 100 sec bins |
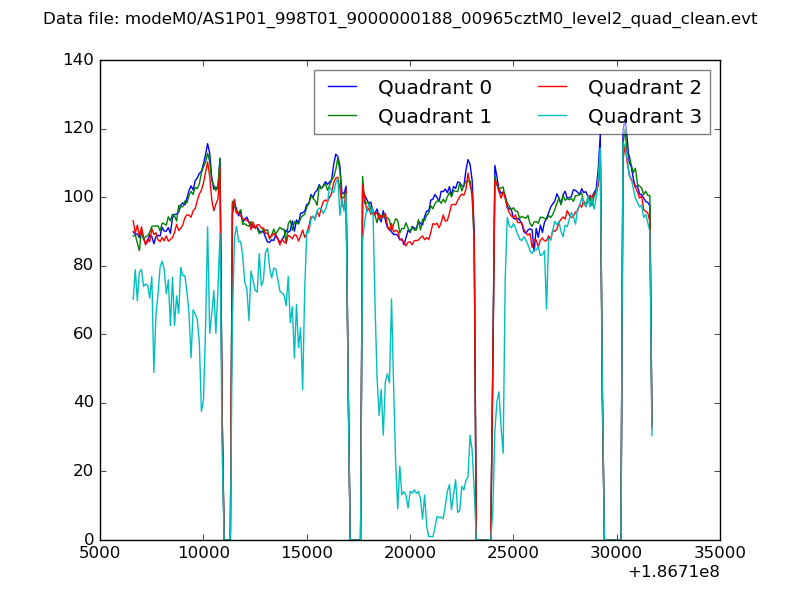 |
|
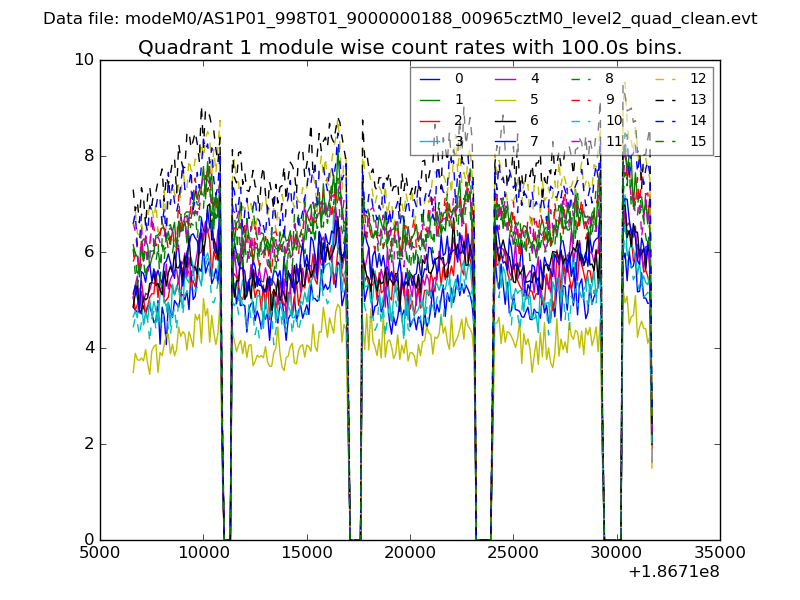
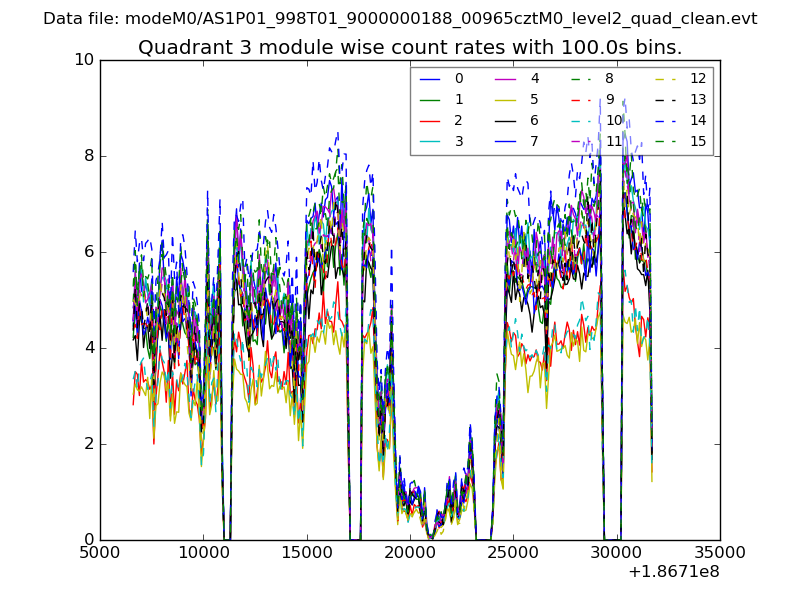
| Module-wise count rates for Quadrant A Data is divided into 100 sec bins |
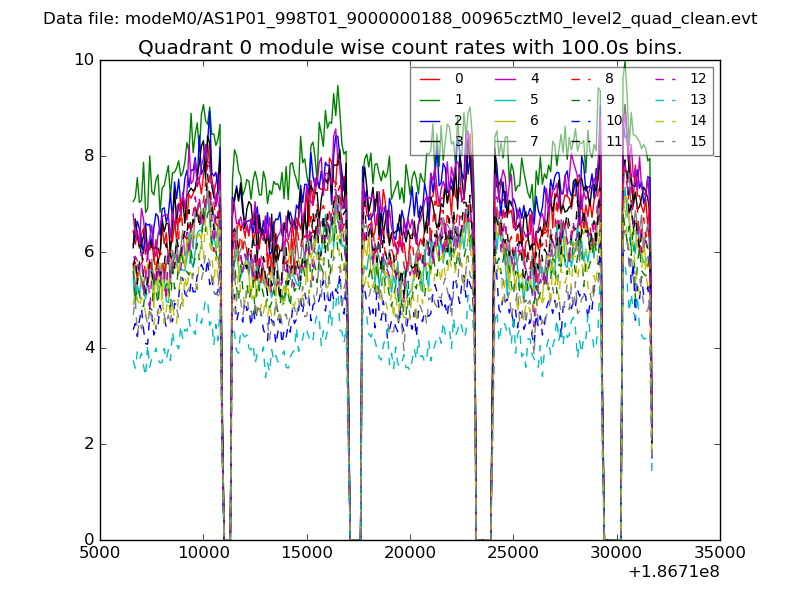 |
 |
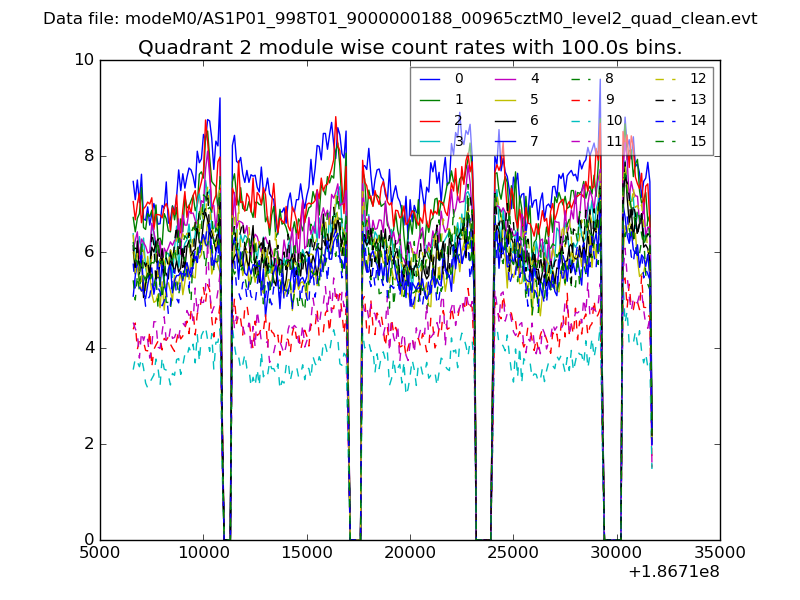
| Module-wise count rates for Quadrant B Data is divided into 100 sec bins |
 |
 |
| Module-wise count rates for Quadrant C Data is divided into 100 sec bins |
 |
 |
| Module-wise count rates for Quadrant D Data is divided into 100 sec bins |
 |
 |
| Parameter | Plot |
|---|---|
| CZT HV Monitor | 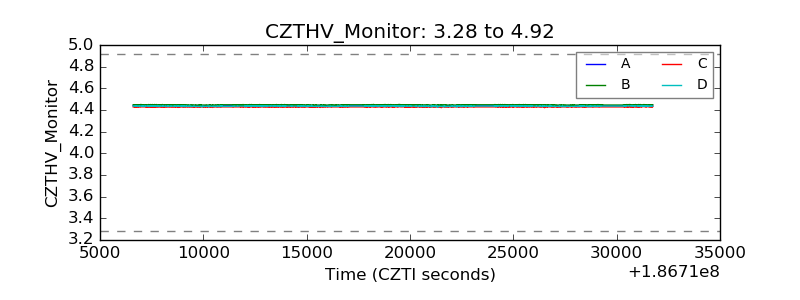 |
| D_VDD | 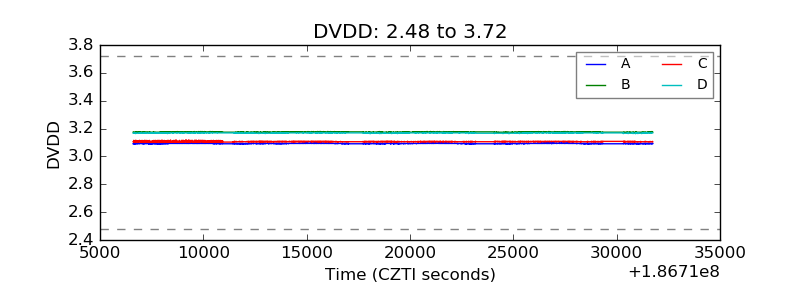 |
| Temperature 1 | 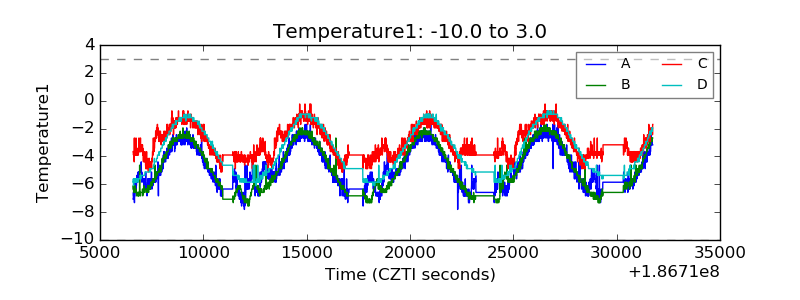 |
| Veto HV Monitor | 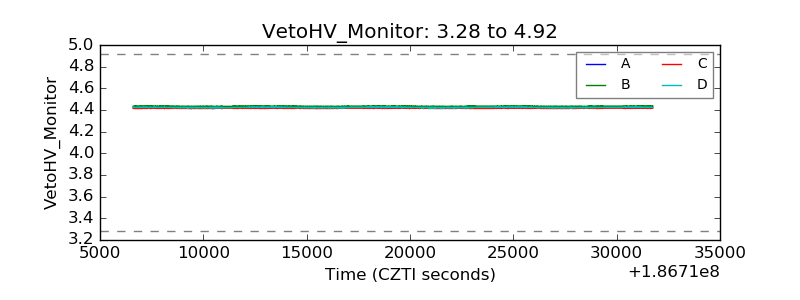 |
| Veto LLD | 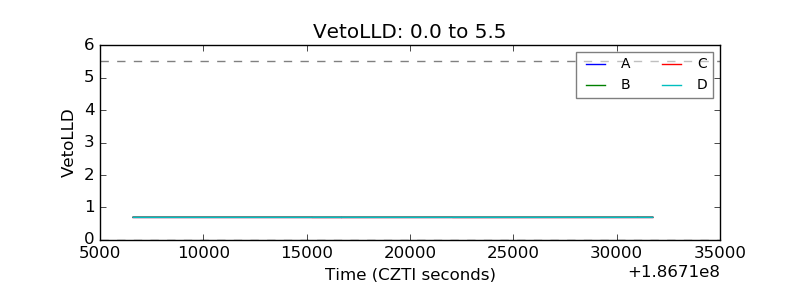 |
| Alpha Counter | 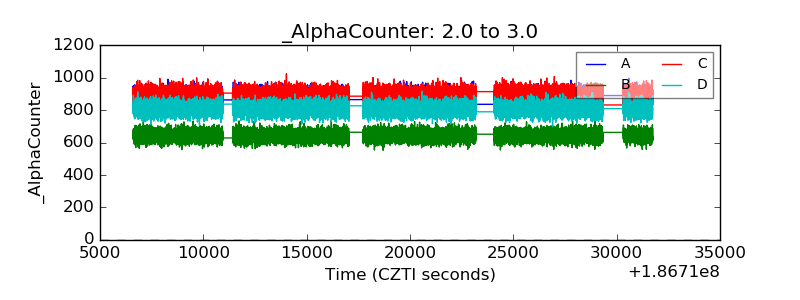 |
| _CPM_Rate | 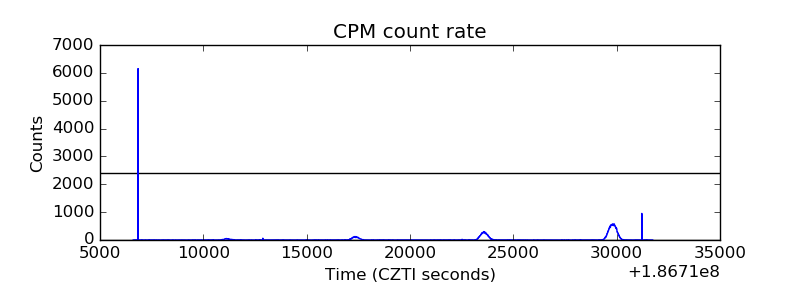 |
| CZT Counter | 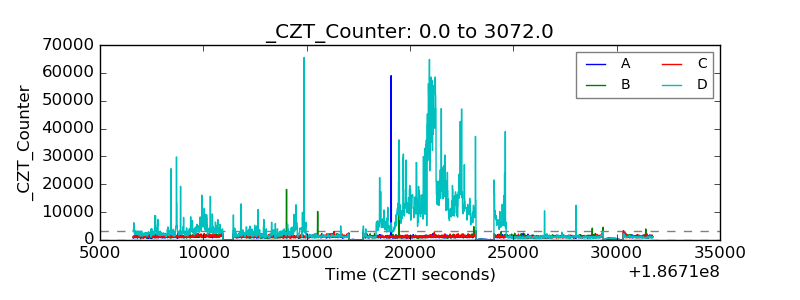 |
| +2.5 Volts monitor |  |
| +5 Volts monitor |  |
| _ROLL_ROT | 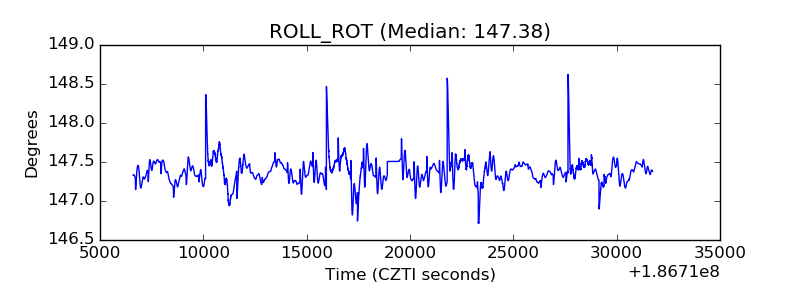 |
| _Roll_DEC |  |
| _Roll_RA | 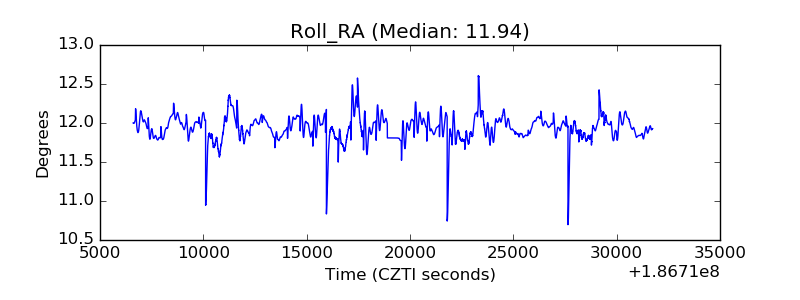 |
| Veto Counter | 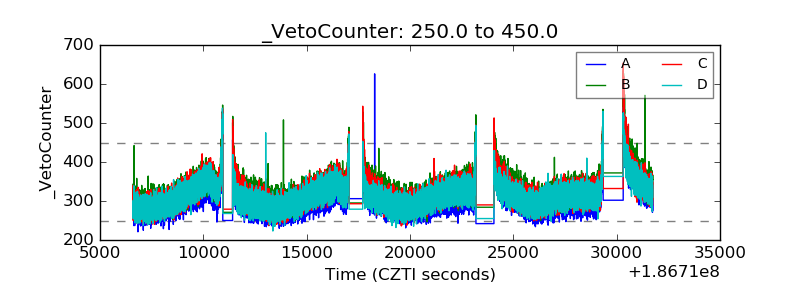 |