| Param | Original file | Final file |
|---|---|---|
| Filename | modeM0/AS1P01_998T01_9000000188_00967cztM0_level2.evt | modeM0/AS1P01_998T01_9000000188_00967cztM0_level2_quad_clean.evt |
| Size (bytes) | 987,183,360 | 89,075,520 |
| Size | 941.5 MB | 84.9 MB |
| Events in quadrant A | 6,893,391 | 599,433 |
| Events in quadrant B | 7,359,728 | 596,232 |
| Events in quadrant C | 7,081,539 | 574,009 |
| Events in quadrant D | 8,176,457 | 521,010 |
| Mode M0 | |||
|---|---|---|---|
| Quadrant | BADHDUFLAG | Total packets | Discarded packets |
| A | 0 | 24606 | 0 |
| B | 0 | 25981 | 0 |
| C | 0 | 25141 | 0 |
| D | 0 | 28535 | 0 |
| Mode M9 | |||
|---|---|---|---|
| Quadrant | BADHDUFLAG | Total packets | Discarded packets |
| A | 0 | 11 | 0 |
| B | 0 | 11 | 0 |
| C | 0 | 11 | 0 |
| D | 0 | 11 | 0 |
| Mode SS | |||
|---|---|---|---|
| Quadrant | BADHDUFLAG | Total packets | Discarded packets |
| A | 0 | 120 | 0 |
| B | 0 | 120 | 0 |
| C | 0 | 120 | 0 |
| D | 0 | 120 | 0 |
| Quadrant | Total seconds | Saturated seconds | Saturation percentage |
|---|---|---|---|
| A | 5811 | 17 | 0.292549% |
| B | 5810 | 35 | 0.602410% |
| C | 5810 | 9 | 0.154905% |
| D | 5811 | 765 | 13.164688% |
Noise dominated data is calculated using 1-second bins in cleaned event files. If a bin has >2000 counts, and if more than 50% of those come from <1% of pixels, then it is considered to be noise-dominated and hence unusable.
| Quadrant | # 1 sec bins | Bins with >0 counts | Bins with >2000 counts | High rate bins dominated by noise | Noise dominated (total time) | Noise dominated (detector-on time) | Marked lightcurve |
|---|---|---|---|---|---|---|---|
| A | 6931 | 5812 | 144 | 144 | 2.08% | 2.48% | 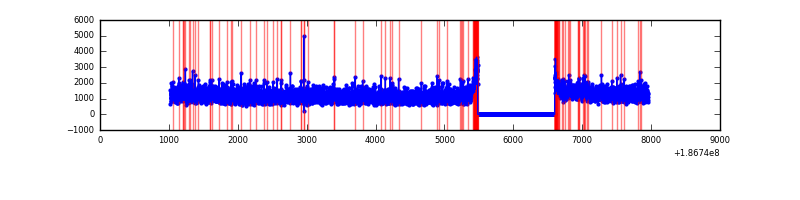 |
| B | 6930 | 5811 | 210 | 210 | 3.03% | 3.61% | 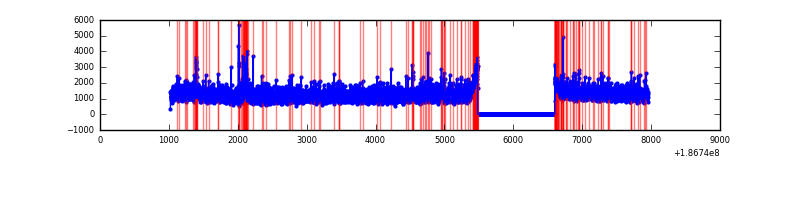 |
| C | 6930 | 5811 | 165 | 165 | 2.38% | 2.84% |  |
| D | 6931 | 5812 | 942 | 942 | 13.59% | 16.21% | 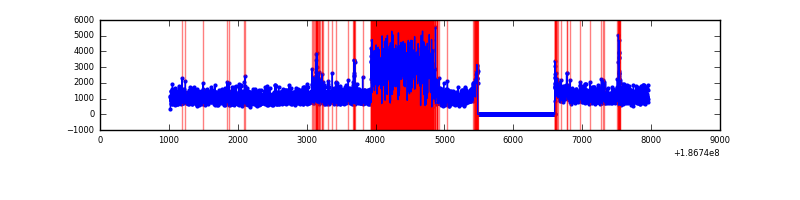 |
Top three noisy pixels from each quadrant. If the there are fewer than three noisy pixels in the level2.evt file, extra rows are filled as -1
| Pixel properties | Quadrant properties | ||||||
|---|---|---|---|---|---|---|---|
| Quadrant | DetID | PixID | Counts | Sigma | Mean | Median | Sigma |
| A | 12 | 189 | 8738 | 16.15 | 1791 | 1800 | 429.6 |
| A | 0 | 253 | 8071 | 14.6 | 1791 | 1800 | 429.6 |
| A | 11 | 79 | 7283 | 12.76 | 1791 | 1800 | 429.6 |
| B | 0 | 220 | 139605 | 319.02 | 1830 | 1841 | 431.8 |
| B | 5 | 249 | 86467 | 195.97 | 1830 | 1841 | 431.8 |
| B | 15 | 22 | 64572 | 145.27 | 1830 | 1841 | 431.8 |
| C | 15 | 241 | 259274 | 556.07 | 1672 | 1733 | 463.1 |
| C | 10 | 34 | 222628 | 476.94 | 1672 | 1733 | 463.1 |
| C | 9 | 52 | 34939 | 71.7 | 1672 | 1733 | 463.1 |
| D | 12 | 188 | 2199589 | 4663.47 | 1536 | 1591 | 471.3 |
| D | 1 | 4 | 117895 | 246.76 | 1536 | 1591 | 471.3 |
| D | 2 | 107 | 88080 | 183.5 | 1536 | 1591 | 471.3 |
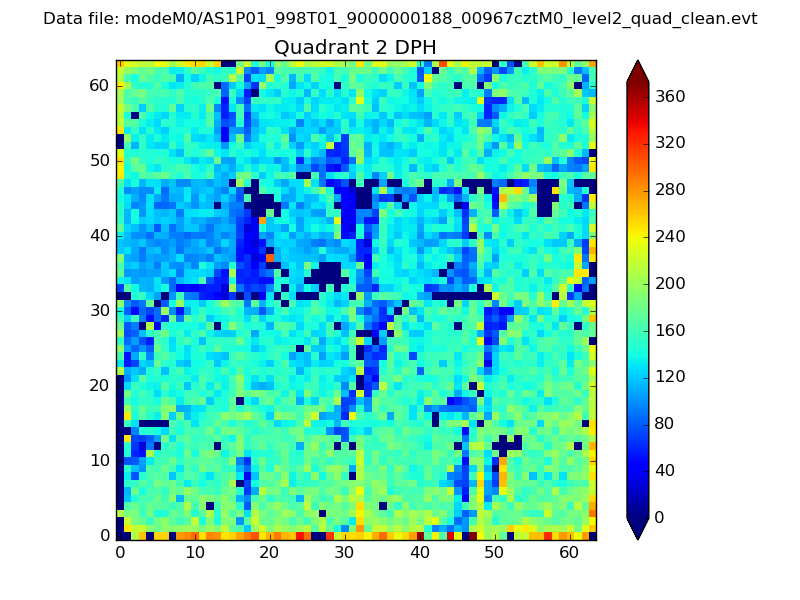
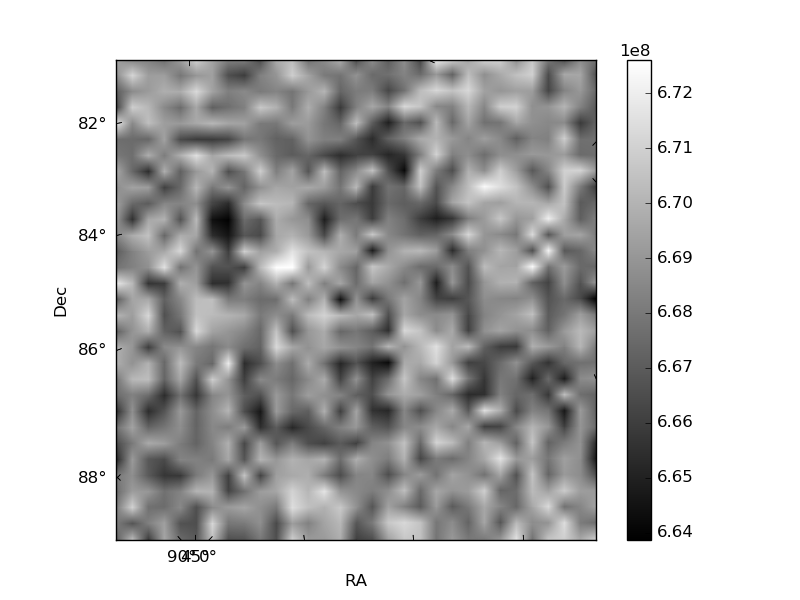
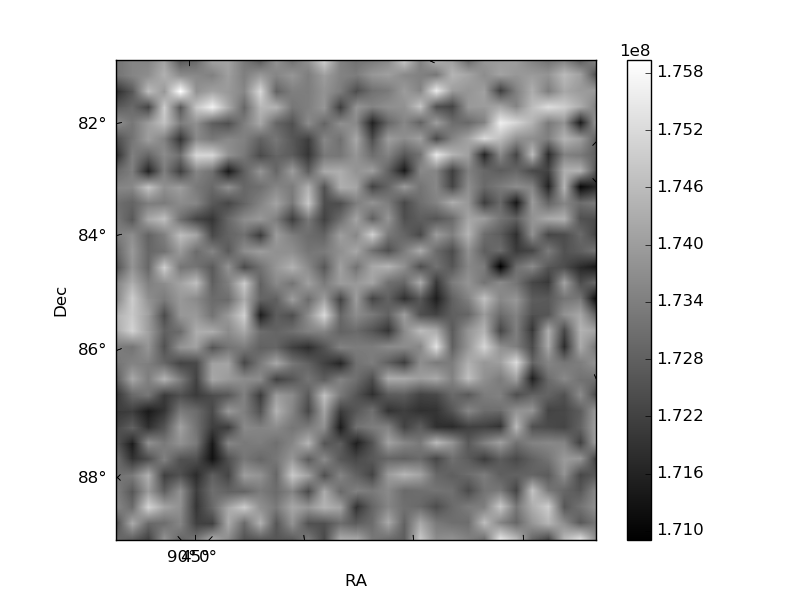
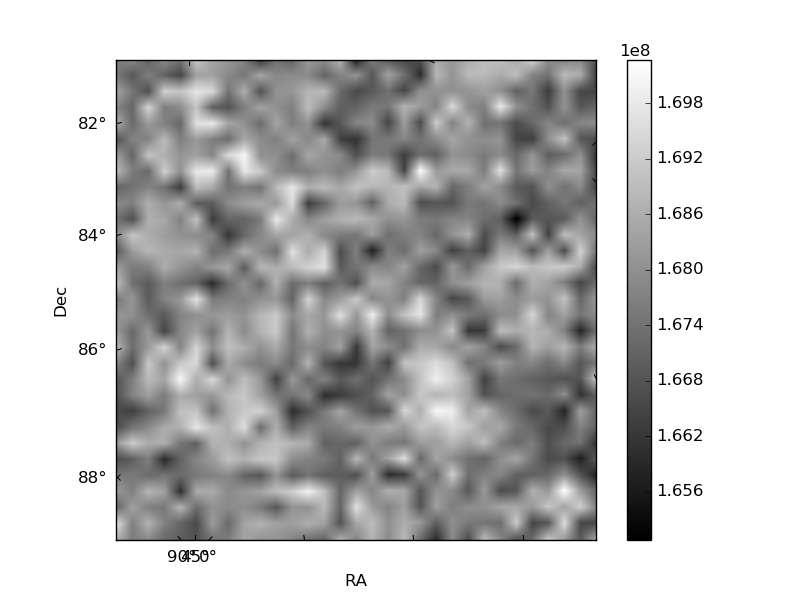
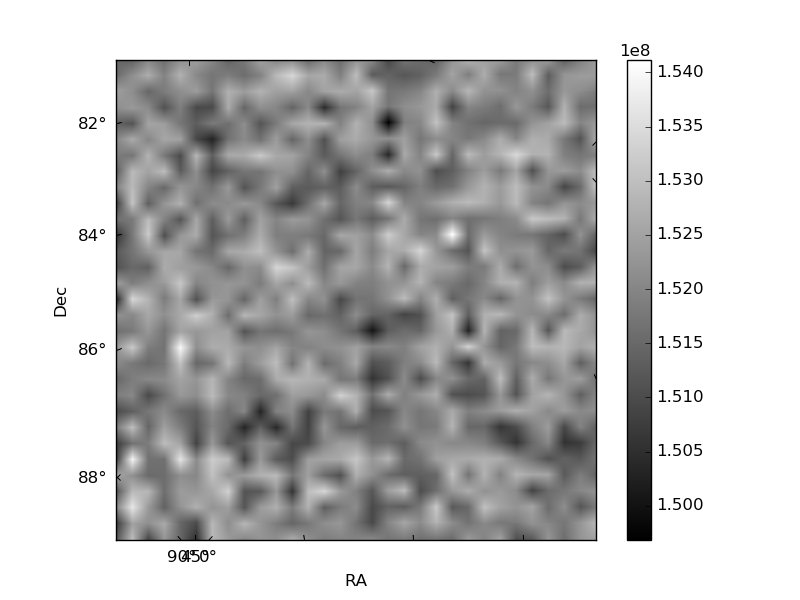
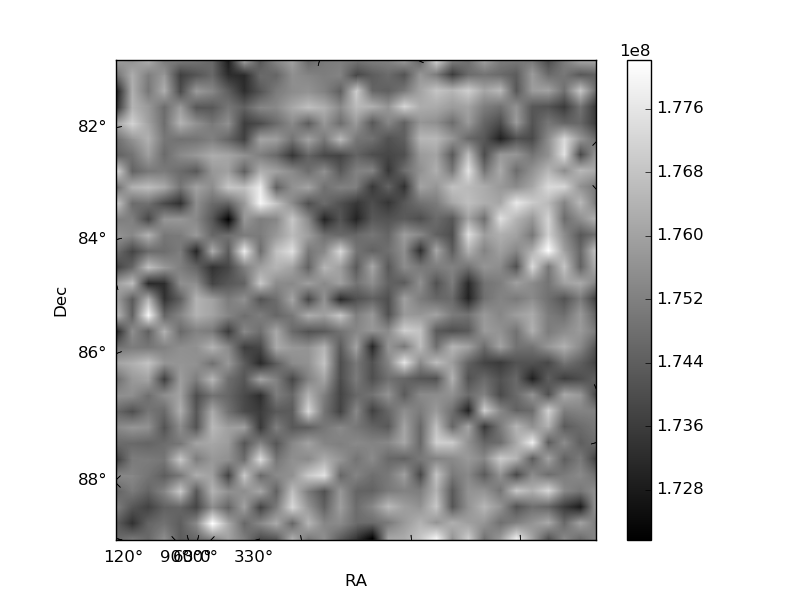
Histogram calculated using DETX and DETY for each event in the final _common_clean file
| Quadrant A | 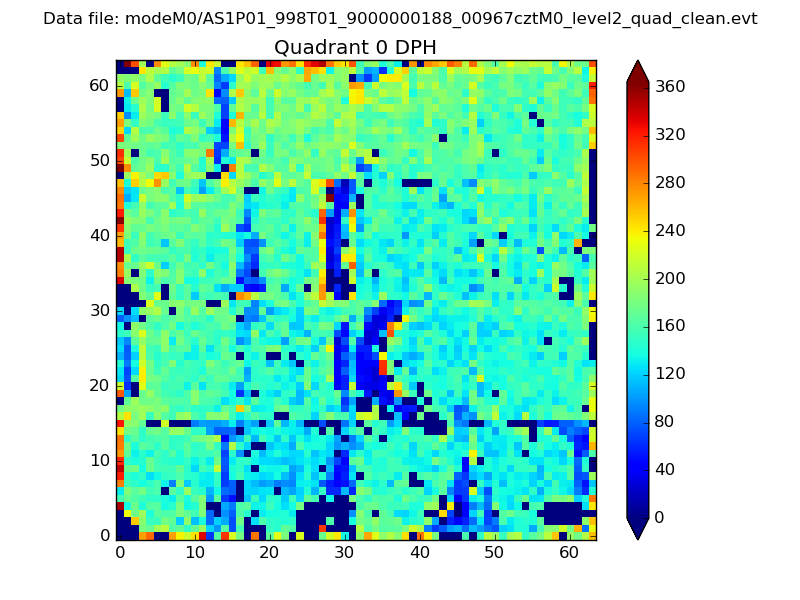 |
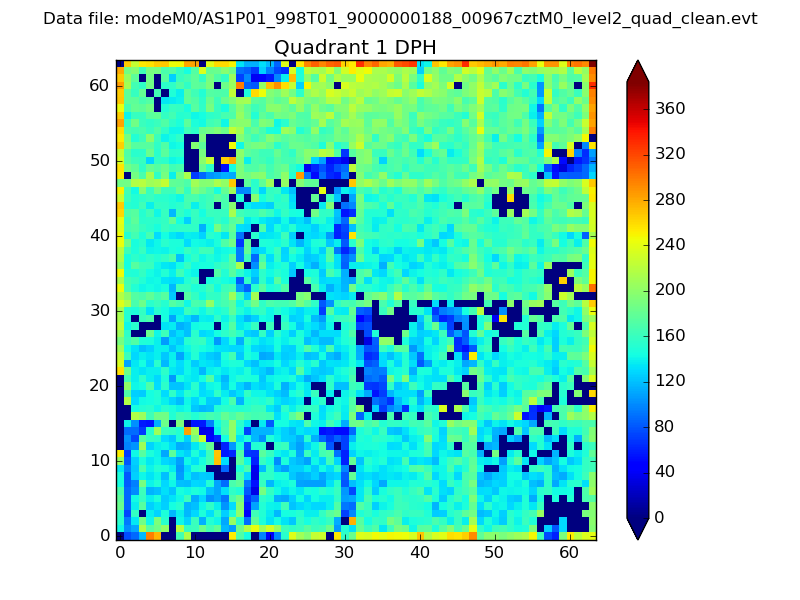 |
Quadrant B |
|---|---|---|---|
| Quadrant D | 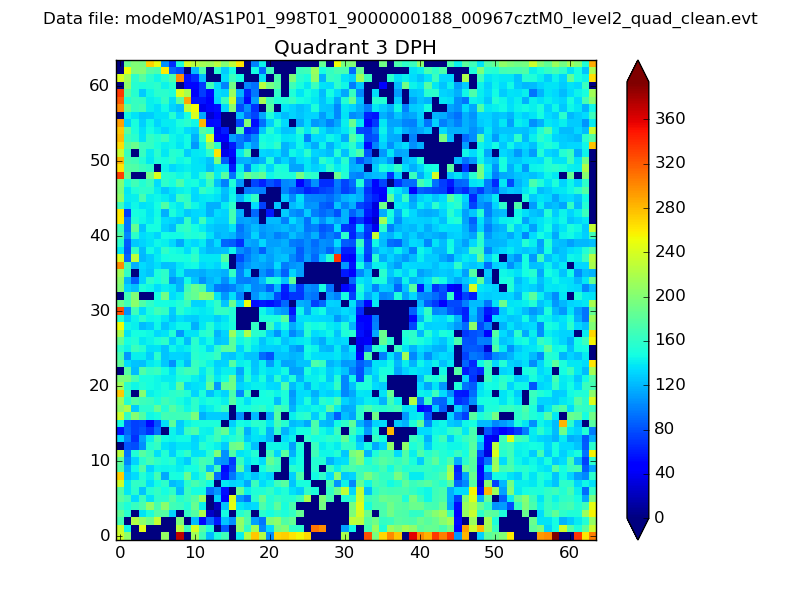 |
 |
Quadrant C |
| Plot type | Count rate plots | Images |
|---|---|---|
| Comparison with Poisson distribution Blue bars denote a histogram of data divided into 1 sec bins. Red curve is a Poisson curve with rate = median count rate of data. |
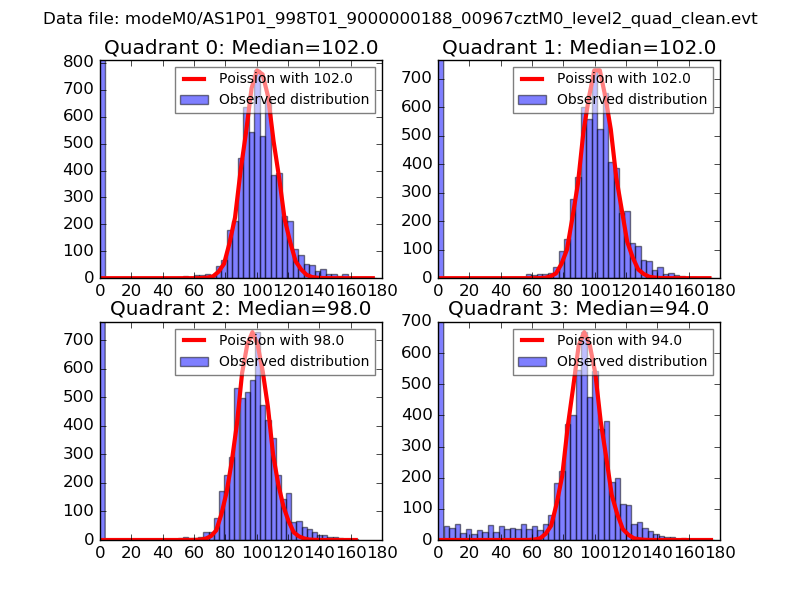 |
 |
| Quadrant-wise count rates Data is divided into 100 sec bins |
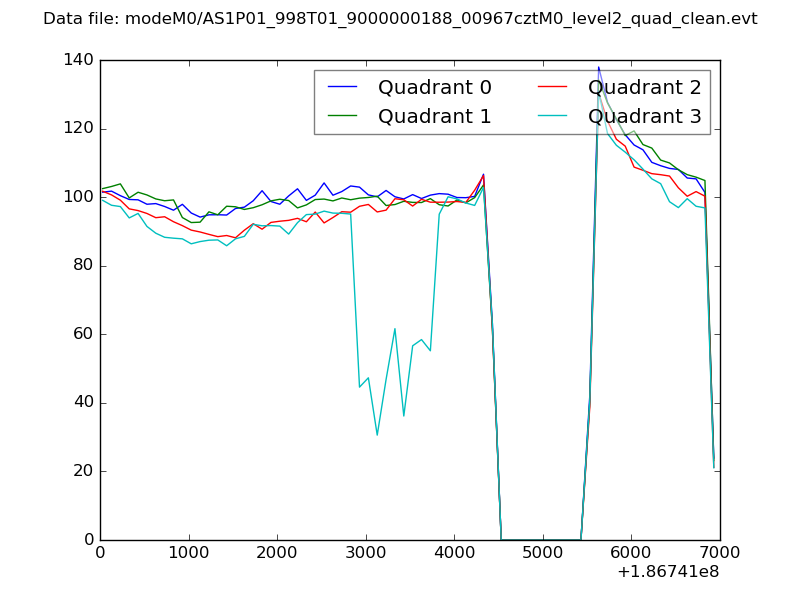 |
|
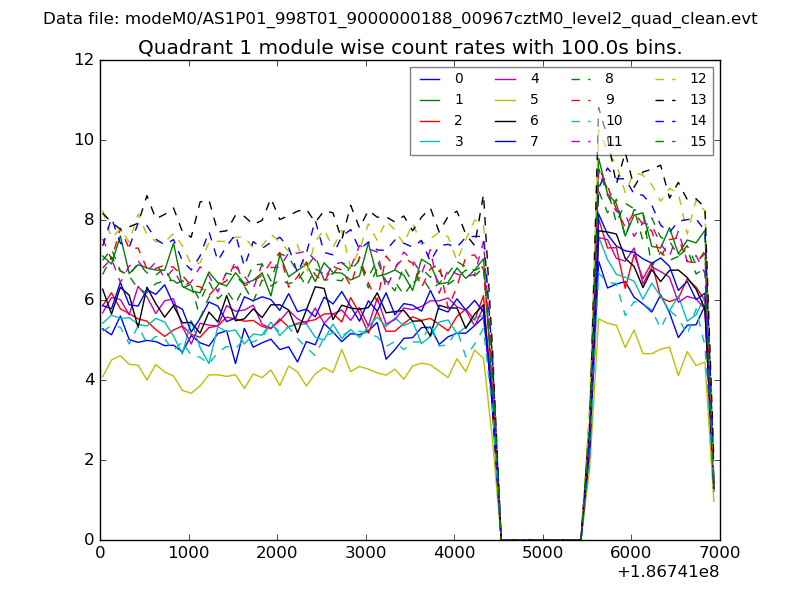
| Module-wise count rates for Quadrant A Data is divided into 100 sec bins |
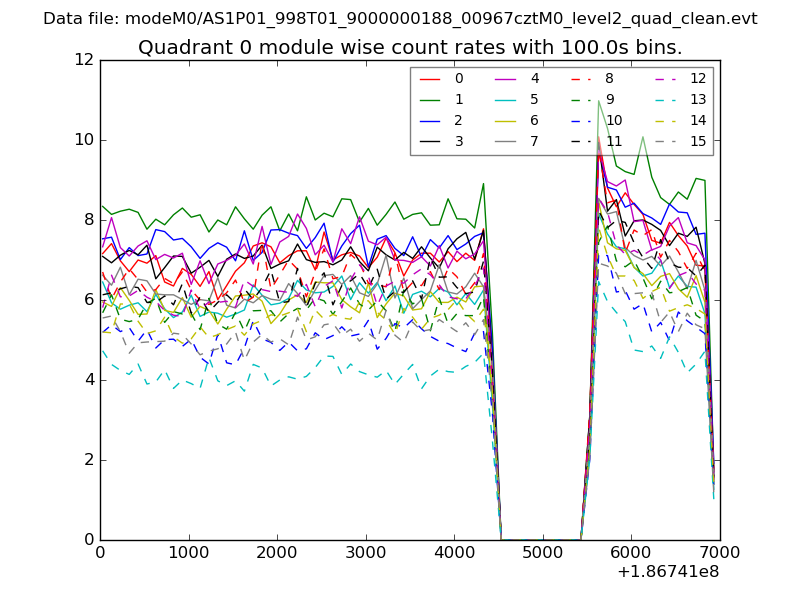 |
 |
| Module-wise count rates for Quadrant B Data is divided into 100 sec bins |
 |
 |
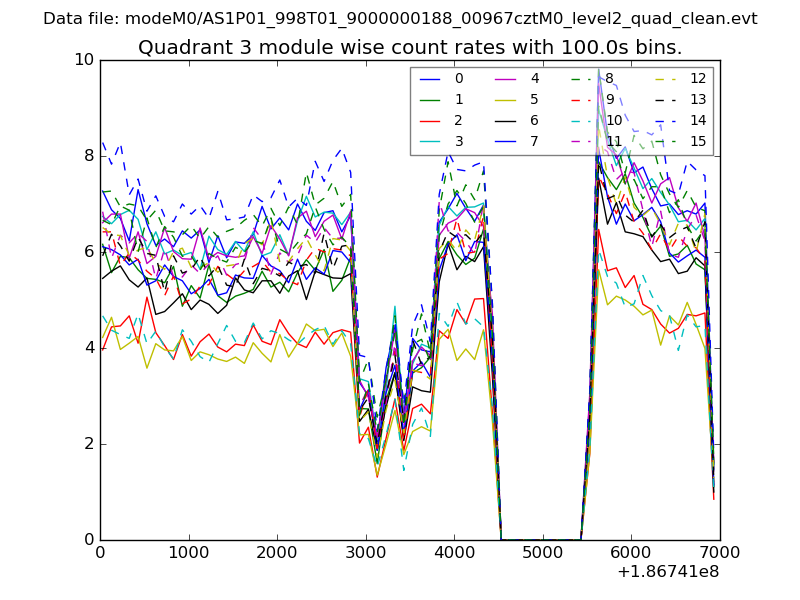
| Module-wise count rates for Quadrant C Data is divided into 100 sec bins |
 |
 |
| Module-wise count rates for Quadrant D Data is divided into 100 sec bins |
 |
 |
| Parameter | Plot |
|---|---|
| CZT HV Monitor | 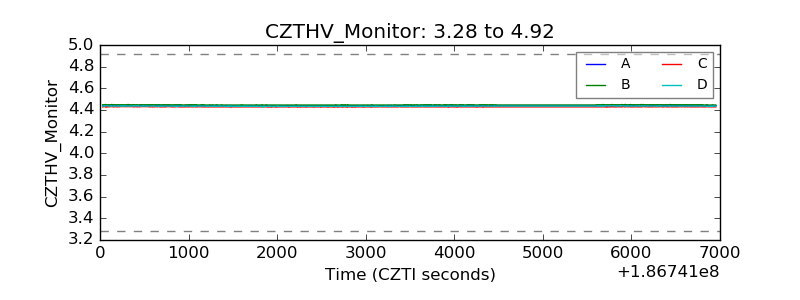 |
| D_VDD | 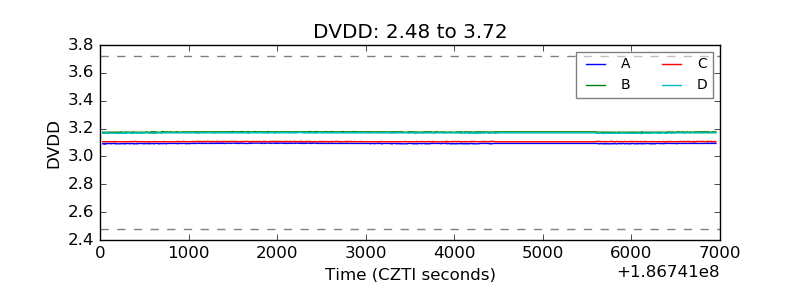 |
| Temperature 1 | 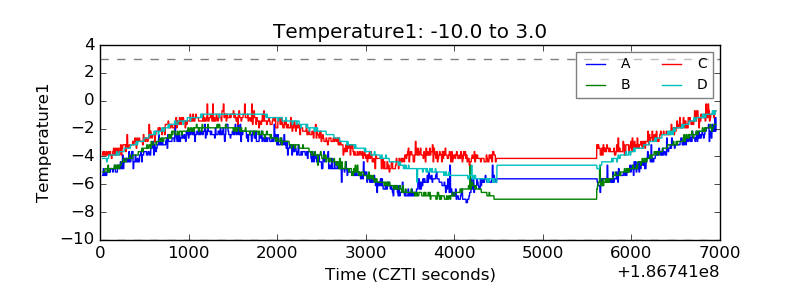 |
| Veto HV Monitor |  |
| Veto LLD | 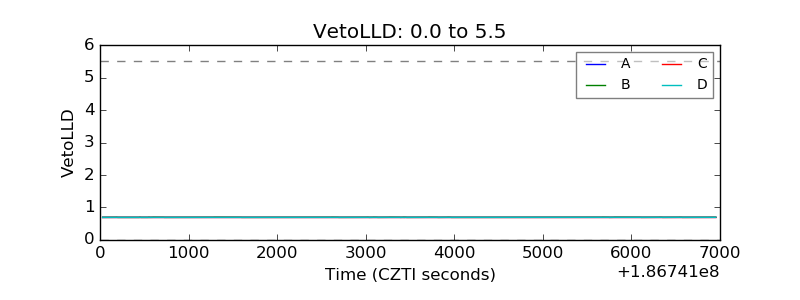 |
| Alpha Counter | 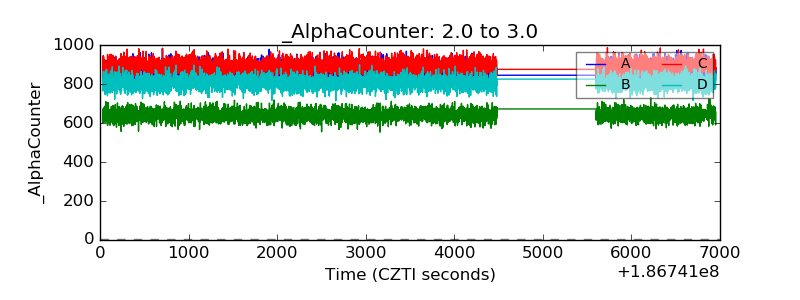 |
| _CPM_Rate | 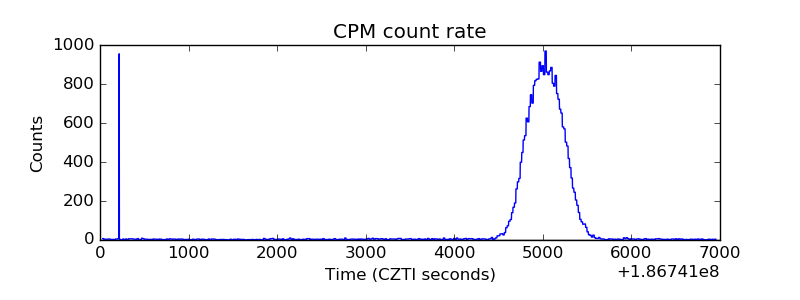 |
| CZT Counter | 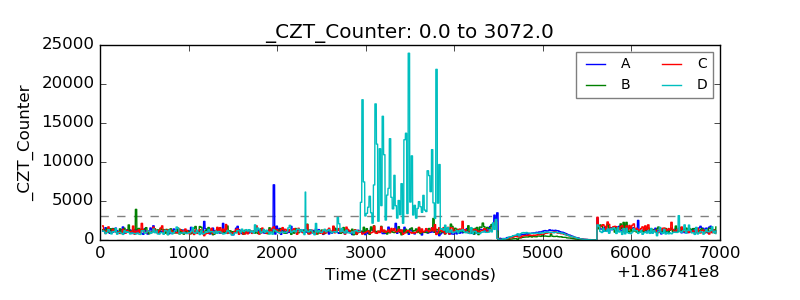 |
| +2.5 Volts monitor |  |
| +5 Volts monitor |  |
| _ROLL_ROT | 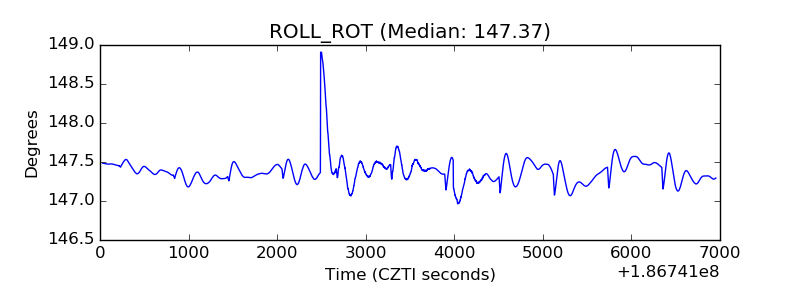 |
| _Roll_DEC |  |
| _Roll_RA | 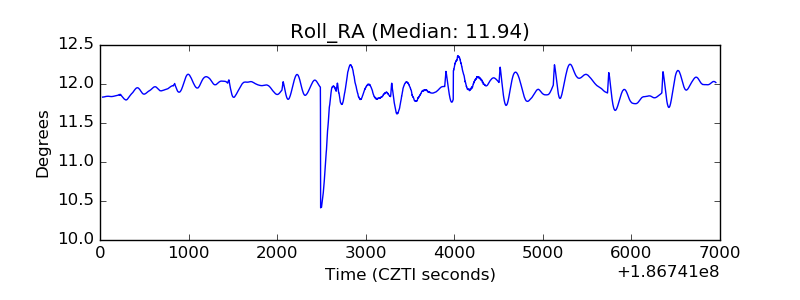 |
| Veto Counter | 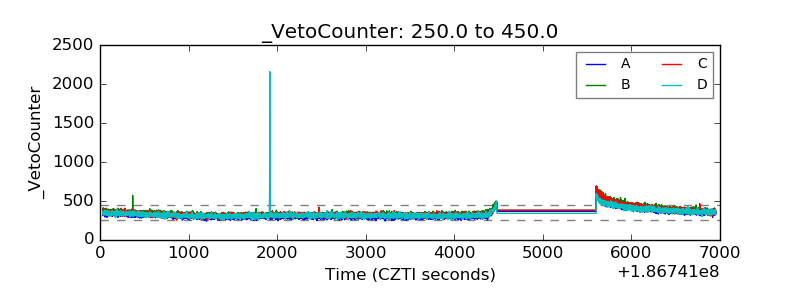 |