| Param | Original file | Final file |
|---|---|---|
| Filename | modeM0/AS1P01_998T01_9000000188_00970cztM0_level2.evt | modeM0/AS1P01_998T01_9000000188_00970cztM0_level2_quad_clean.evt |
| Size (bytes) | 1,044,815,040 | 87,609,600 |
| Size | 996.4 MB | 83.6 MB |
| Events in quadrant A | 6,612,087 | 605,235 |
| Events in quadrant B | 7,488,329 | 597,933 |
| Events in quadrant C | 6,862,373 | 588,102 |
| Events in quadrant D | 10,304,368 | 464,999 |
| Mode M0 | |||
|---|---|---|---|
| Quadrant | BADHDUFLAG | Total packets | Discarded packets |
| A | 0 | 23656 | 0 |
| B | 0 | 26271 | 0 |
| C | 0 | 24392 | 0 |
| D | 0 | 34884 | 0 |
| Mode M9 | |||
|---|---|---|---|
| Quadrant | BADHDUFLAG | Total packets | Discarded packets |
| A | 0 | 13 | 0 |
| B | 0 | 13 | 0 |
| C | 0 | 13 | 0 |
| D | 0 | 13 | 0 |
| Mode SS | |||
|---|---|---|---|
| Quadrant | BADHDUFLAG | Total packets | Discarded packets |
| A | 0 | 114 | 0 |
| B | 0 | 114 | 0 |
| C | 0 | 114 | 0 |
| D | 0 | 114 | 0 |
| Quadrant | Total seconds | Saturated seconds | Saturation percentage |
|---|---|---|---|
| A | 5668 | 11 | 0.194072% |
| B | 5668 | 48 | 0.846860% |
| C | 5669 | 13 | 0.229317% |
| D | 5669 | 1586 | 27.976715% |
Noise dominated data is calculated using 1-second bins in cleaned event files. If a bin has >2000 counts, and if more than 50% of those come from <1% of pixels, then it is considered to be noise-dominated and hence unusable.
| Quadrant | # 1 sec bins | Bins with >0 counts | Bins with >2000 counts | High rate bins dominated by noise | Noise dominated (total time) | Noise dominated (detector-on time) | Marked lightcurve |
|---|---|---|---|---|---|---|---|
| A | 6938 | 5669 | 175 | 175 | 2.52% | 3.09% | 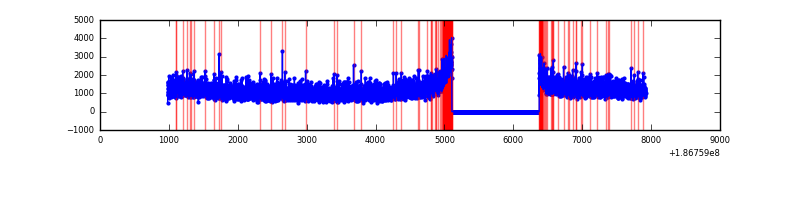 |
| B | 6938 | 5669 | 359 | 359 | 5.17% | 6.33% | 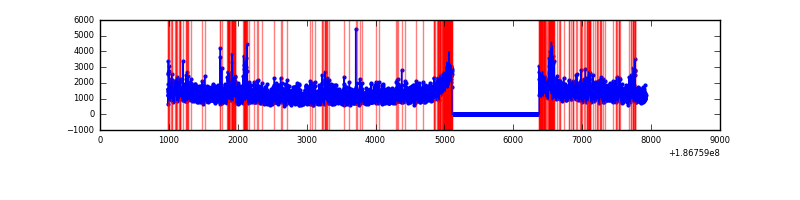 |
| C | 6939 | 5670 | 155 | 155 | 2.23% | 2.73% | 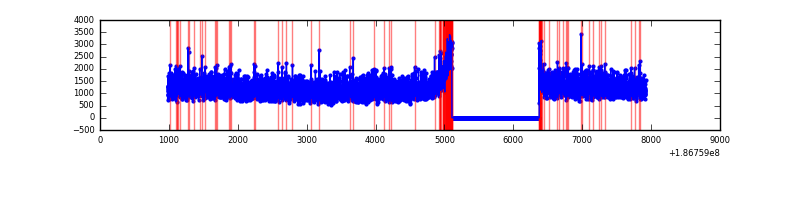 |
| D | 6939 | 5670 | 1826 | 1826 | 26.32% | 32.20% |  |
Top three noisy pixels from each quadrant. If the there are fewer than three noisy pixels in the level2.evt file, extra rows are filled as -1
| Pixel properties | Quadrant properties | ||||||
|---|---|---|---|---|---|---|---|
| Quadrant | DetID | PixID | Counts | Sigma | Mean | Median | Sigma |
| A | 12 | 189 | 5986 | 10.36 | 1721 | 1728 | 410.9 |
| A | 11 | 79 | 5904 | 10.16 | 1721 | 1728 | 410.9 |
| A | 10 | 133 | 5322 | 8.75 | 1721 | 1728 | 410.9 |
| B | 0 | 220 | 271038 | 646.22 | 1794 | 1796 | 416.6 |
| B | 5 | 191 | 81698 | 191.78 | 1794 | 1796 | 416.6 |
| B | 5 | 249 | 78102 | 183.15 | 1794 | 1796 | 416.6 |
| C | 15 | 241 | 280176 | 607.1 | 1663 | 1723 | 458.7 |
| C | 3 | 79 | 32393 | 66.87 | 1663 | 1723 | 458.7 |
| C | 3 | 111 | 27797 | 56.85 | 1663 | 1723 | 458.7 |
| D | 12 | 188 | 4834982 | 11419.43 | 1383 | 1432 | 423.3 |
| D | 1 | 4 | 198203 | 464.88 | 1383 | 1432 | 423.3 |
| D | 13 | 73 | 25155 | 56.05 | 1383 | 1432 | 423.3 |
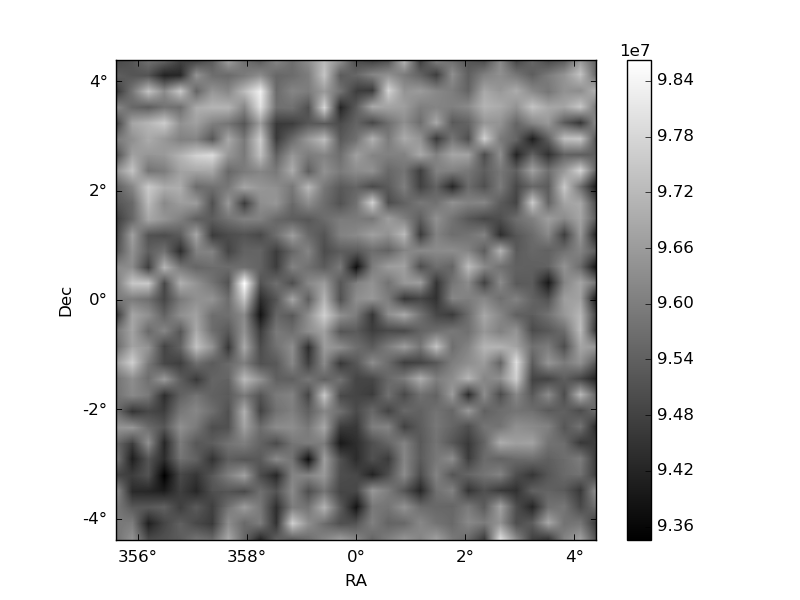
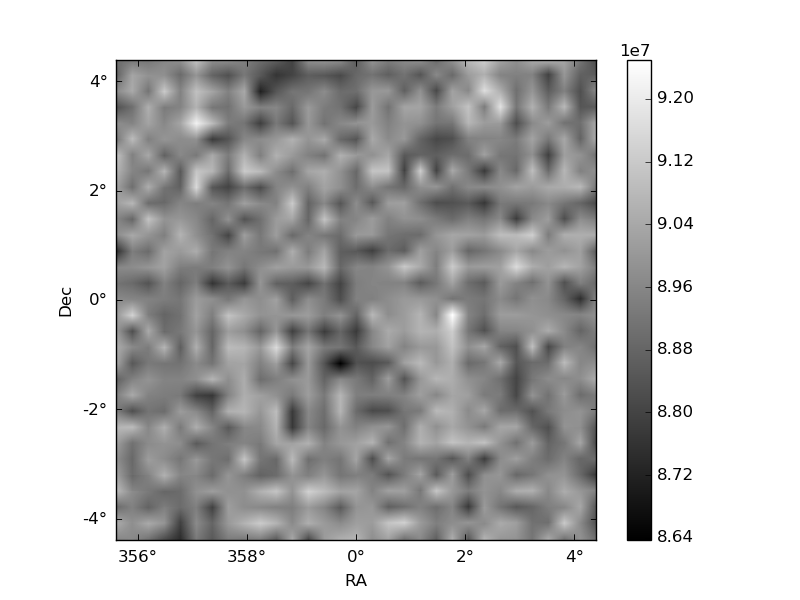
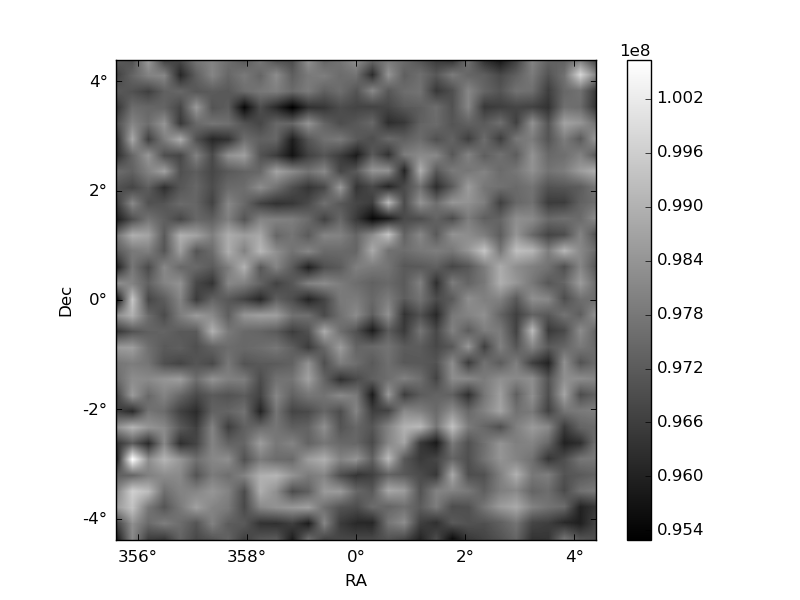
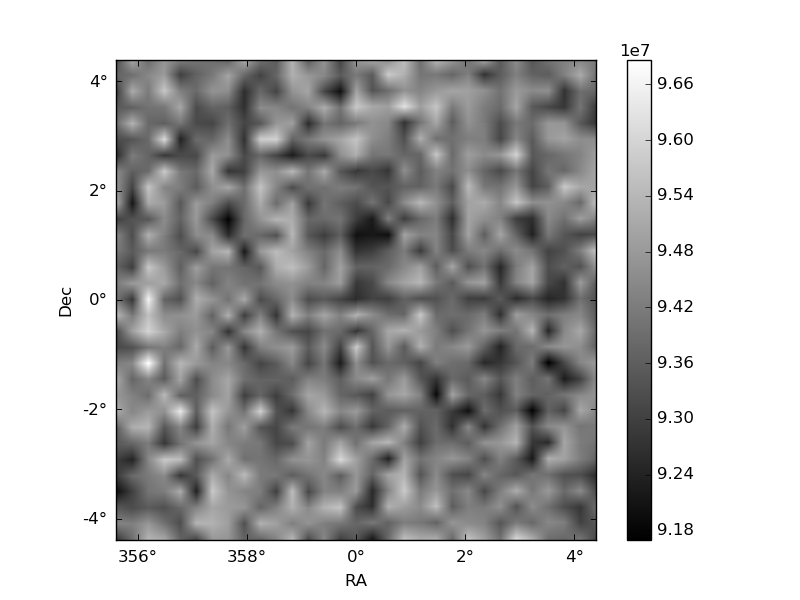
Histogram calculated using DETX and DETY for each event in the final _common_clean file
| Quadrant A | 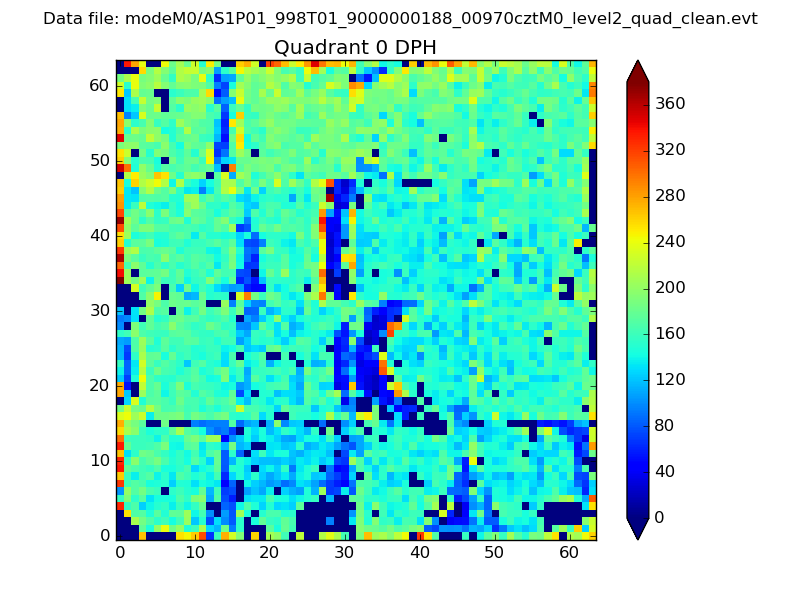 |
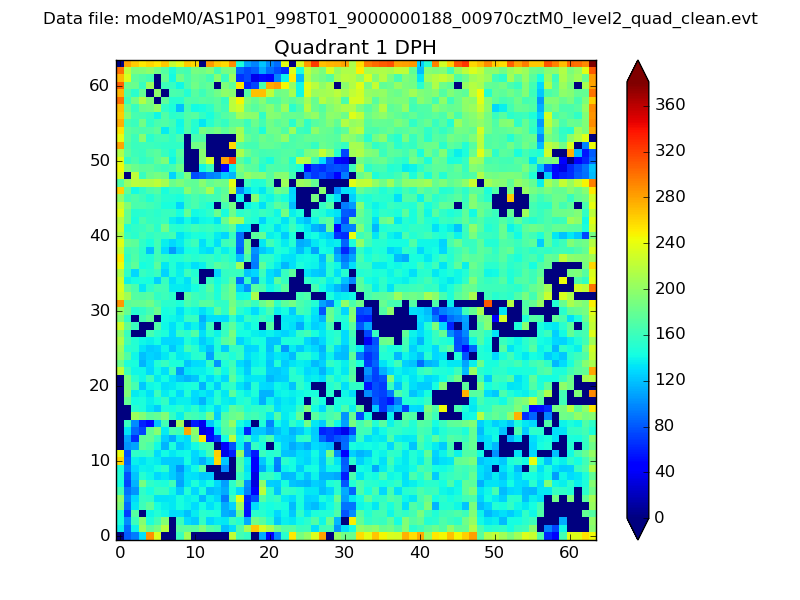 |
Quadrant B |
|---|---|---|---|
| Quadrant D | 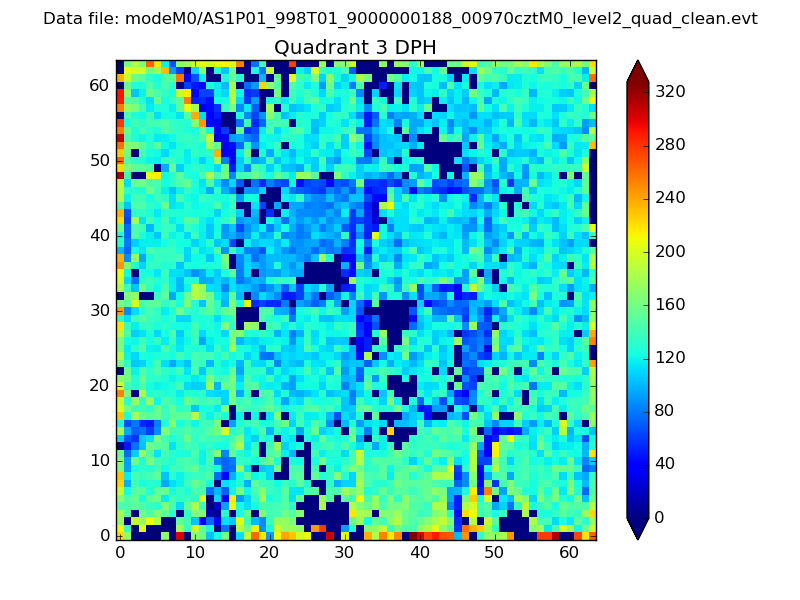 |
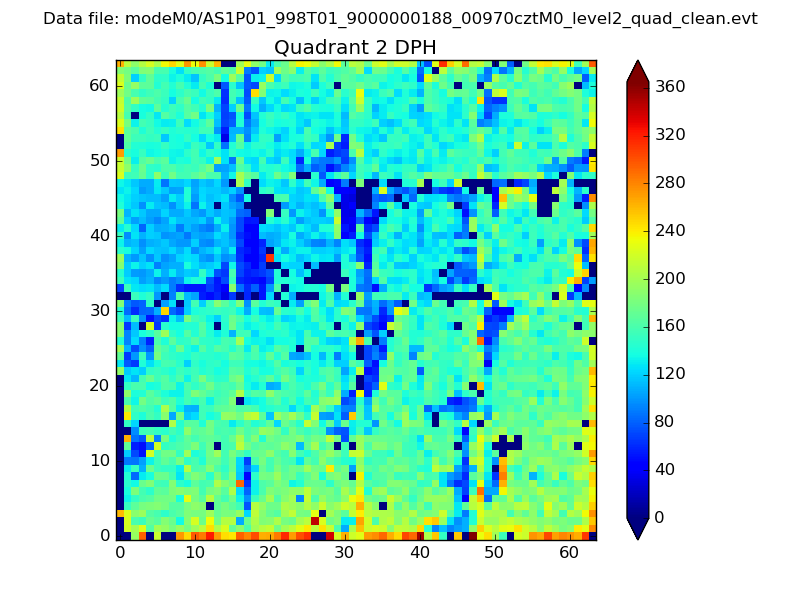 |
Quadrant C |
| Plot type | Count rate plots | Images |
|---|---|---|
| Comparison with Poisson distribution Blue bars denote a histogram of data divided into 1 sec bins. Red curve is a Poisson curve with rate = median count rate of data. |
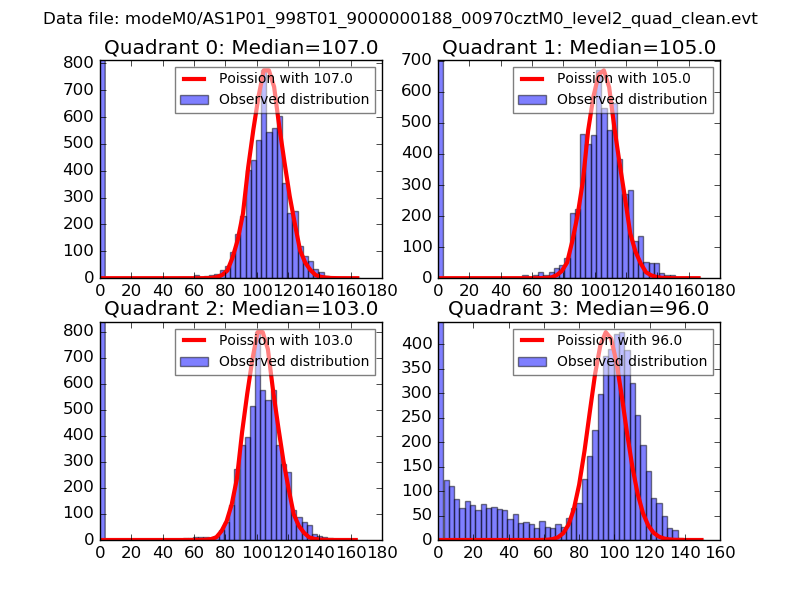 |
 |
| Quadrant-wise count rates Data is divided into 100 sec bins |
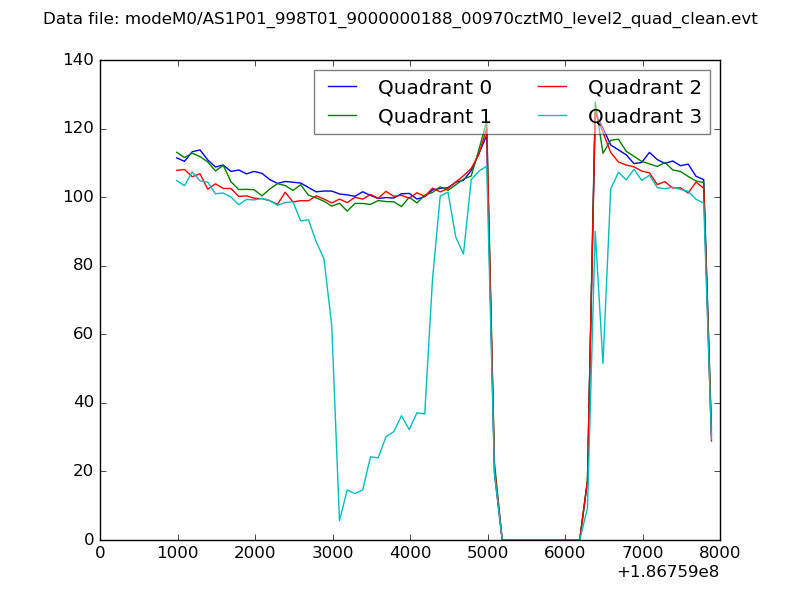 |
|
| Module-wise count rates for Quadrant A Data is divided into 100 sec bins |
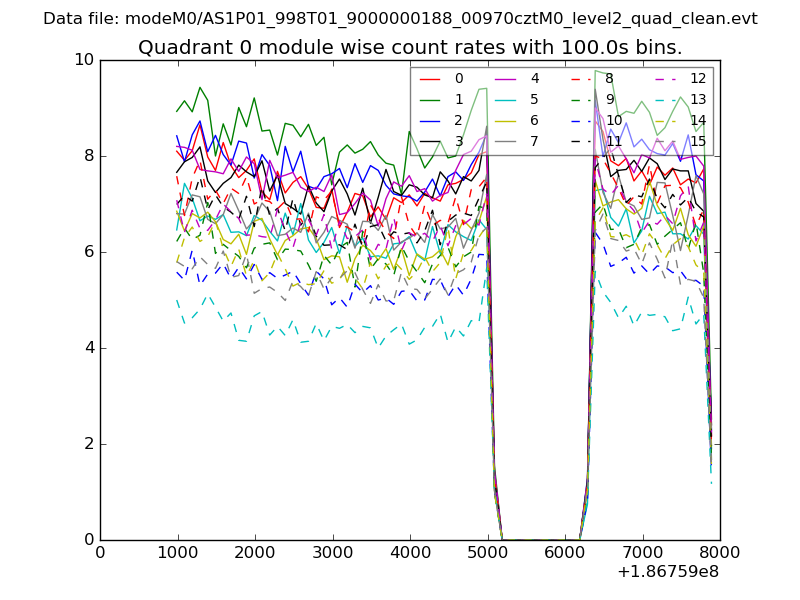 |
 |
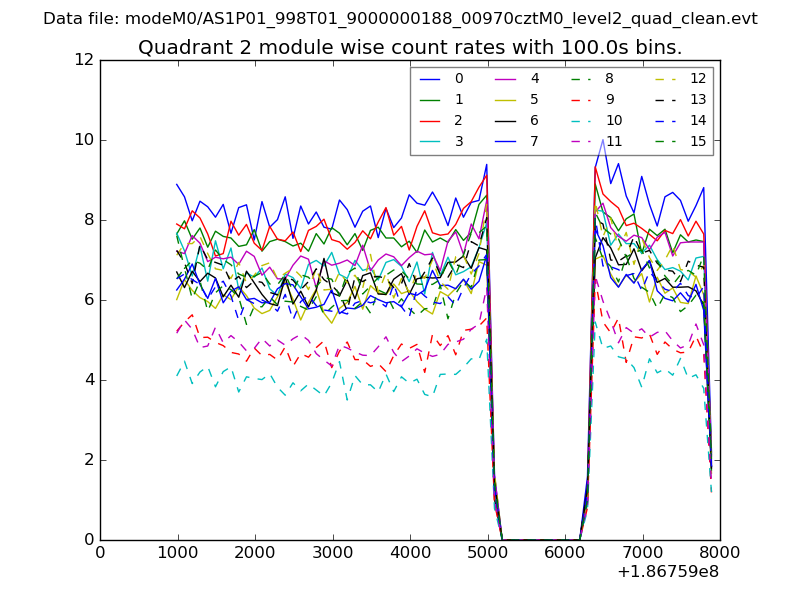
| Module-wise count rates for Quadrant B Data is divided into 100 sec bins |
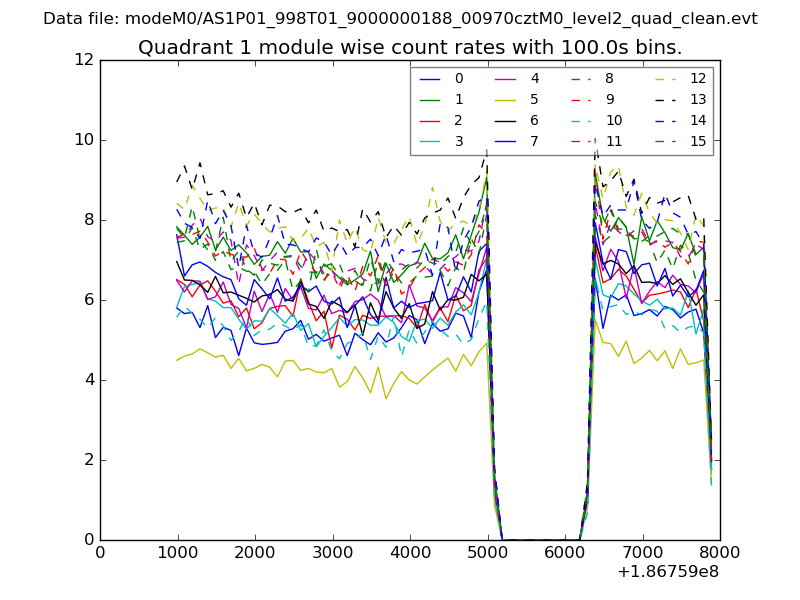 |
 |
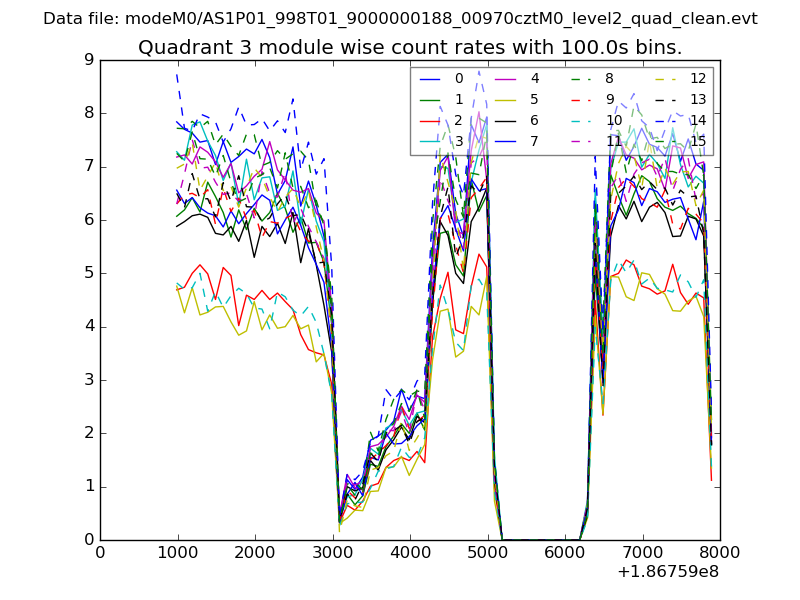
| Module-wise count rates for Quadrant C Data is divided into 100 sec bins |
 |
 |
| Module-wise count rates for Quadrant D Data is divided into 100 sec bins |
 |
 |
| Parameter | Plot |
|---|---|
| CZT HV Monitor | 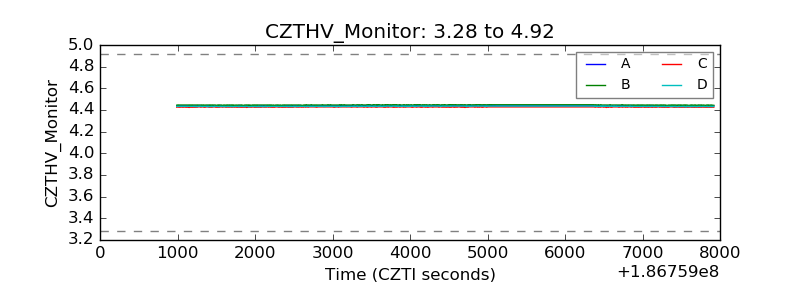 |
| D_VDD |  |
| Temperature 1 | 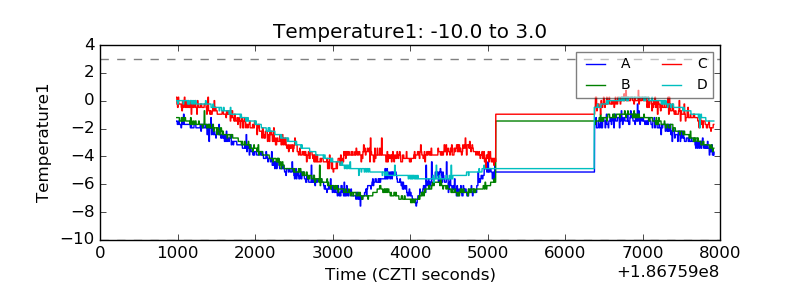 |
| Veto HV Monitor |  |
| Veto LLD | 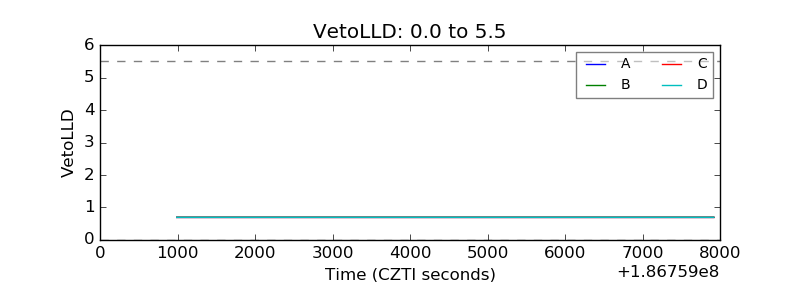 |
| Alpha Counter | 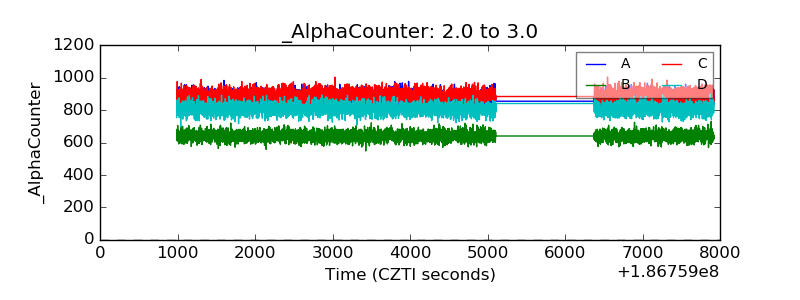 |
| _CPM_Rate | 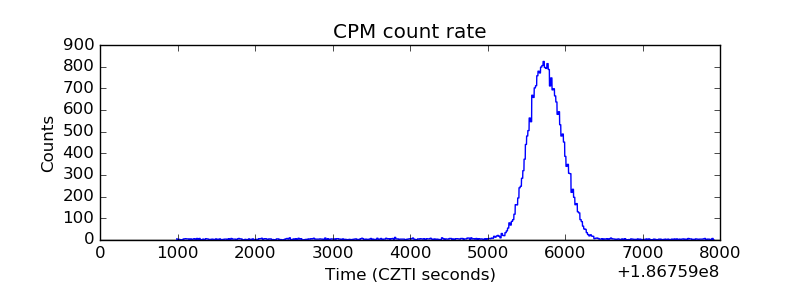 |
| CZT Counter | 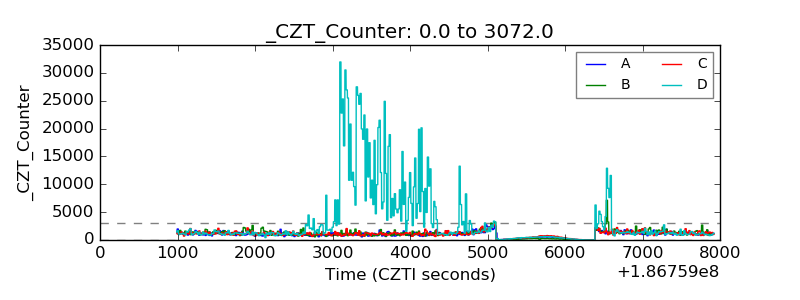 |
| +2.5 Volts monitor |  |
| +5 Volts monitor |  |
| _ROLL_ROT | 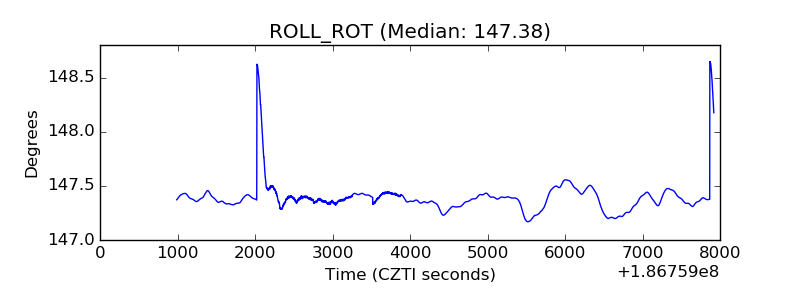 |
| _Roll_DEC | 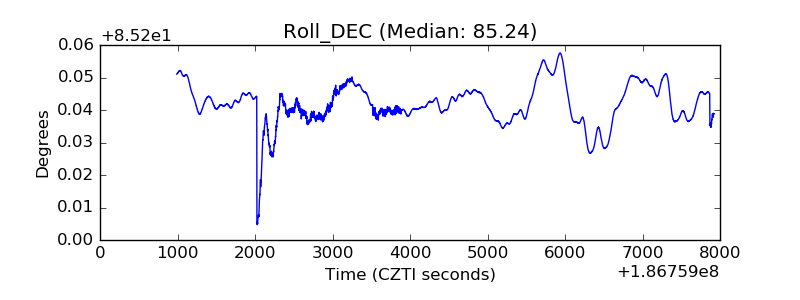 |
| _Roll_RA |  |
| Veto Counter | 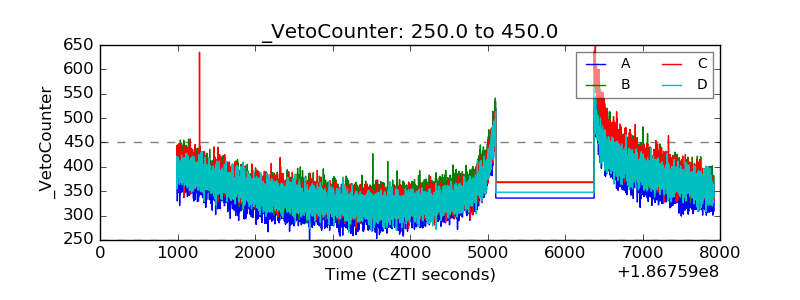 |