| Param | Original file | Final file |
|---|---|---|
| Filename | modeM0/AS1P01_998T01_9000000188_00971cztM0_level2.evt | modeM0/AS1P01_998T01_9000000188_00971cztM0_level2_quad_clean.evt |
| Size (bytes) | 960,433,920 | 94,602,240 |
| Size | 915.9 MB | 90.2 MB |
| Events in quadrant A | 6,983,235 | 624,093 |
| Events in quadrant B | 7,641,389 | 617,956 |
| Events in quadrant C | 7,225,102 | 604,670 |
| Events in quadrant D | 6,838,583 | 598,859 |
| Mode M0 | |||
|---|---|---|---|
| Quadrant | BADHDUFLAG | Total packets | Discarded packets |
| A | 0 | 25034 | 0 |
| B | 0 | 26945 | 0 |
| C | 0 | 25687 | 0 |
| D | 0 | 24585 | 0 |
| Mode M9 | |||
|---|---|---|---|
| Quadrant | BADHDUFLAG | Total packets | Discarded packets |
| A | 0 | 11 | 0 |
| B | 0 | 11 | 0 |
| C | 0 | 11 | 0 |
| D | 0 | 11 | 0 |
| Mode SS | |||
|---|---|---|---|
| Quadrant | BADHDUFLAG | Total packets | Discarded packets |
| A | 0 | 124 | 0 |
| B | 0 | 124 | 0 |
| C | 0 | 124 | 0 |
| D | 0 | 124 | 0 |
| Quadrant | Total seconds | Saturated seconds | Saturation percentage |
|---|---|---|---|
| A | 5998 | 3 | 0.050017% |
| B | 5998 | 19 | 0.316772% |
| C | 5999 | 23 | 0.383397% |
| D | 5999 | 15 | 0.250042% |
Noise dominated data is calculated using 1-second bins in cleaned event files. If a bin has >2000 counts, and if more than 50% of those come from <1% of pixels, then it is considered to be noise-dominated and hence unusable.
| Quadrant | # 1 sec bins | Bins with >0 counts | Bins with >2000 counts | High rate bins dominated by noise | Noise dominated (total time) | Noise dominated (detector-on time) | Marked lightcurve |
|---|---|---|---|---|---|---|---|
| A | 7123 | 5999 | 176 | 176 | 2.47% | 2.93% | 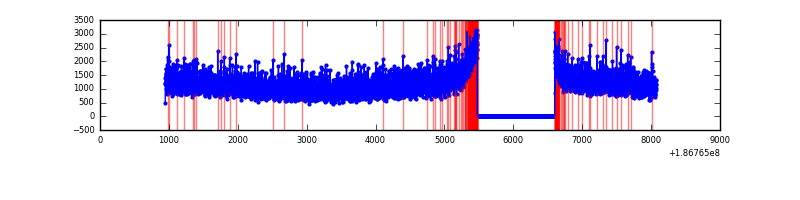 |
| B | 7123 | 5999 | 285 | 285 | 4.00% | 4.75% | 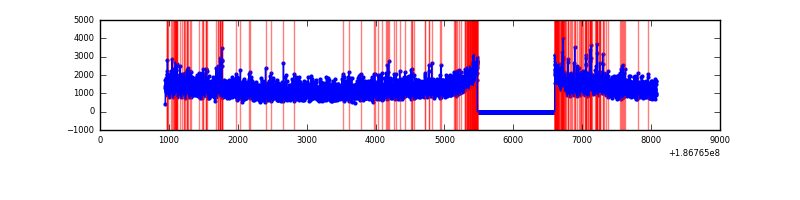 |
| C | 7124 | 6000 | 172 | 172 | 2.41% | 2.87% | 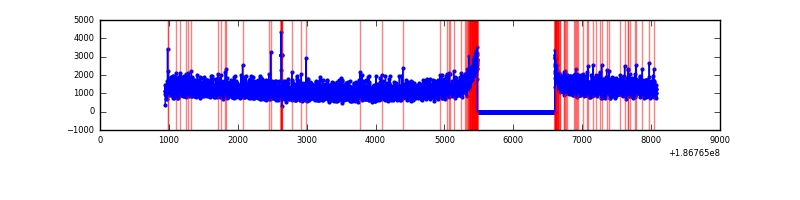 |
| D | 7124 | 6000 | 188 | 188 | 2.64% | 3.13% | 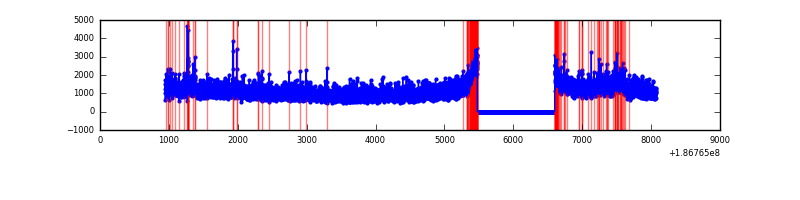 |
Top three noisy pixels from each quadrant. If the there are fewer than three noisy pixels in the level2.evt file, extra rows are filled as -1
| Pixel properties | Quadrant properties | ||||||
|---|---|---|---|---|---|---|---|
| Quadrant | DetID | PixID | Counts | Sigma | Mean | Median | Sigma |
| A | 12 | 189 | 8924 | 16.35 | 1813 | 1822 | 434.5 |
| A | 11 | 242 | 7086 | 12.12 | 1813 | 1822 | 434.5 |
| A | 11 | 79 | 6850 | 11.57 | 1813 | 1822 | 434.5 |
| B | 0 | 220 | 115537 | 255.61 | 1897 | 1900 | 444.6 |
| B | 7 | 221 | 104283 | 230.29 | 1897 | 1900 | 444.6 |
| B | 8 | 234 | 97510 | 215.06 | 1897 | 1900 | 444.6 |
| C | 15 | 241 | 257752 | 527.45 | 1754 | 1816 | 485.2 |
| C | 9 | 52 | 36871 | 72.24 | 1754 | 1816 | 485.2 |
| C | 3 | 79 | 31204 | 60.57 | 1754 | 1816 | 485.2 |
| D | 1 | 4 | 384322 | 736.98 | 1704 | 1761 | 519.1 |
| D | 13 | 73 | 32728 | 59.66 | 1704 | 1761 | 519.1 |
| D | 2 | 63 | 15482 | 26.43 | 1704 | 1761 | 519.1 |
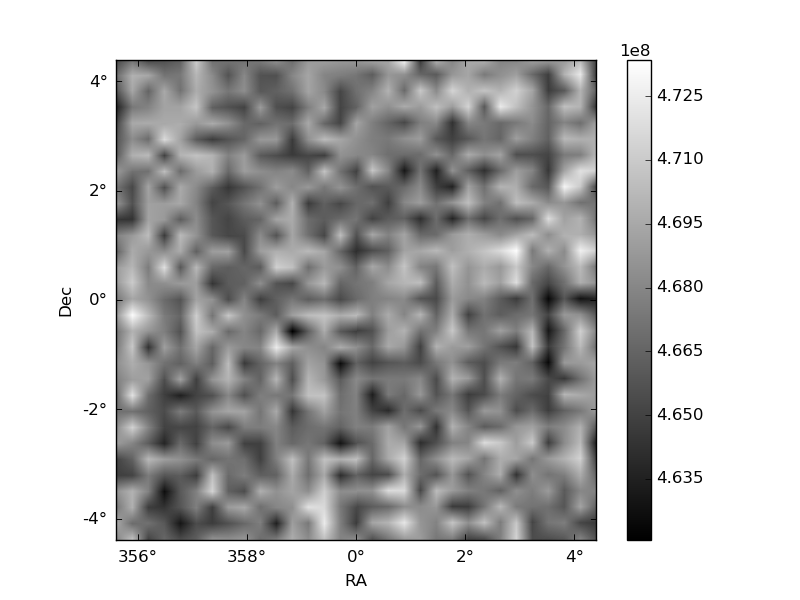
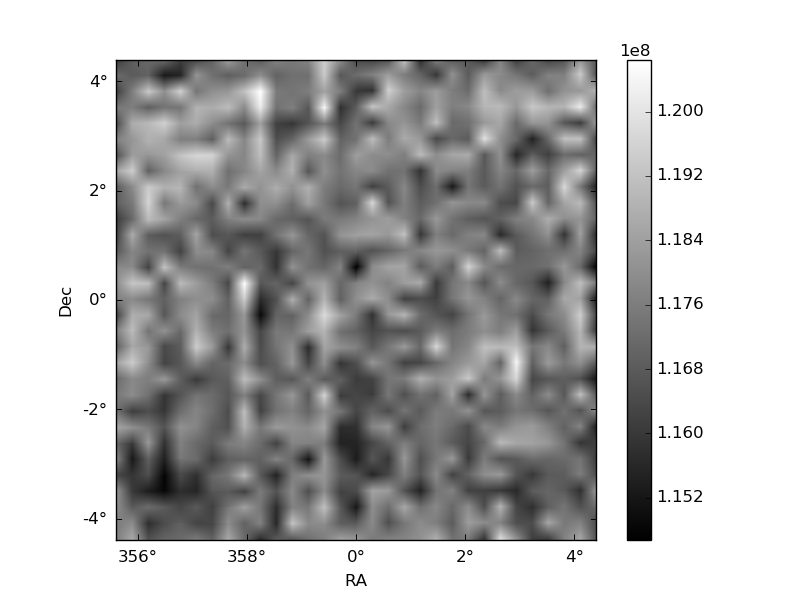
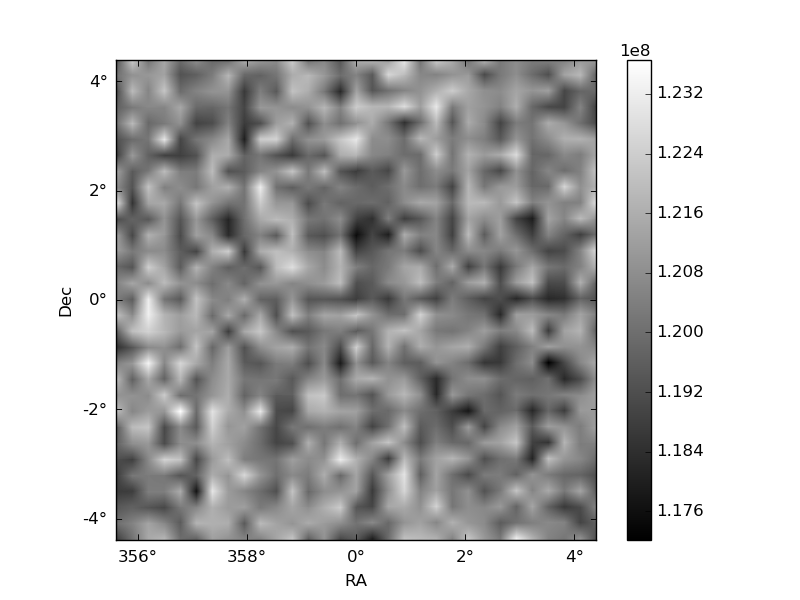
Histogram calculated using DETX and DETY for each event in the final _common_clean file
| Quadrant A | 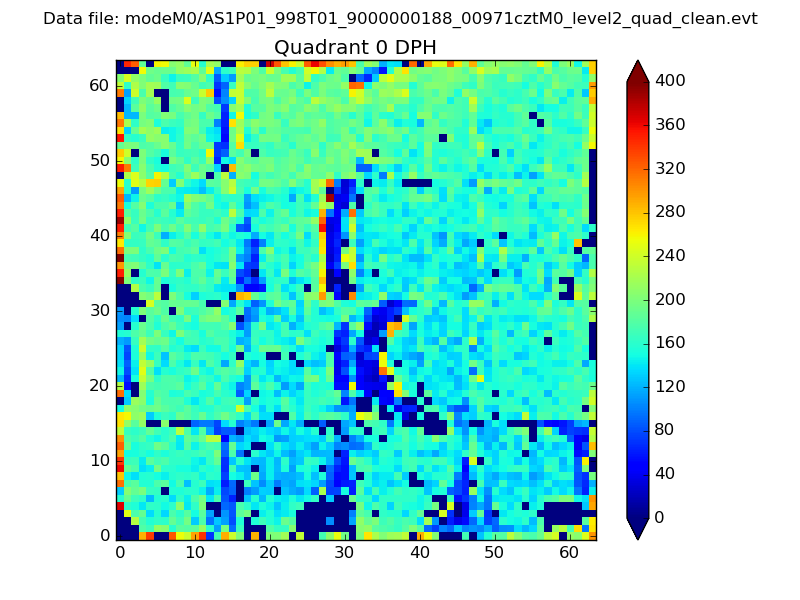 |
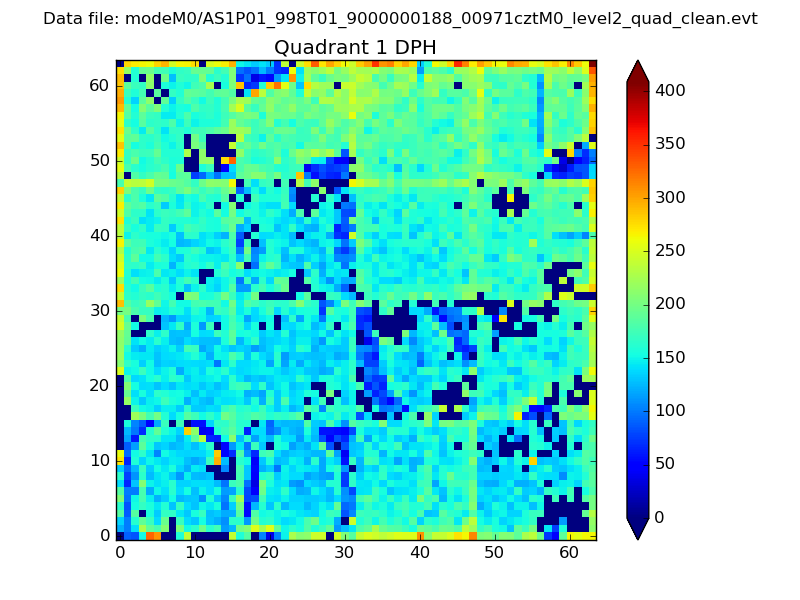 |
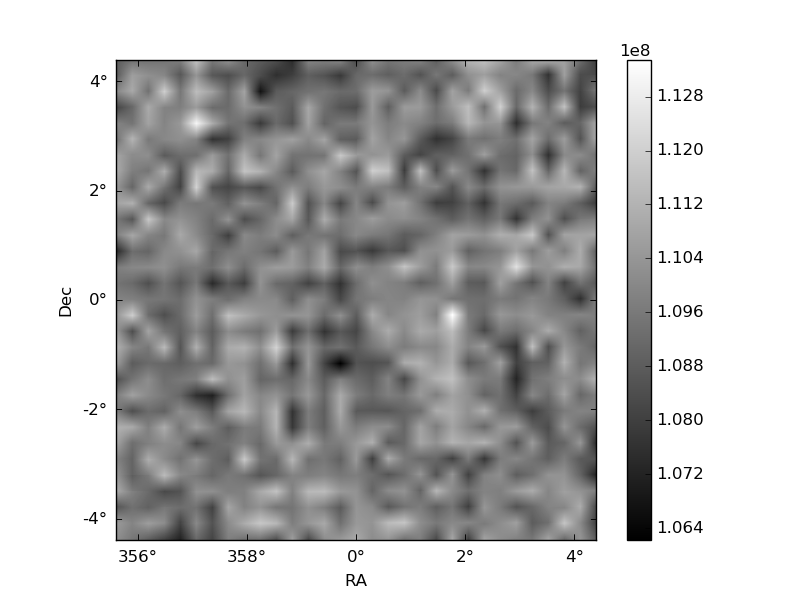
Quadrant B |
|---|---|---|---|
| Quadrant D | 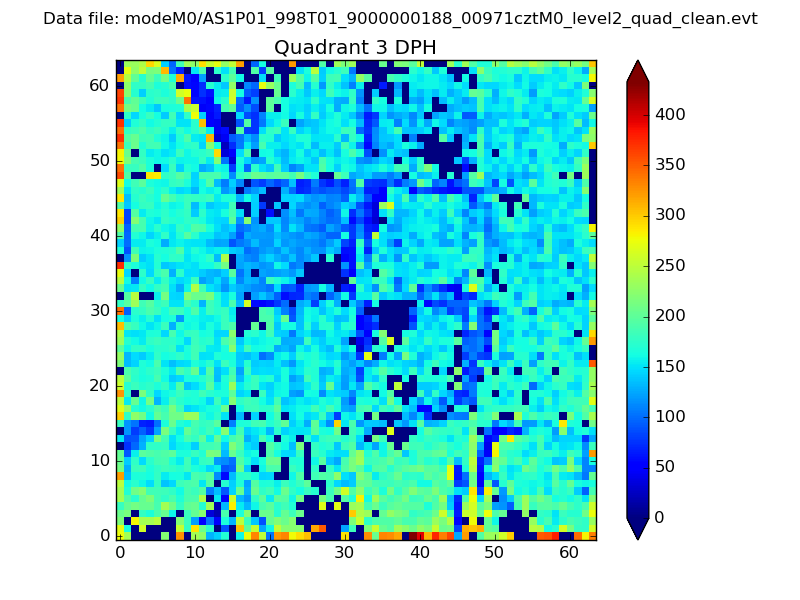 |
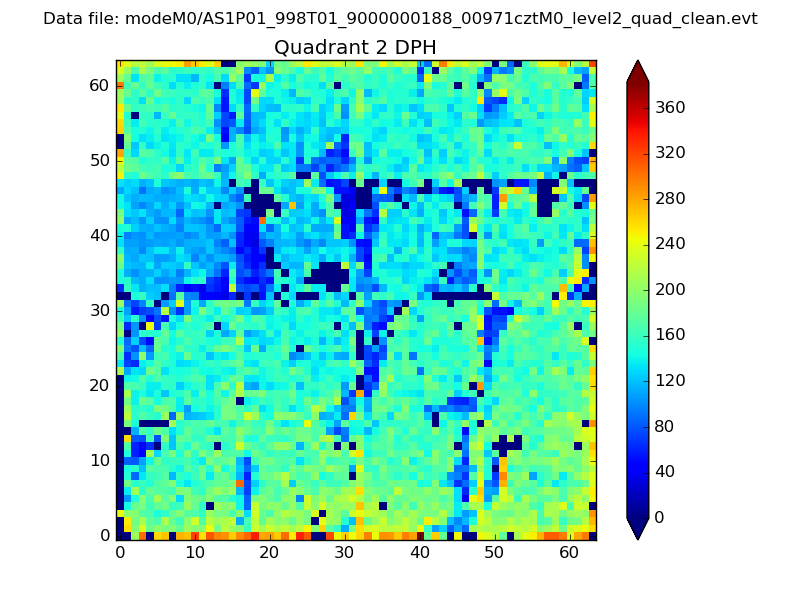 |
Quadrant C |
| Plot type | Count rate plots | Images |
|---|---|---|
| Comparison with Poisson distribution Blue bars denote a histogram of data divided into 1 sec bins. Red curve is a Poisson curve with rate = median count rate of data. |
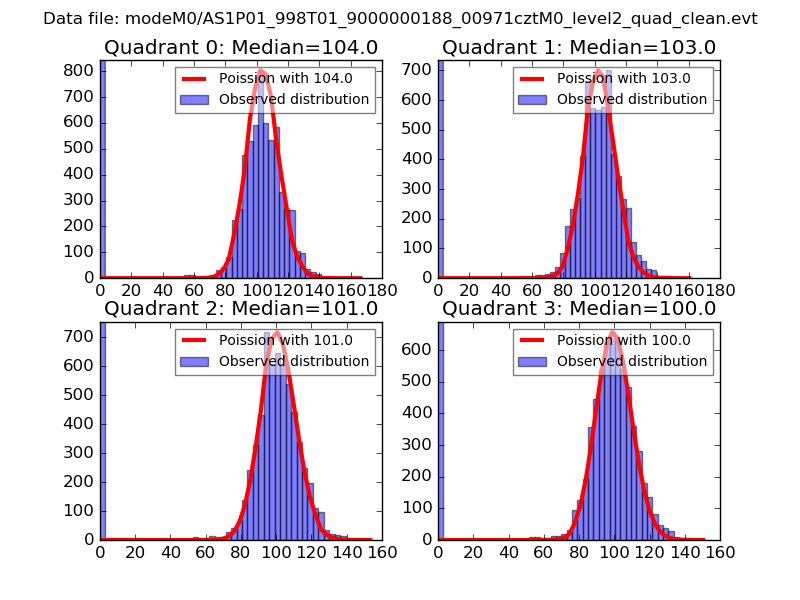 |
 |
| Quadrant-wise count rates Data is divided into 100 sec bins |
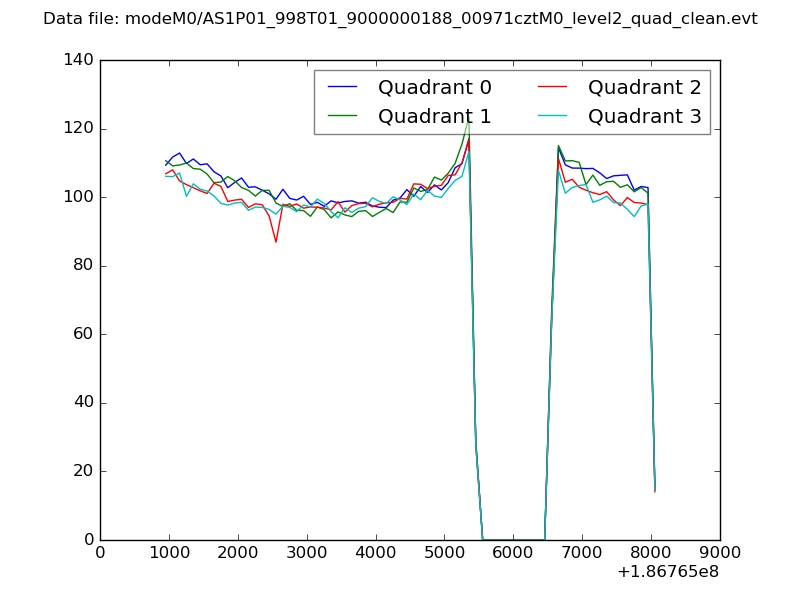 |
|
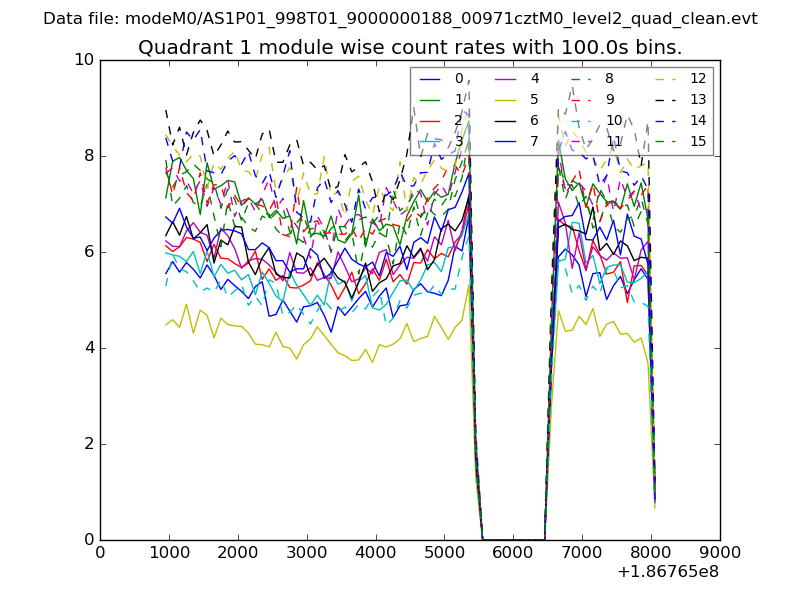
| Module-wise count rates for Quadrant A Data is divided into 100 sec bins |
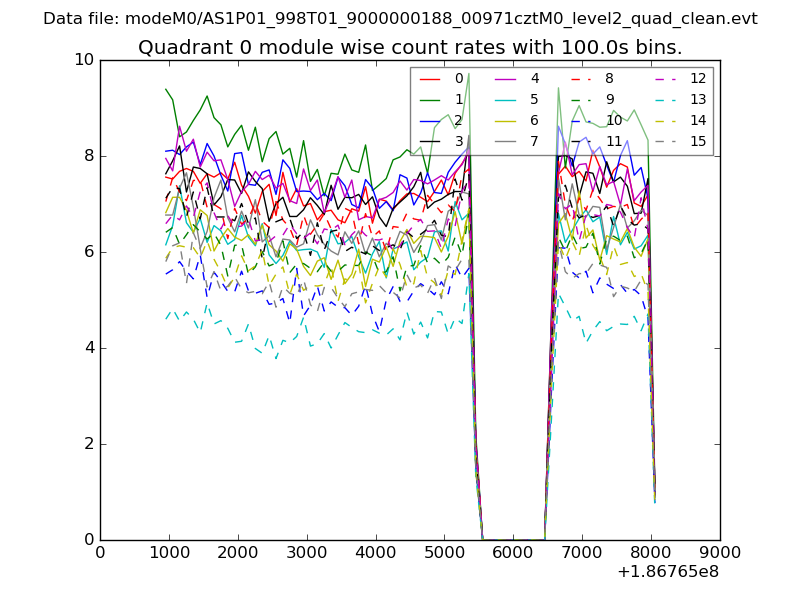 |
 |
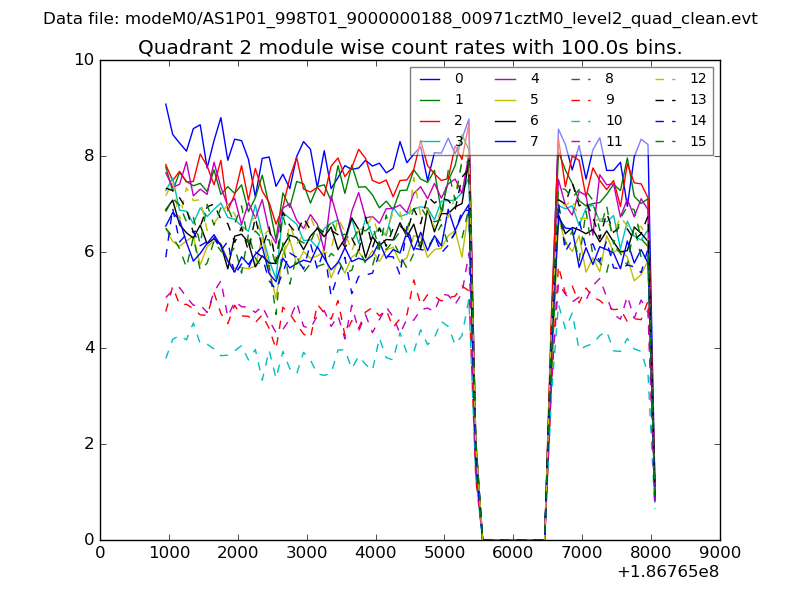
| Module-wise count rates for Quadrant B Data is divided into 100 sec bins |
 |
 |
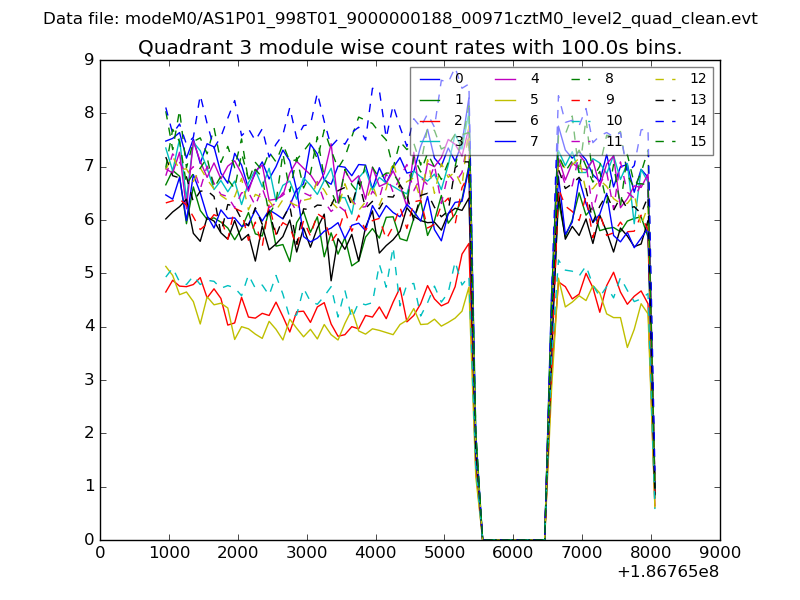
| Module-wise count rates for Quadrant C Data is divided into 100 sec bins |
 |
 |
| Module-wise count rates for Quadrant D Data is divided into 100 sec bins |
 |
 |
| Parameter | Plot |
|---|---|
| CZT HV Monitor | 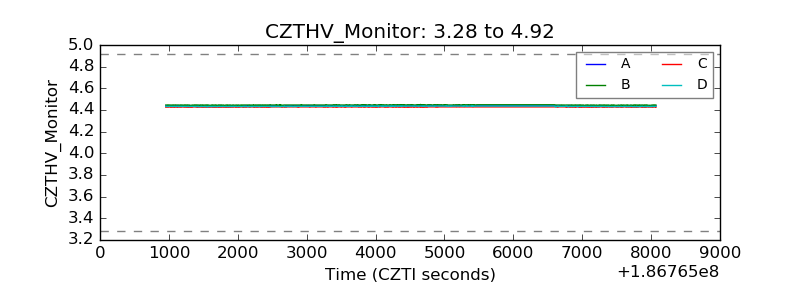 |
| D_VDD | 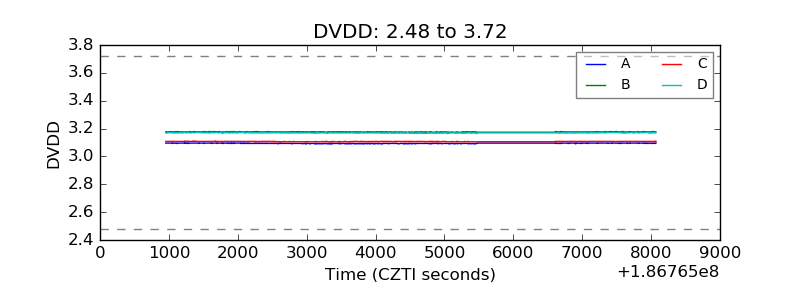 |
| Temperature 1 | 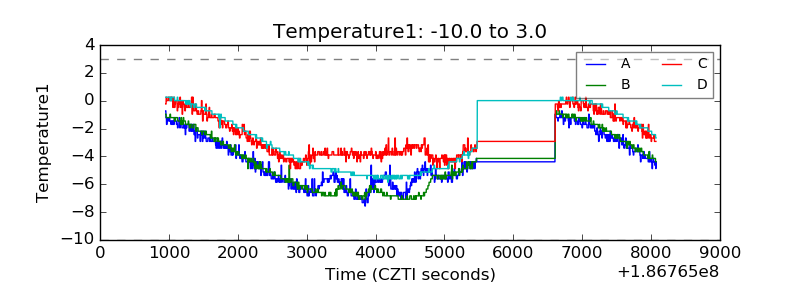 |
| Veto HV Monitor | 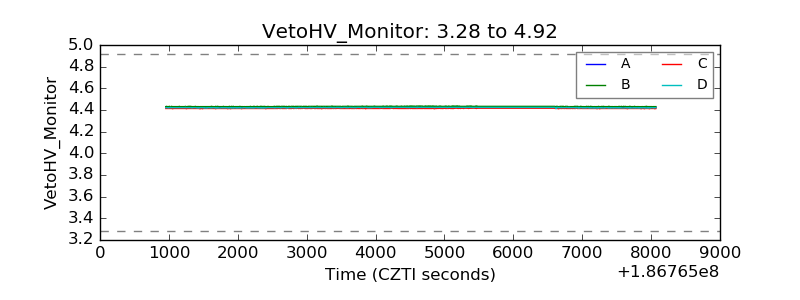 |
| Veto LLD | 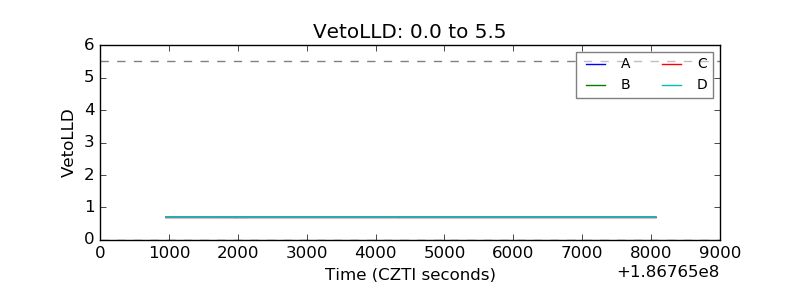 |
| Alpha Counter | 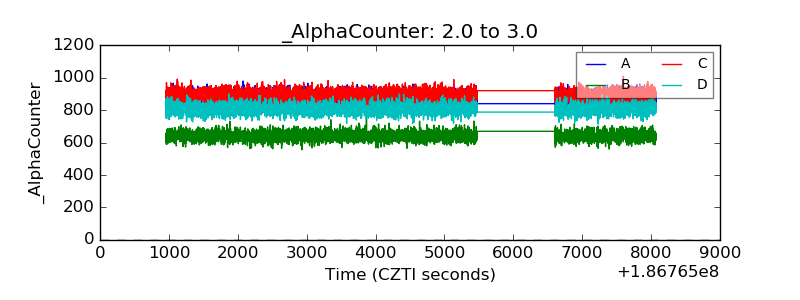 |
| _CPM_Rate | 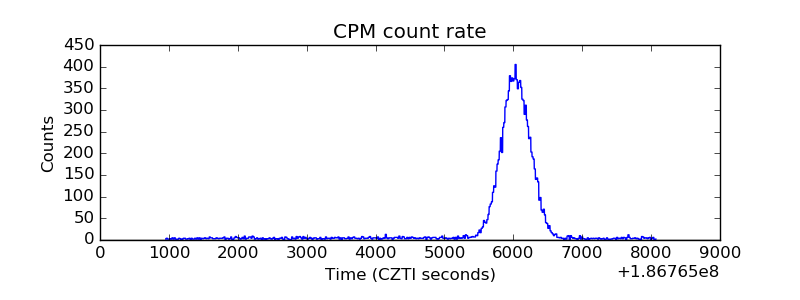 |
| CZT Counter | 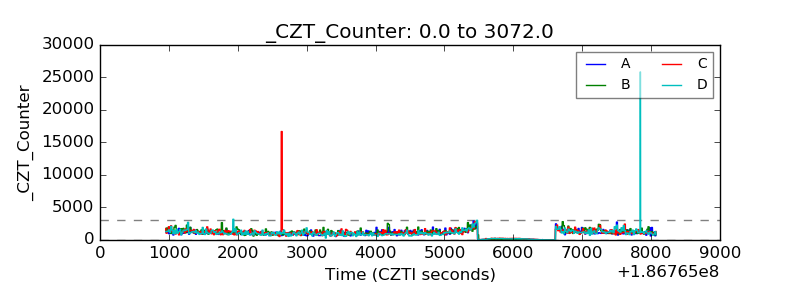 |
| +2.5 Volts monitor |  |
| +5 Volts monitor |  |
| _ROLL_ROT | 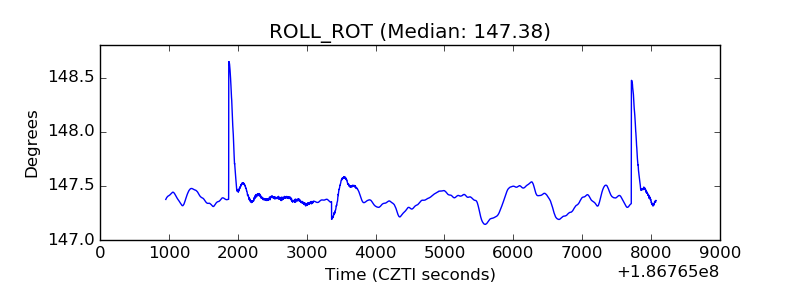 |
| _Roll_DEC | 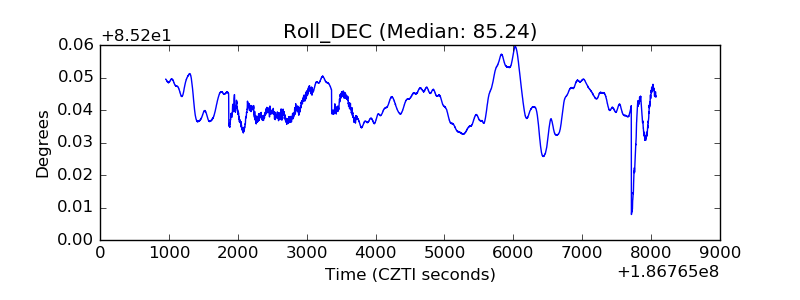 |
| _Roll_RA | 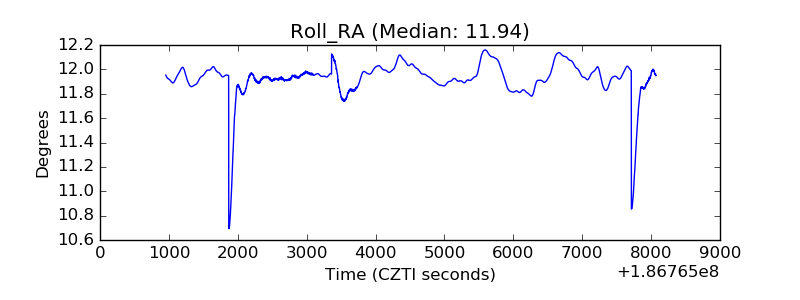 |
| Veto Counter | 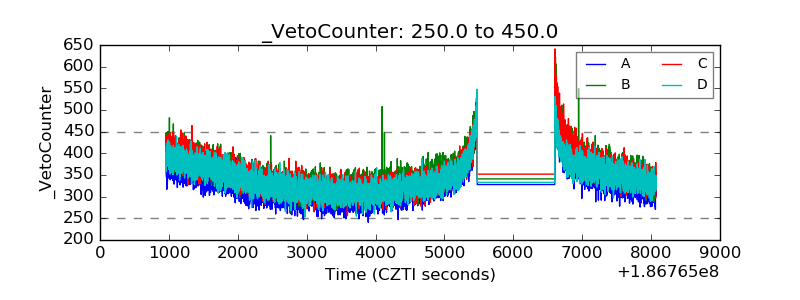 |