| Param | Original file | Final file |
|---|---|---|
| Filename | modeM0/AS1P01_998T01_9000000188_00973cztM0_level2.evt | modeM0/AS1P01_998T01_9000000188_00973cztM0_level2_quad_clean.evt |
| Size (bytes) | 1,199,603,520 | 109,278,720 |
| Size | 1.1 GB | 104.2 MB |
| Events in quadrant A | 8,569,565 | 717,846 |
| Events in quadrant B | 9,470,232 | 710,940 |
| Events in quadrant C | 8,883,782 | 700,416 |
| Events in quadrant D | 8,930,177 | 679,084 |
| Mode M0 | |||
|---|---|---|---|
| Quadrant | BADHDUFLAG | Total packets | Discarded packets |
| A | 0 | 30605 | 0 |
| B | 0 | 33227 | 0 |
| C | 0 | 31515 | 0 |
| D | 0 | 31711 | 0 |
| Mode M9 | |||
|---|---|---|---|
| Quadrant | BADHDUFLAG | Total packets | Discarded packets |
| A | 0 | 8 | 0 |
| B | 0 | 8 | 0 |
| C | 0 | 8 | 0 |
| D | 0 | 8 | 0 |
| Mode SS | |||
|---|---|---|---|
| Quadrant | BADHDUFLAG | Total packets | Discarded packets |
| A | 0 | 144 | 0 |
| B | 0 | 144 | 0 |
| C | 0 | 144 | 0 |
| D | 0 | 144 | 0 |
| Quadrant | Total seconds | Saturated seconds | Saturation percentage |
|---|---|---|---|
| A | 7207 | 6 | 0.083252% |
| B | 7207 | 72 | 0.999029% |
| C | 7207 | 8 | 0.111003% |
| D | 7206 | 250 | 3.469331% |
Noise dominated data is calculated using 1-second bins in cleaned event files. If a bin has >2000 counts, and if more than 50% of those come from <1% of pixels, then it is considered to be noise-dominated and hence unusable.
| Quadrant | # 1 sec bins | Bins with >0 counts | Bins with >2000 counts | High rate bins dominated by noise | Noise dominated (total time) | Noise dominated (detector-on time) | Marked lightcurve |
|---|---|---|---|---|---|---|---|
| A | 7582 | 7208 | 254 | 254 | 3.35% | 3.52% | 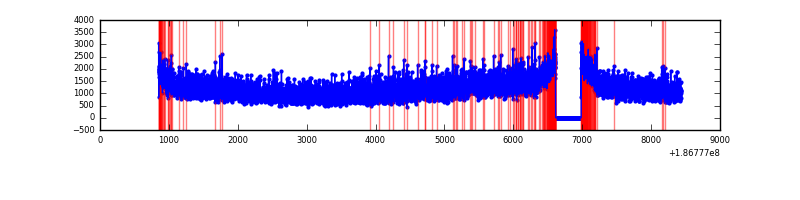 |
| B | 7582 | 7208 | 516 | 516 | 6.81% | 7.16% | 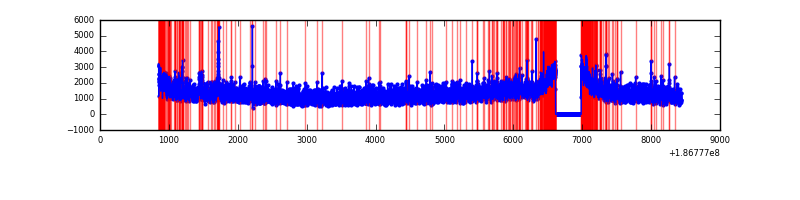 |
| C | 7582 | 7208 | 322 | 322 | 4.25% | 4.47% | 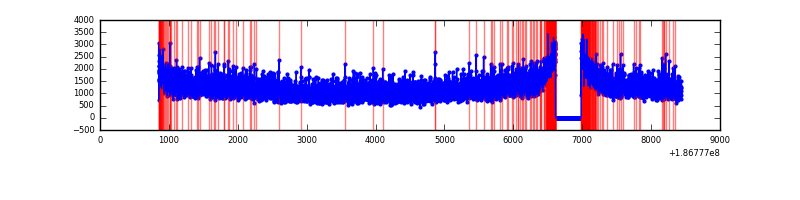 |
| D | 7581 | 7207 | 582 | 582 | 7.68% | 8.08% |  |
Top three noisy pixels from each quadrant. If the there are fewer than three noisy pixels in the level2.evt file, extra rows are filled as -1
| Pixel properties | Quadrant properties | ||||||
|---|---|---|---|---|---|---|---|
| Quadrant | DetID | PixID | Counts | Sigma | Mean | Median | Sigma |
| A | 11 | 242 | 17649 | 28.9 | 2222 | 2236 | 533.4 |
| A | 12 | 189 | 10142 | 14.82 | 2222 | 2236 | 533.4 |
| A | 12 | 243 | 8843 | 12.39 | 2222 | 2236 | 533.4 |
| B | 0 | 220 | 104987 | 186.92 | 2327 | 2334 | 549.2 |
| B | 15 | 154 | 88585 | 157.06 | 2327 | 2334 | 549.2 |
| B | 15 | 22 | 85881 | 152.13 | 2327 | 2334 | 549.2 |
| C | 15 | 241 | 346719 | 573.85 | 2153 | 2231 | 600.3 |
| C | 10 | 34 | 67306 | 108.4 | 2153 | 2231 | 600.3 |
| C | 3 | 111 | 31690 | 49.07 | 2153 | 2231 | 600.3 |
| D | 12 | 188 | 740423 | 1180.56 | 2039 | 2110 | 625.4 |
| D | 1 | 4 | 404973 | 644.18 | 2039 | 2110 | 625.4 |
| D | 13 | 73 | 67214 | 104.1 | 2039 | 2110 | 625.4 |
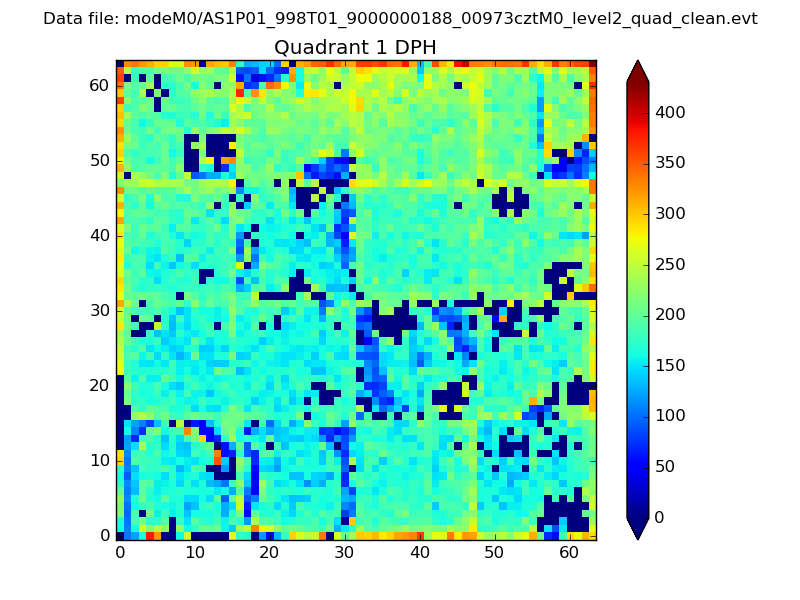
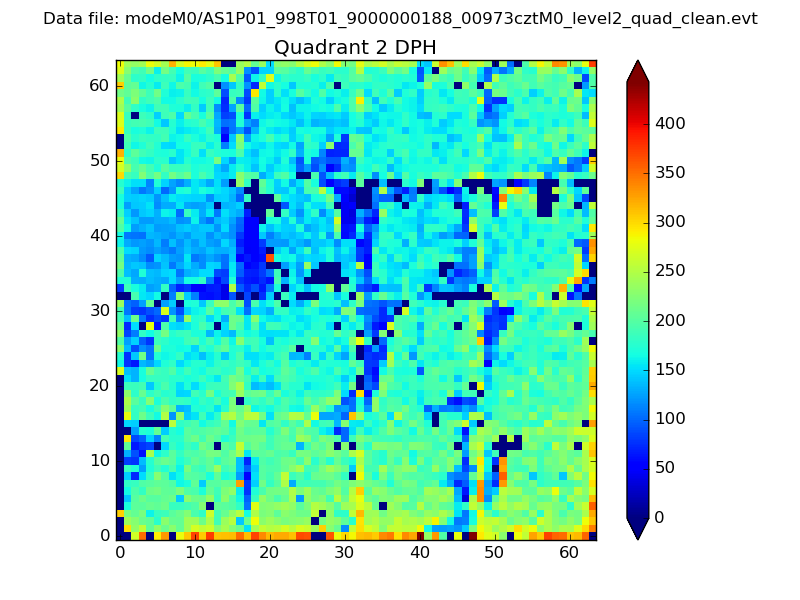
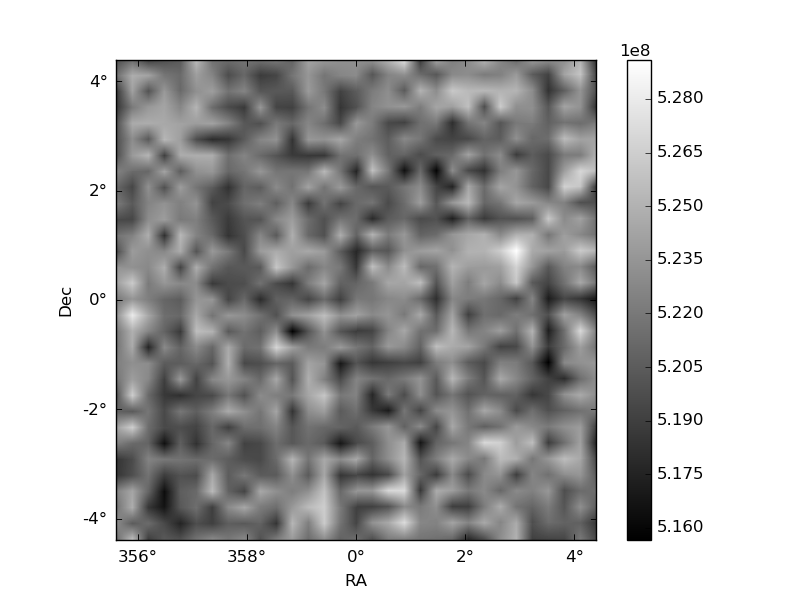
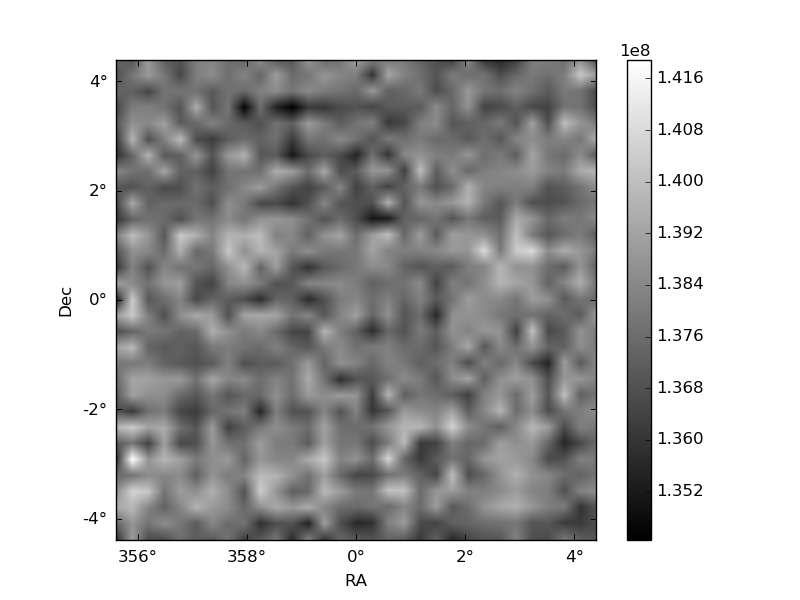
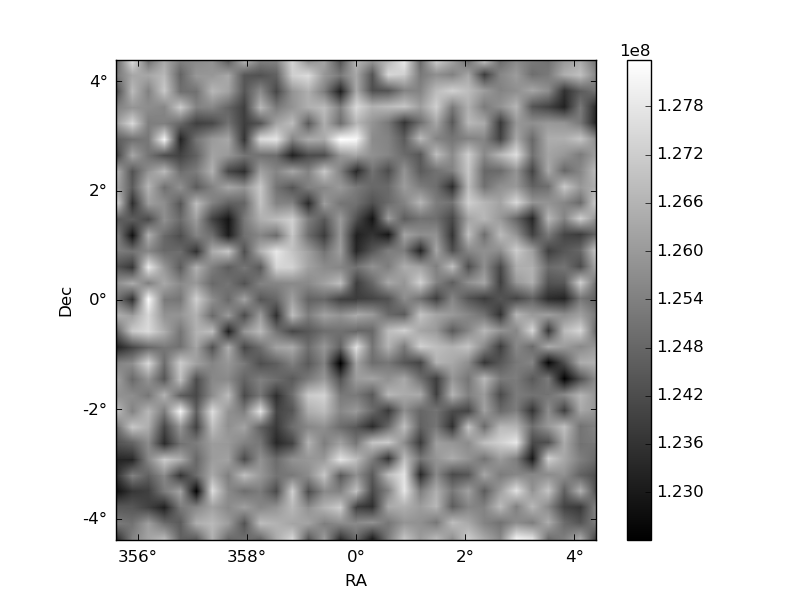
Histogram calculated using DETX and DETY for each event in the final _common_clean file
| Quadrant A | 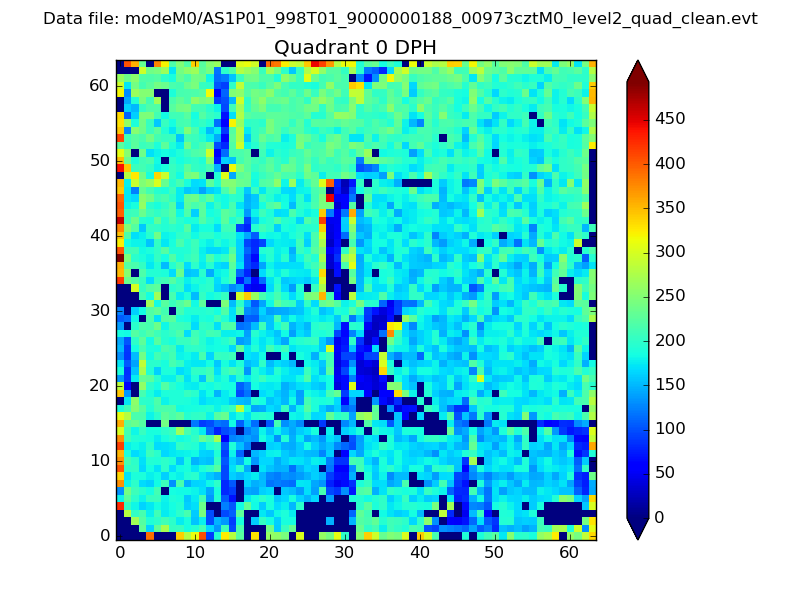 |
 |
Quadrant B |
|---|---|---|---|
| Quadrant D | 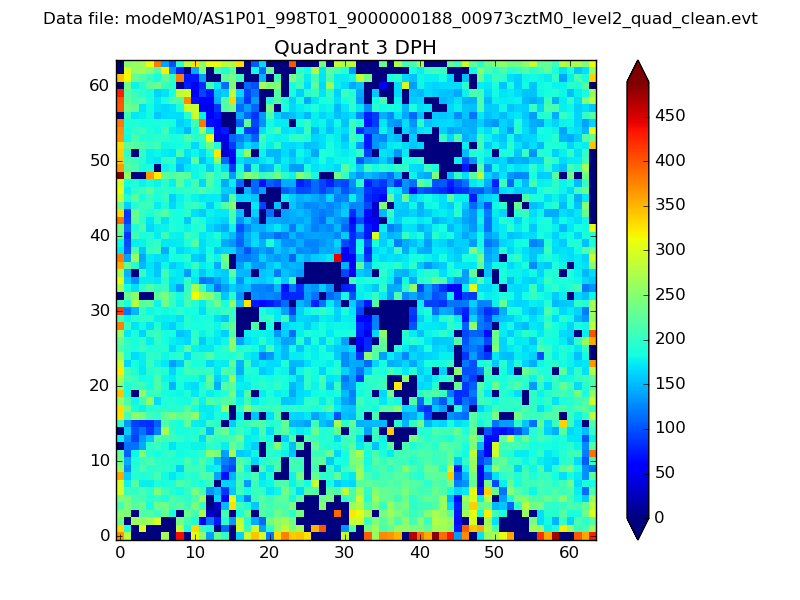 |
 |
Quadrant C |
| Plot type | Count rate plots | Images |
|---|---|---|
| Comparison with Poisson distribution Blue bars denote a histogram of data divided into 1 sec bins. Red curve is a Poisson curve with rate = median count rate of data. |
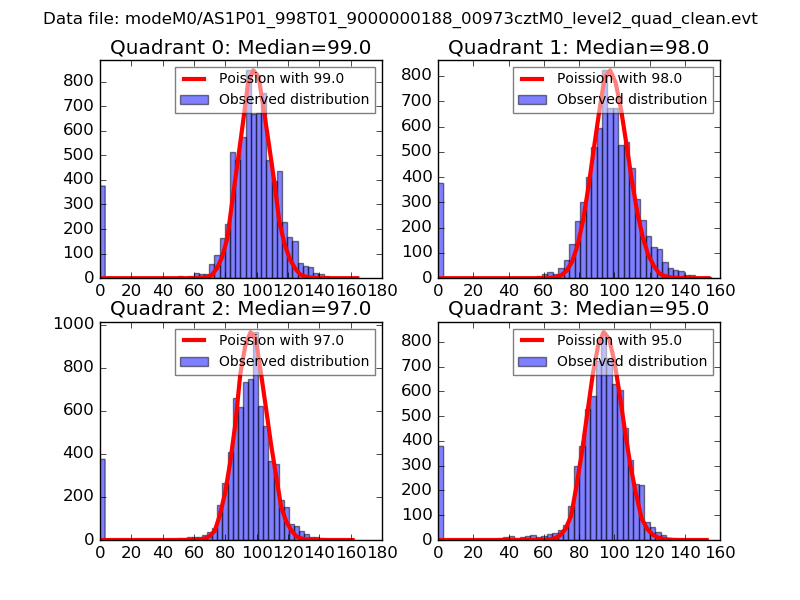 |
 |
| Quadrant-wise count rates Data is divided into 100 sec bins |
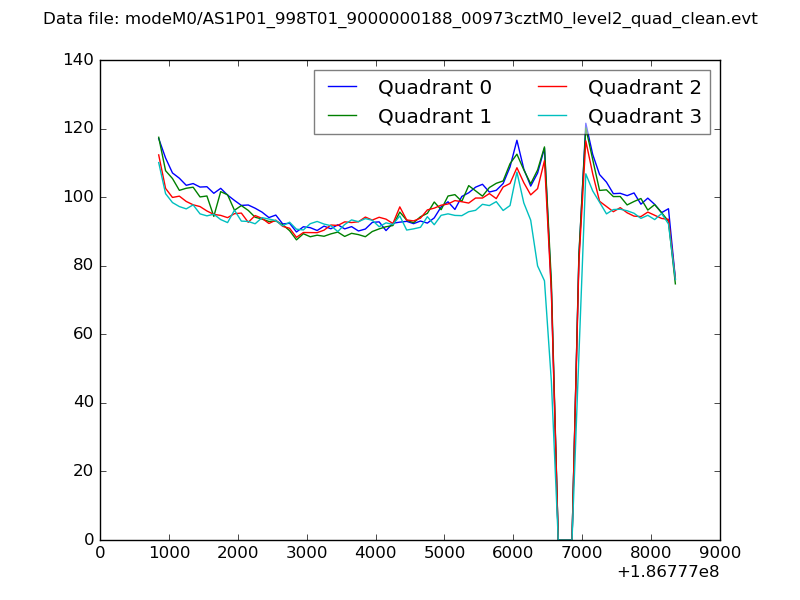 |
|
| Module-wise count rates for Quadrant A Data is divided into 100 sec bins |
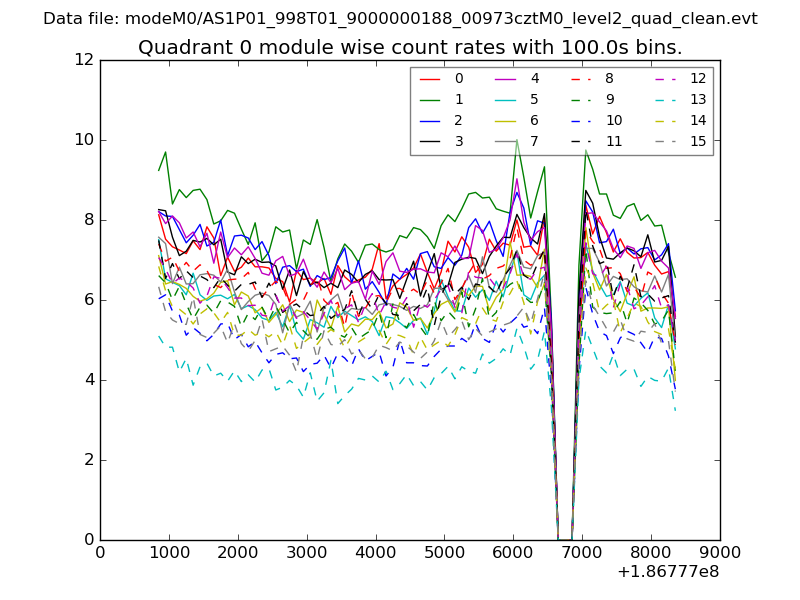 |
 |
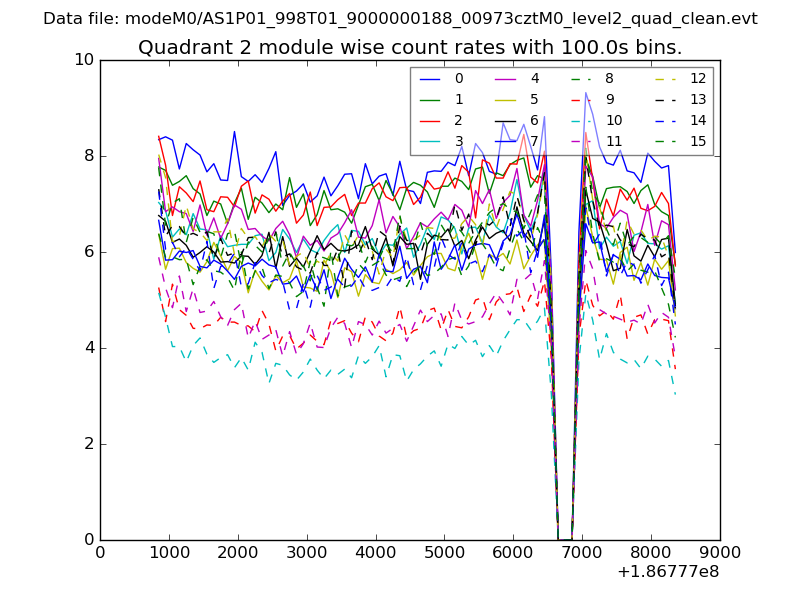
| Module-wise count rates for Quadrant B Data is divided into 100 sec bins |
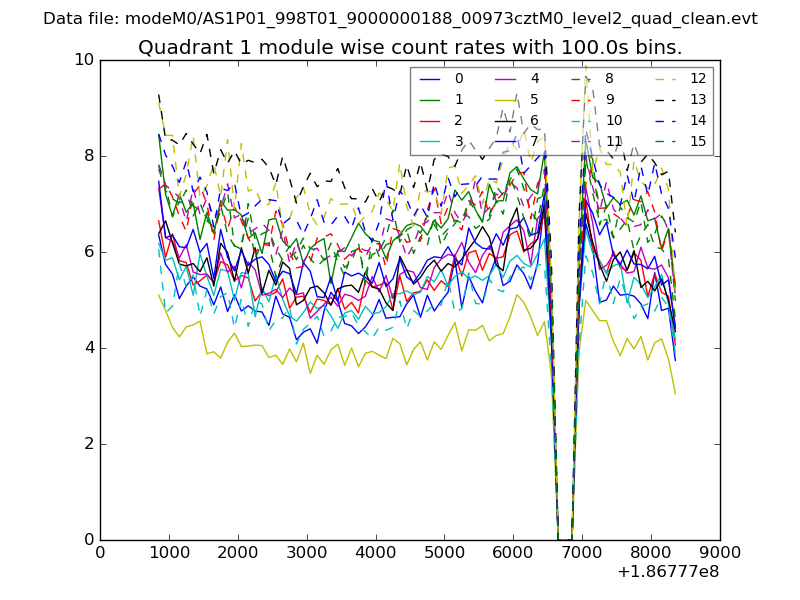 |
 |
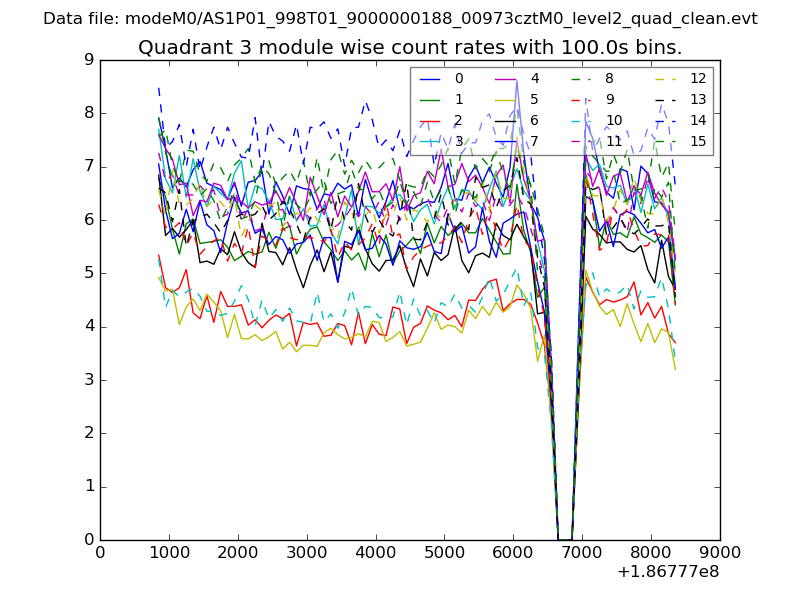
| Module-wise count rates for Quadrant C Data is divided into 100 sec bins |
 |
 |
| Module-wise count rates for Quadrant D Data is divided into 100 sec bins |
 |
 |
| Parameter | Plot |
|---|---|
| CZT HV Monitor | 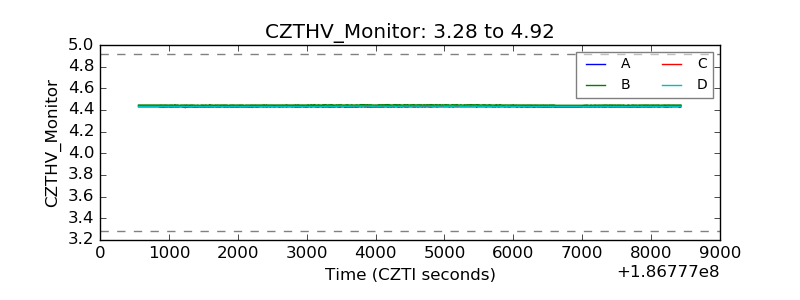 |
| D_VDD |  |
| Temperature 1 | 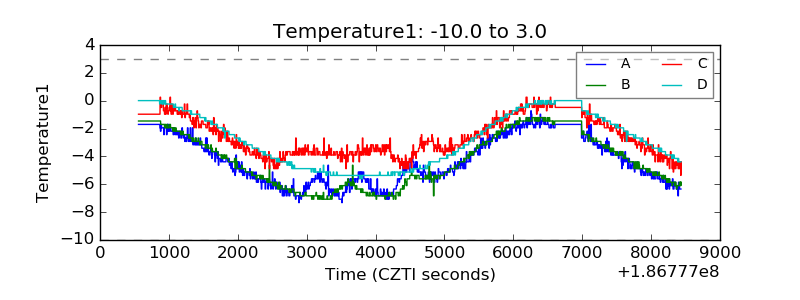 |
| Veto HV Monitor | 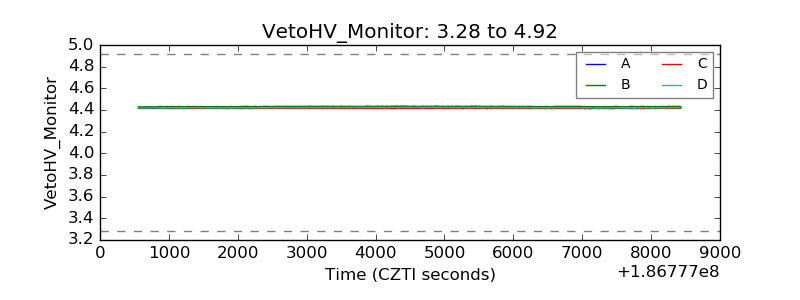 |
| Veto LLD | 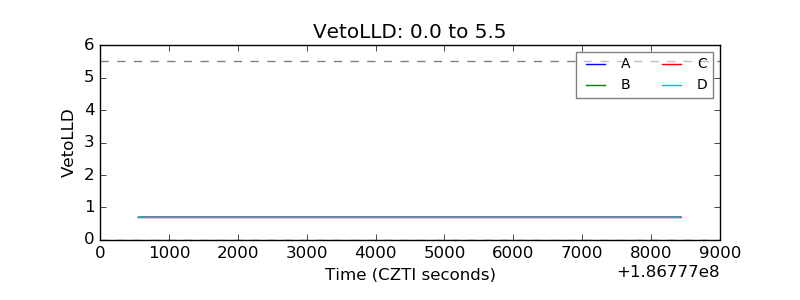 |
| Alpha Counter | 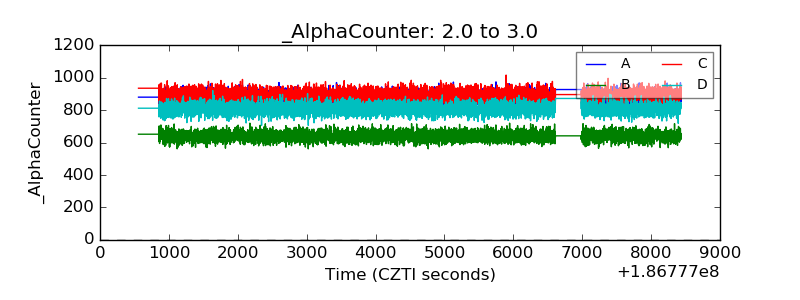 |
| _CPM_Rate | 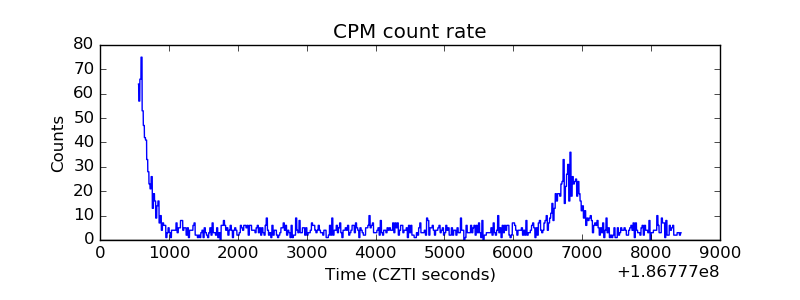 |
| CZT Counter | 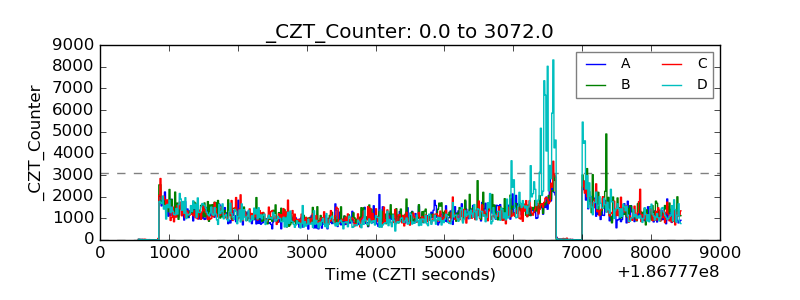 |
| +2.5 Volts monitor |  |
| +5 Volts monitor |  |
| _ROLL_ROT | 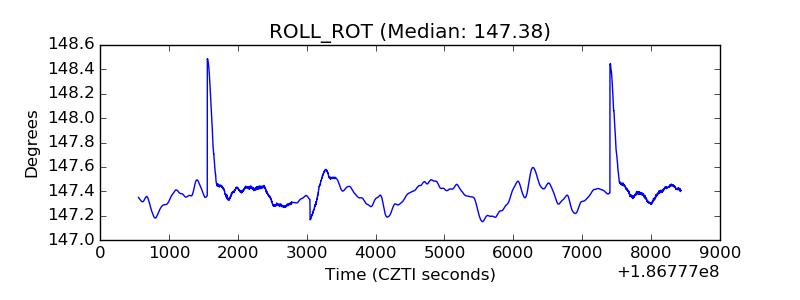 |
| _Roll_DEC | 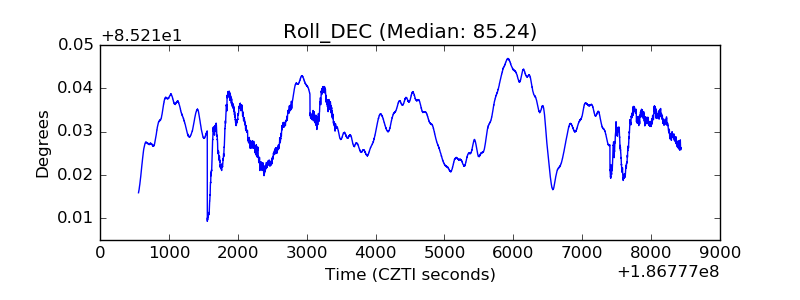 |
| _Roll_RA |  |
| Veto Counter | 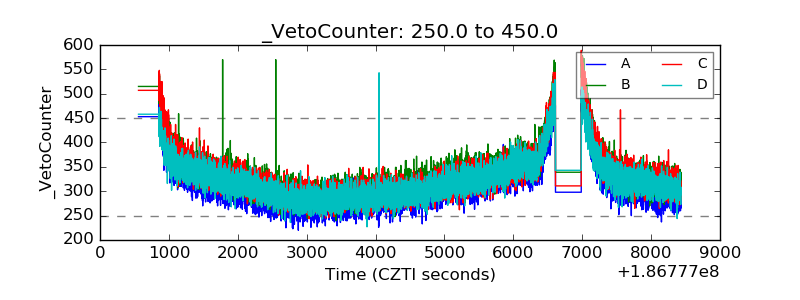 |