| Param | Original file | Final file |
|---|---|---|
| Filename | modeM0/AS1P01_998T01_9000000188_00974cztM0_level2.evt | modeM0/AS1P01_998T01_9000000188_00974cztM0_level2_quad_clean.evt |
| Size (bytes) | 1,223,432,640 | 113,849,280 |
| Size | 1.1 GB | 108.6 MB |
| Events in quadrant A | 9,012,207 | 743,381 |
| Events in quadrant B | 9,698,770 | 739,475 |
| Events in quadrant C | 9,266,638 | 726,204 |
| Events in quadrant D | 8,573,125 | 712,469 |
| Mode M0 | |||
|---|---|---|---|
| Quadrant | BADHDUFLAG | Total packets | Discarded packets |
| A | 0 | 32115 | 0 |
| B | 0 | 34177 | 0 |
| C | 0 | 32906 | 0 |
| D | 0 | 30883 | 0 |
| Mode SS | |||
|---|---|---|---|
| Quadrant | BADHDUFLAG | Total packets | Discarded packets |
| A | 0 | 154 | 0 |
| B | 0 | 154 | 0 |
| C | 0 | 154 | 0 |
| D | 0 | 154 | 0 |
| Quadrant | Total seconds | Saturated seconds | Saturation percentage |
|---|---|---|---|
| A | 7560 | 4 | 0.052910% |
| B | 7561 | 27 | 0.357096% |
| C | 7560 | 8 | 0.105820% |
| D | 7560 | 28 | 0.370370% |
Noise dominated data is calculated using 1-second bins in cleaned event files. If a bin has >2000 counts, and if more than 50% of those come from <1% of pixels, then it is considered to be noise-dominated and hence unusable.
| Quadrant | # 1 sec bins | Bins with >0 counts | Bins with >2000 counts | High rate bins dominated by noise | Noise dominated (total time) | Noise dominated (detector-on time) | Marked lightcurve |
|---|---|---|---|---|---|---|---|
| A | 7640 | 7563 | 236 | 236 | 3.09% | 3.12% | 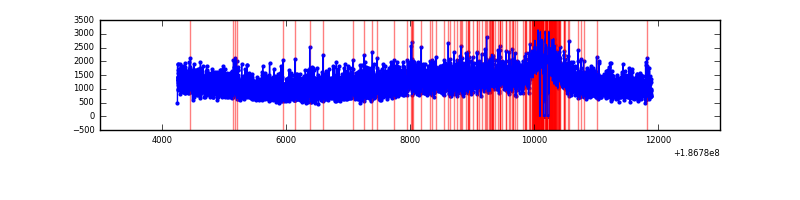 |
| B | 7641 | 7564 | 443 | 443 | 5.80% | 5.86% | 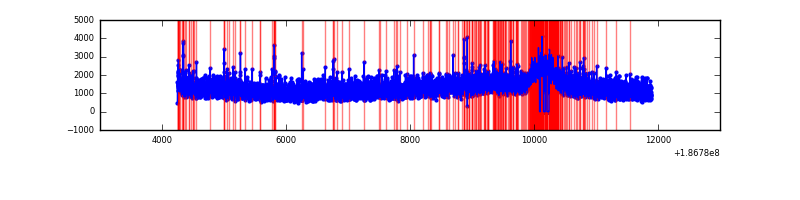 |
| C | 7640 | 7563 | 309 | 309 | 4.04% | 4.09% | 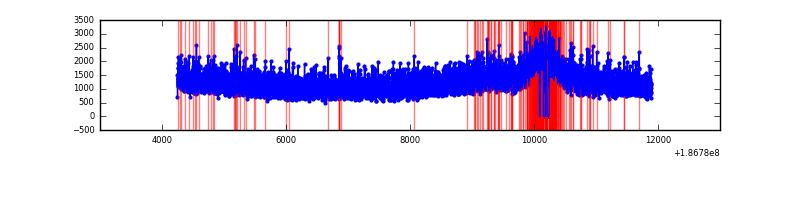 |
| D | 7640 | 7563 | 285 | 285 | 3.73% | 3.77% | 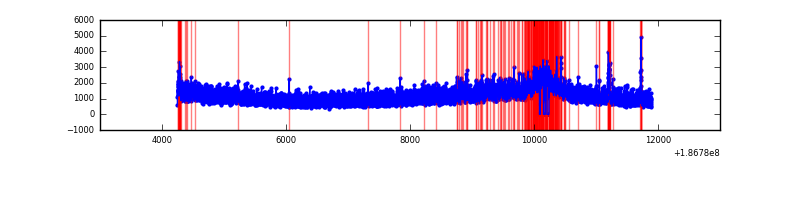 |
Top three noisy pixels from each quadrant. If the there are fewer than three noisy pixels in the level2.evt file, extra rows are filled as -1
| Pixel properties | Quadrant properties | ||||||
|---|---|---|---|---|---|---|---|
| Quadrant | DetID | PixID | Counts | Sigma | Mean | Median | Sigma |
| A | 12 | 189 | 80742 | 140.43 | 2321 | 2329 | 558.4 |
| A | 11 | 79 | 9565 | 12.96 | 2321 | 2329 | 558.4 |
| A | 10 | 133 | 8073 | 10.29 | 2321 | 2329 | 558.4 |
| B | 15 | 22 | 108961 | 186.32 | 2432 | 2435 | 571.7 |
| B | 0 | 220 | 81157 | 137.69 | 2432 | 2435 | 571.7 |
| B | 7 | 221 | 65971 | 111.13 | 2432 | 2435 | 571.7 |
| C | 15 | 241 | 368379 | 586.2 | 2244 | 2325 | 624.5 |
| C | 3 | 111 | 39948 | 60.25 | 2244 | 2325 | 624.5 |
| C | 3 | 79 | 34506 | 51.53 | 2244 | 2325 | 624.5 |
| D | 1 | 4 | 332388 | 499.21 | 2146 | 2223 | 661.4 |
| D | 2 | 225 | 41908 | 60.0 | 2146 | 2223 | 661.4 |
| D | 10 | 154 | 38477 | 54.82 | 2146 | 2223 | 661.4 |
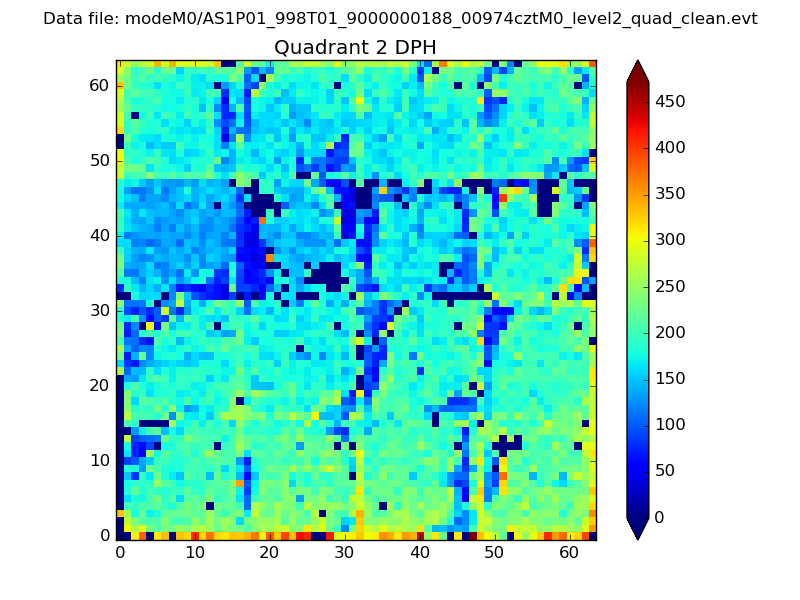
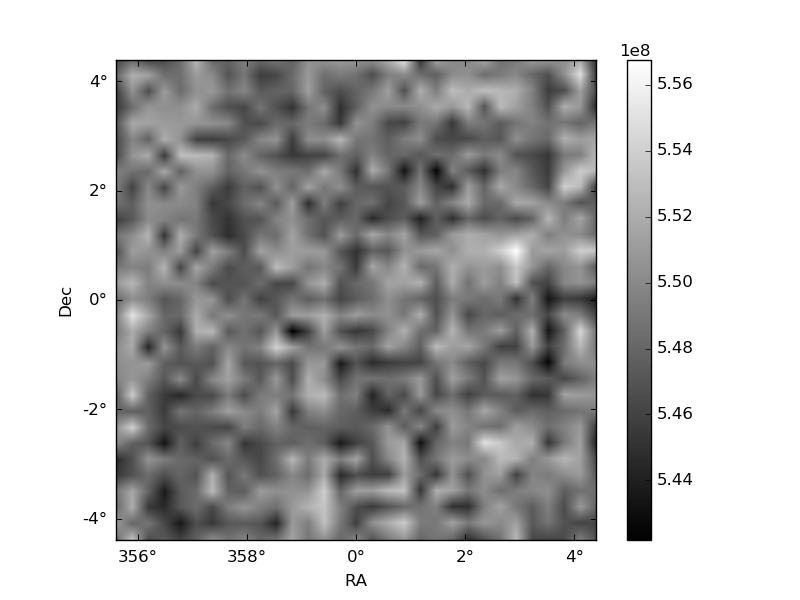
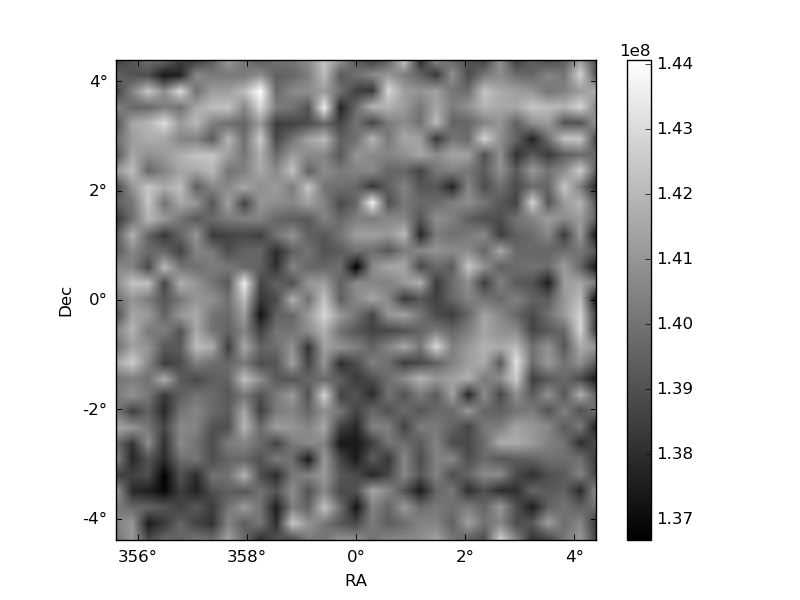
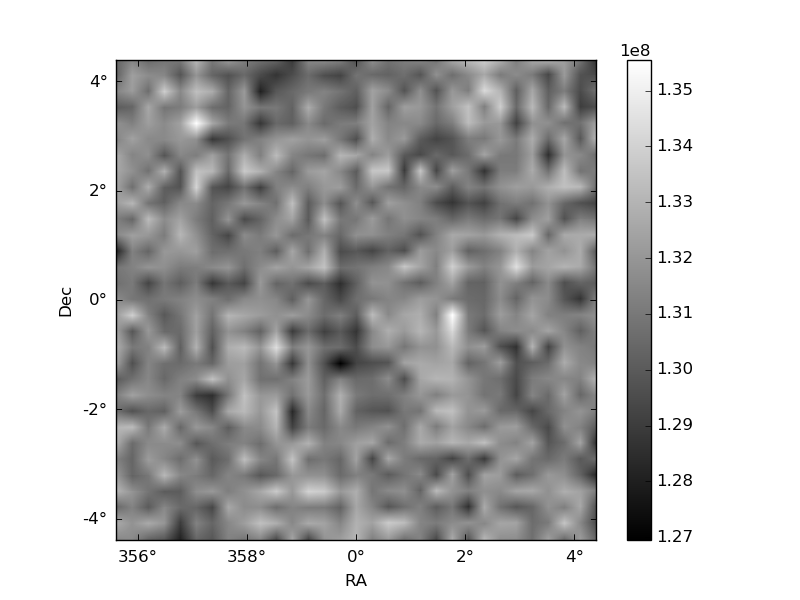
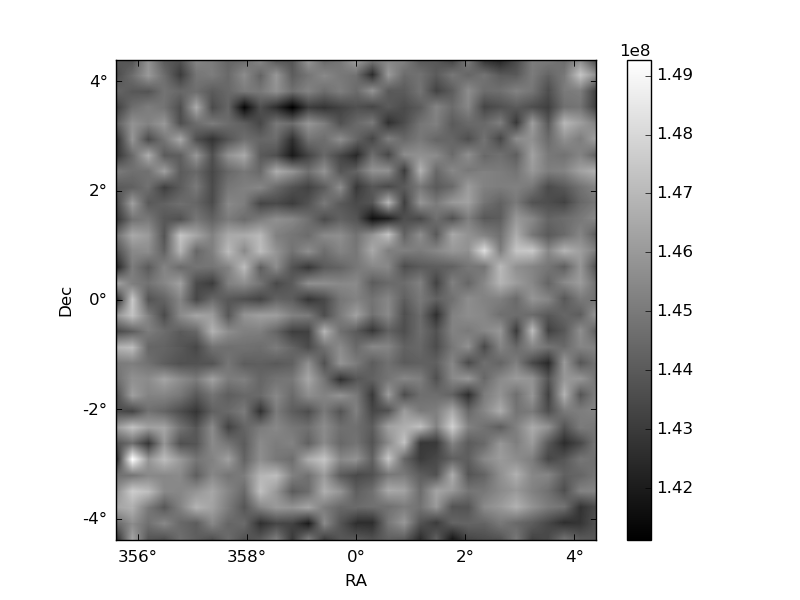
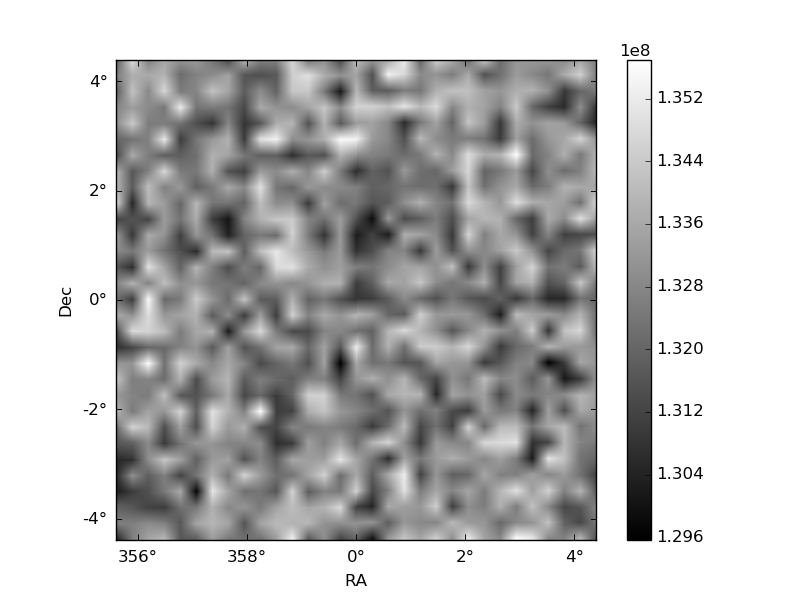
Histogram calculated using DETX and DETY for each event in the final _common_clean file
| Quadrant A | 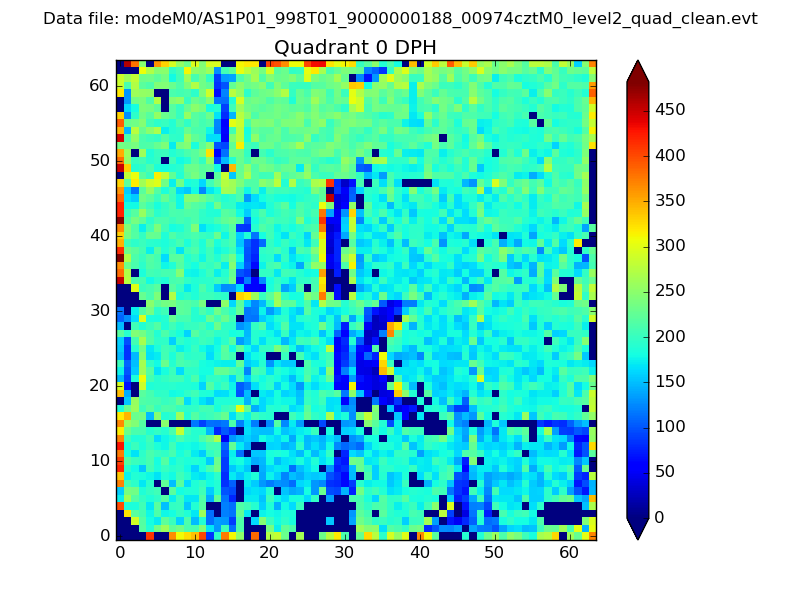 |
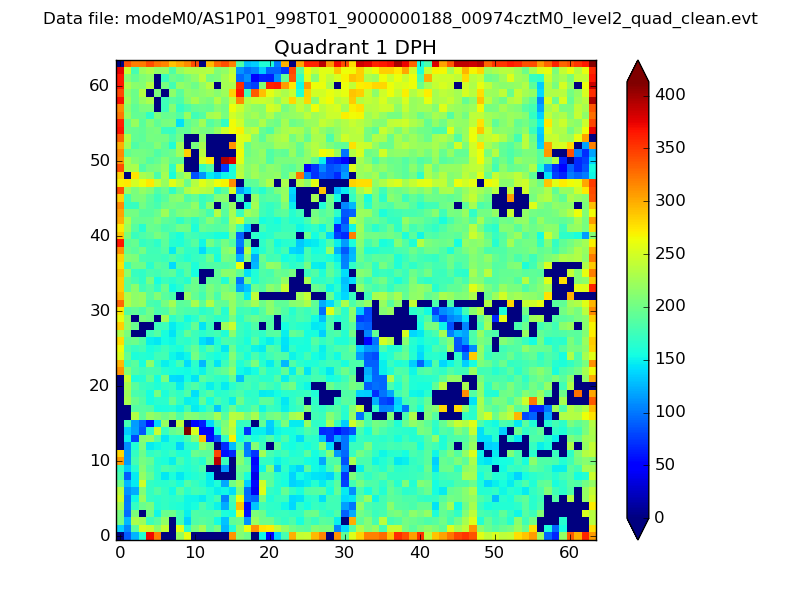 |
Quadrant B |
|---|---|---|---|
| Quadrant D | 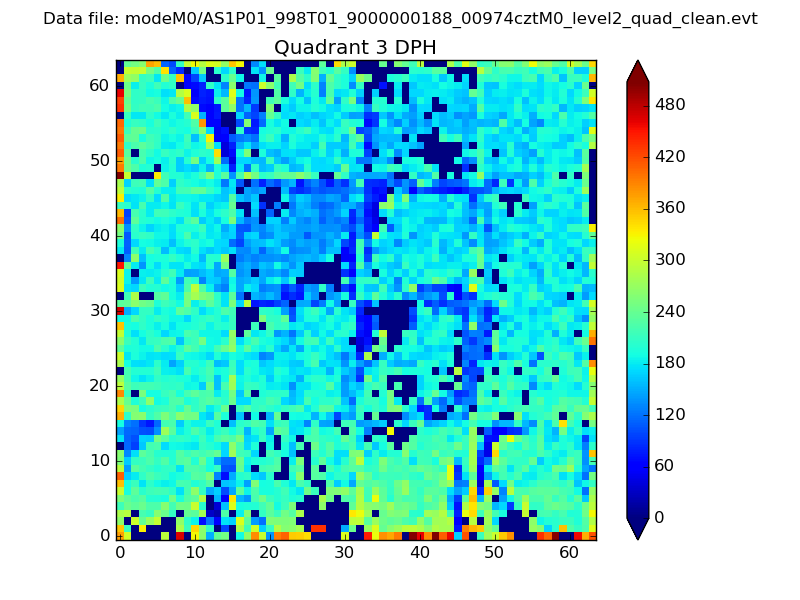 |
 |
Quadrant C |
| Plot type | Count rate plots | Images |
|---|---|---|
| Comparison with Poisson distribution Blue bars denote a histogram of data divided into 1 sec bins. Red curve is a Poisson curve with rate = median count rate of data. |
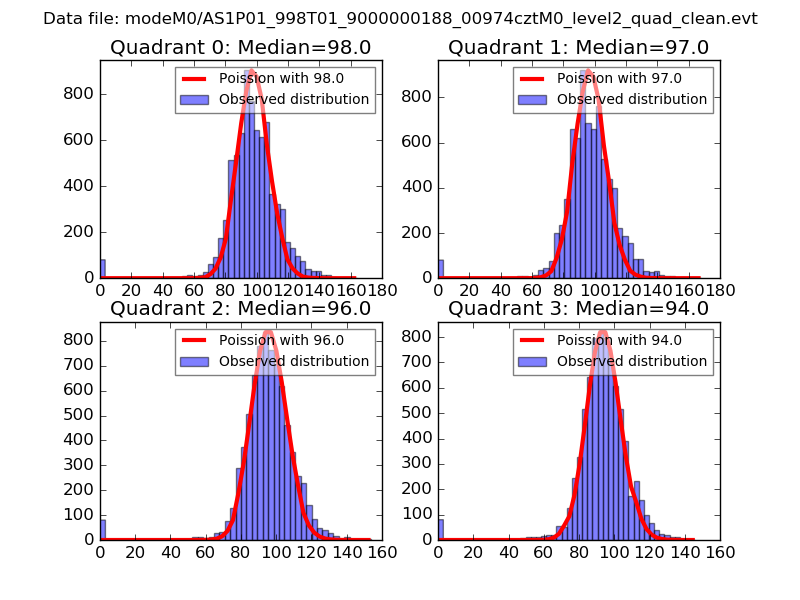 |
 |
| Quadrant-wise count rates Data is divided into 100 sec bins |
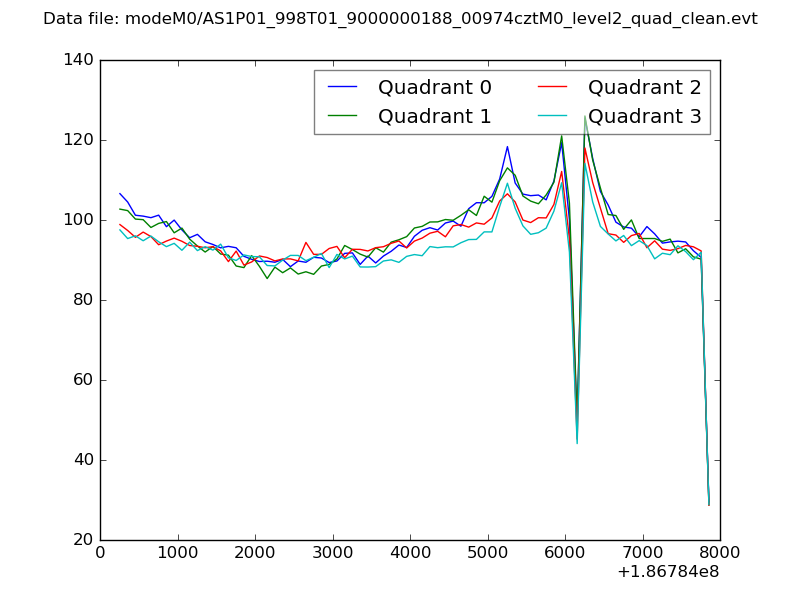 |
|
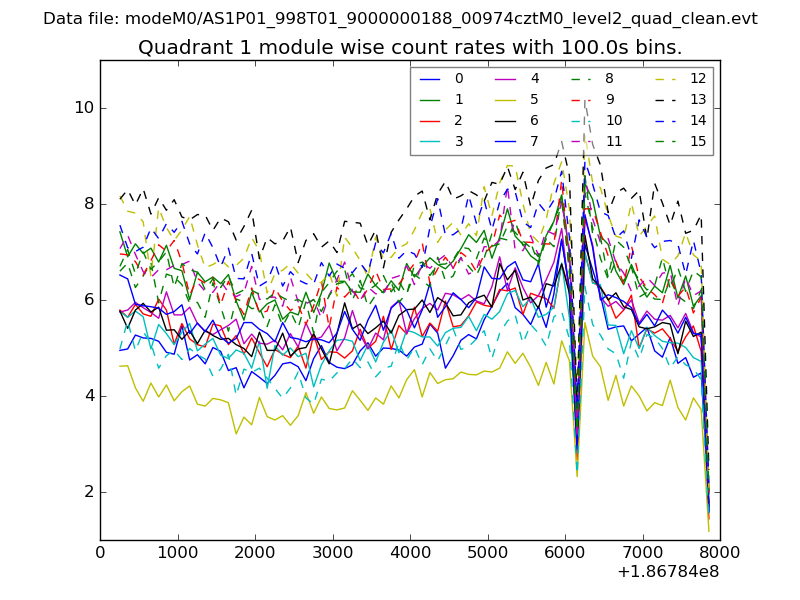
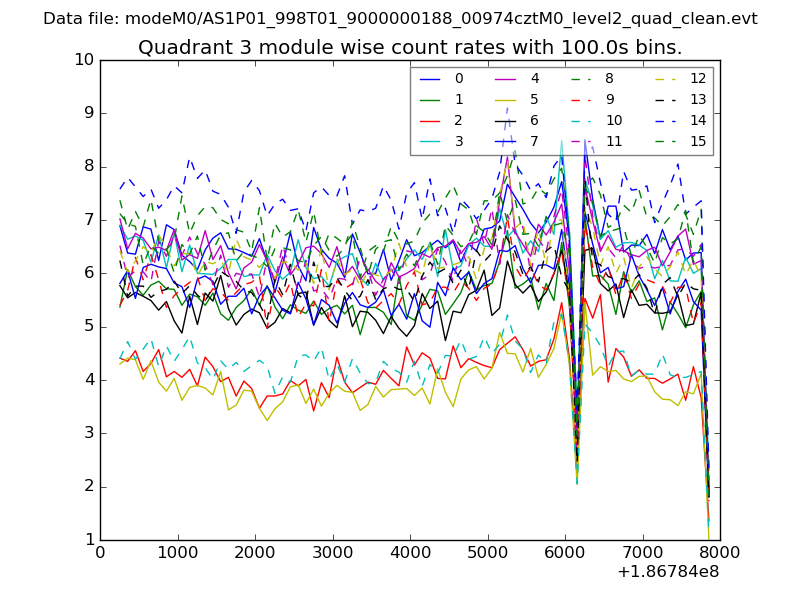
| Module-wise count rates for Quadrant A Data is divided into 100 sec bins |
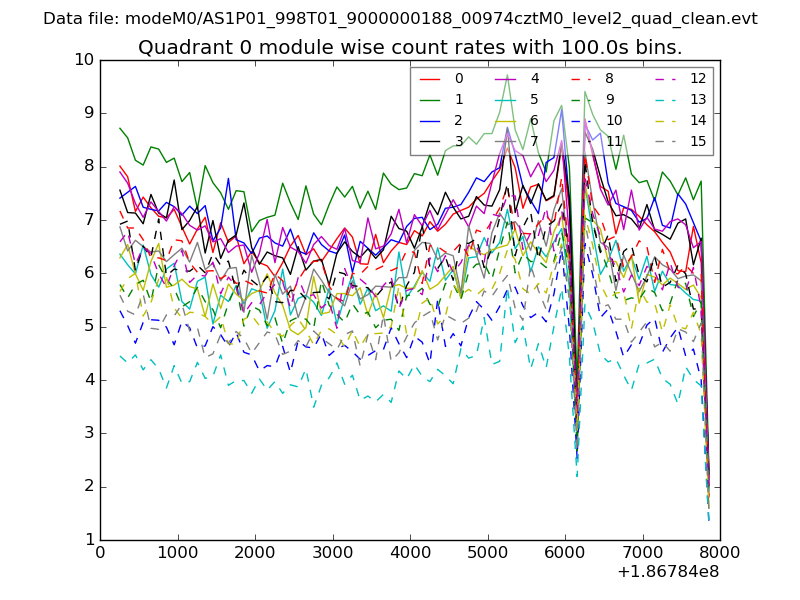 |
 |
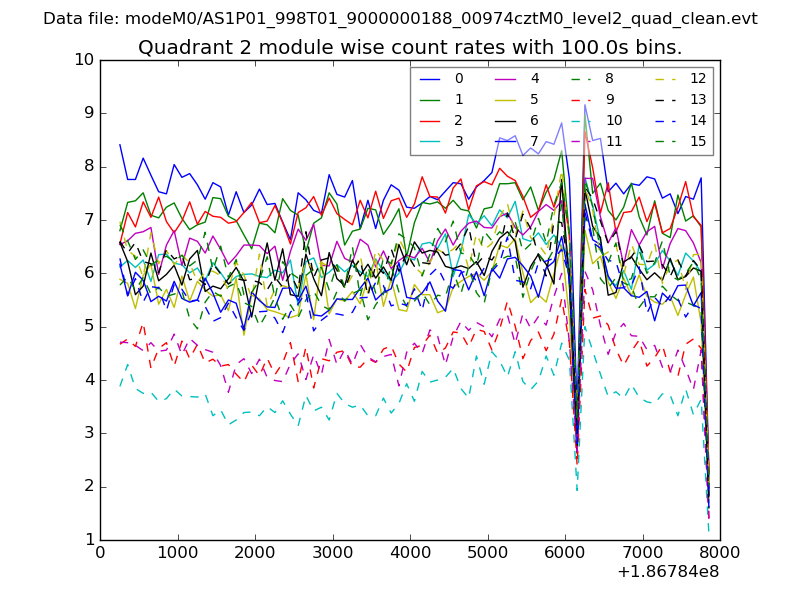
| Module-wise count rates for Quadrant B Data is divided into 100 sec bins |
 |
 |
| Module-wise count rates for Quadrant C Data is divided into 100 sec bins |
 |
 |
| Module-wise count rates for Quadrant D Data is divided into 100 sec bins |
 |
 |
| Parameter | Plot |
|---|---|
| CZT HV Monitor | 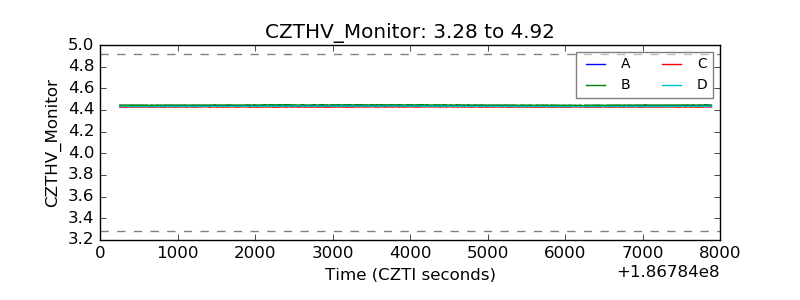 |
| D_VDD | 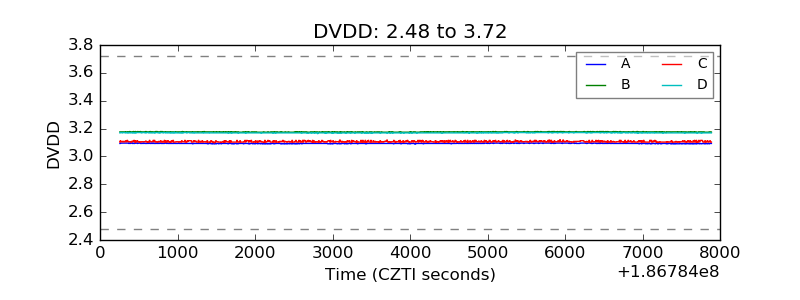 |
| Temperature 1 | 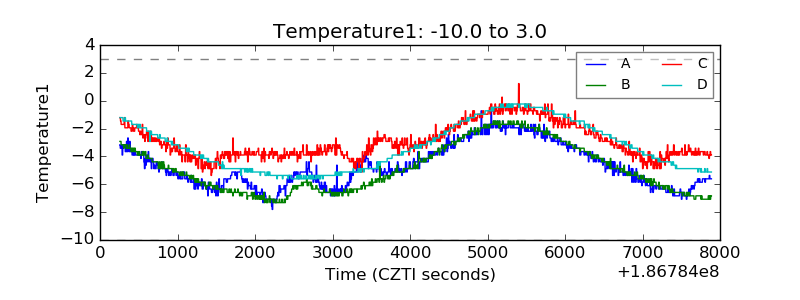 |
| Veto HV Monitor | 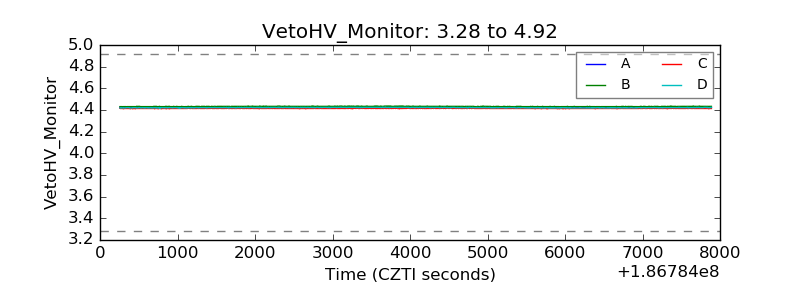 |
| Veto LLD | 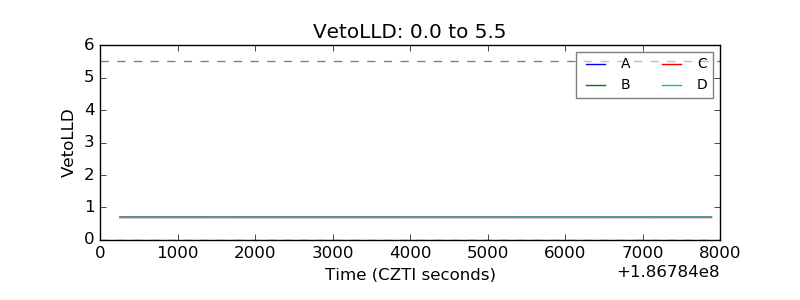 |
| Alpha Counter | 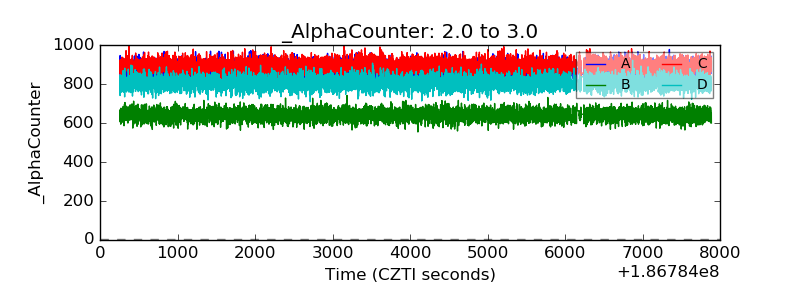 |
| _CPM_Rate | 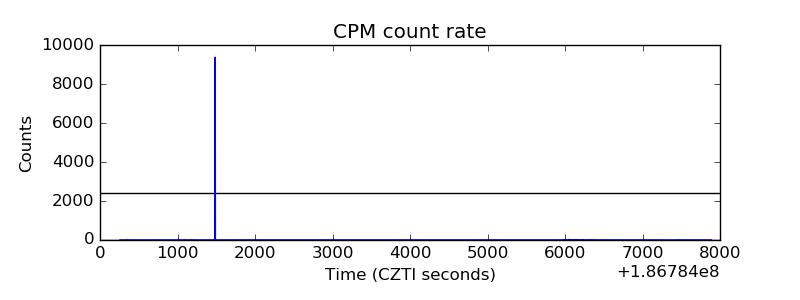 |
| CZT Counter |  |
| +2.5 Volts monitor |  |
| +5 Volts monitor |  |
| _ROLL_ROT | 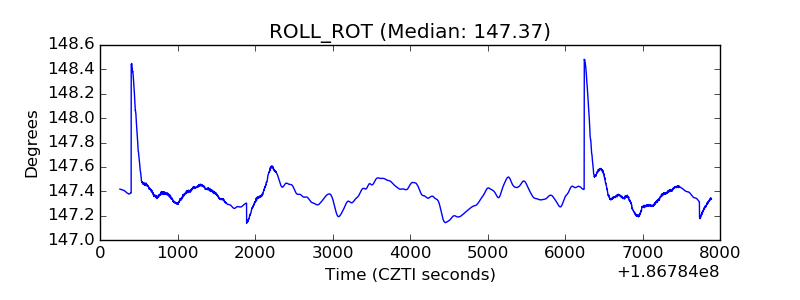 |
| _Roll_DEC | 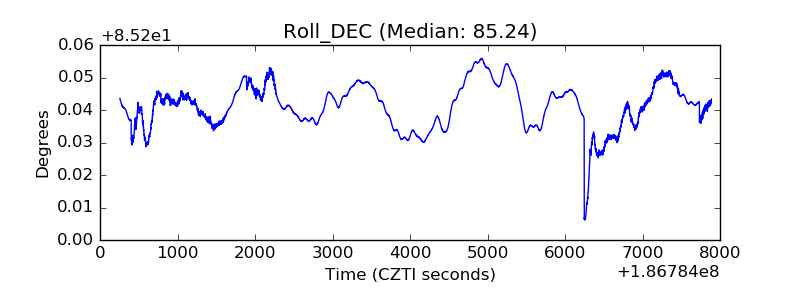 |
| _Roll_RA | 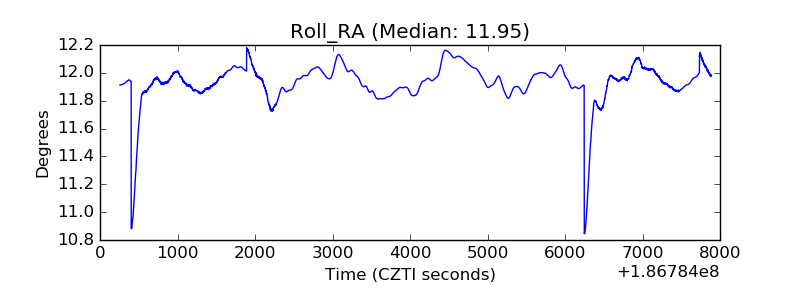 |
| Veto Counter | 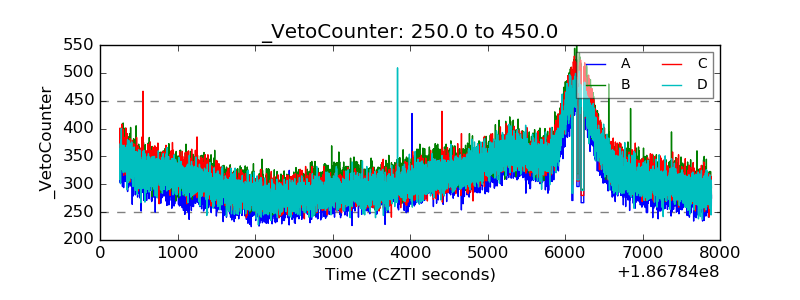 |