| Param | Original file | Final file |
|---|---|---|
| Filename | modeM0/AS1P01_998T01_9000000188_00975cztM0_level2.evt | modeM0/AS1P01_998T01_9000000188_00975cztM0_level2_quad_clean.evt |
| Size (bytes) | 1,303,804,800 | 117,786,240 |
| Size | 1.2 GB | 112.3 MB |
| Events in quadrant A | 9,738,271 | 767,040 |
| Events in quadrant B | 10,122,589 | 768,895 |
| Events in quadrant C | 9,882,467 | 752,384 |
| Events in quadrant D | 9,223,781 | 733,446 |
| Mode M0 | |||
|---|---|---|---|
| Quadrant | BADHDUFLAG | Total packets | Discarded packets |
| A | 0 | 34485 | 0 |
| B | 0 | 35604 | 0 |
| C | 0 | 34892 | 0 |
| D | 0 | 33028 | 0 |
| Mode M9 | |||
|---|---|---|---|
| Quadrant | BADHDUFLAG | Total packets | Discarded packets |
| A | 0 | 2 | 0 |
| B | 0 | 2 | 0 |
| C | 0 | 2 | 0 |
| D | 0 | 2 | 0 |
| Mode SS | |||
|---|---|---|---|
| Quadrant | BADHDUFLAG | Total packets | Discarded packets |
| A | 0 | 162 | 0 |
| B | 0 | 162 | 0 |
| C | 0 | 162 | 0 |
| D | 0 | 162 | 0 |
| Quadrant | Total seconds | Saturated seconds | Saturation percentage |
|---|---|---|---|
| A | 7842 | 10 | 0.127518% |
| B | 7841 | 34 | 0.433618% |
| C | 7842 | 31 | 0.395307% |
| D | 7842 | 119 | 1.517470% |
Noise dominated data is calculated using 1-second bins in cleaned event files. If a bin has >2000 counts, and if more than 50% of those come from <1% of pixels, then it is considered to be noise-dominated and hence unusable.
| Quadrant | # 1 sec bins | Bins with >0 counts | Bins with >2000 counts | High rate bins dominated by noise | Noise dominated (total time) | Noise dominated (detector-on time) | Marked lightcurve |
|---|---|---|---|---|---|---|---|
| A | 8117 | 7847 | 458 | 458 | 5.64% | 5.84% | 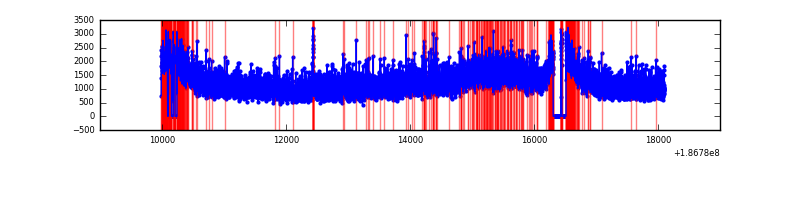 |
| B | 8116 | 7846 | 551 | 551 | 6.79% | 7.02% | 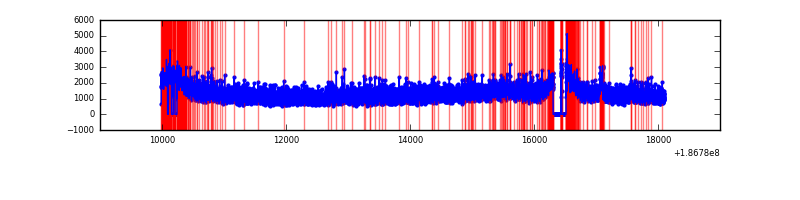 |
| C | 8117 | 7847 | 471 | 471 | 5.80% | 6.00% | 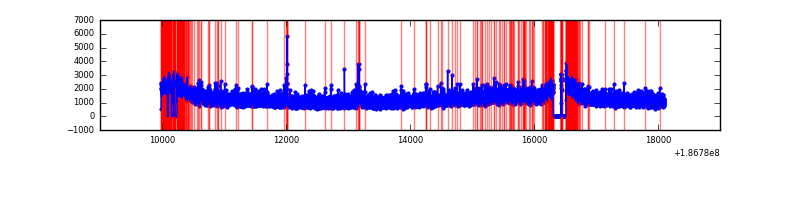 |
| D | 8117 | 7847 | 452 | 452 | 5.57% | 5.76% | 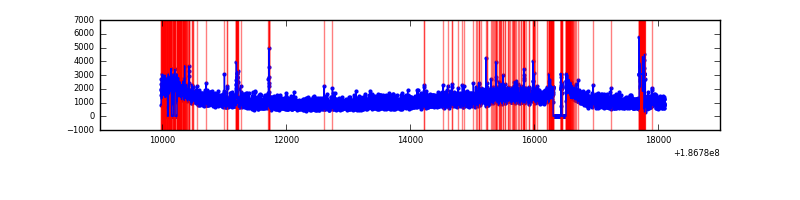 |
Top three noisy pixels from each quadrant. If the there are fewer than three noisy pixels in the level2.evt file, extra rows are filled as -1
| Pixel properties | Quadrant properties | ||||||
|---|---|---|---|---|---|---|---|
| Quadrant | DetID | PixID | Counts | Sigma | Mean | Median | Sigma |
| A | 14 | 170 | 315282 | 530.96 | 2443 | 2454 | 589.2 |
| A | 12 | 189 | 32706 | 51.35 | 2443 | 2454 | 589.2 |
| A | 10 | 133 | 13473 | 18.7 | 2443 | 2454 | 589.2 |
| B | 0 | 220 | 77713 | 123.24 | 2580 | 2590 | 609.5 |
| B | 5 | 200 | 71675 | 113.34 | 2580 | 2590 | 609.5 |
| B | 5 | 249 | 42877 | 66.09 | 2580 | 2590 | 609.5 |
| C | 15 | 241 | 381005 | 572.97 | 2377 | 2464 | 660.7 |
| C | 9 | 52 | 47636 | 68.37 | 2377 | 2464 | 660.7 |
| C | 3 | 111 | 38500 | 54.55 | 2377 | 2464 | 660.7 |
| D | 1 | 4 | 276228 | 391.73 | 2255 | 2334 | 699.2 |
| D | 2 | 63 | 264540 | 375.01 | 2255 | 2334 | 699.2 |
| D | 1 | 83 | 48806 | 66.46 | 2255 | 2334 | 699.2 |
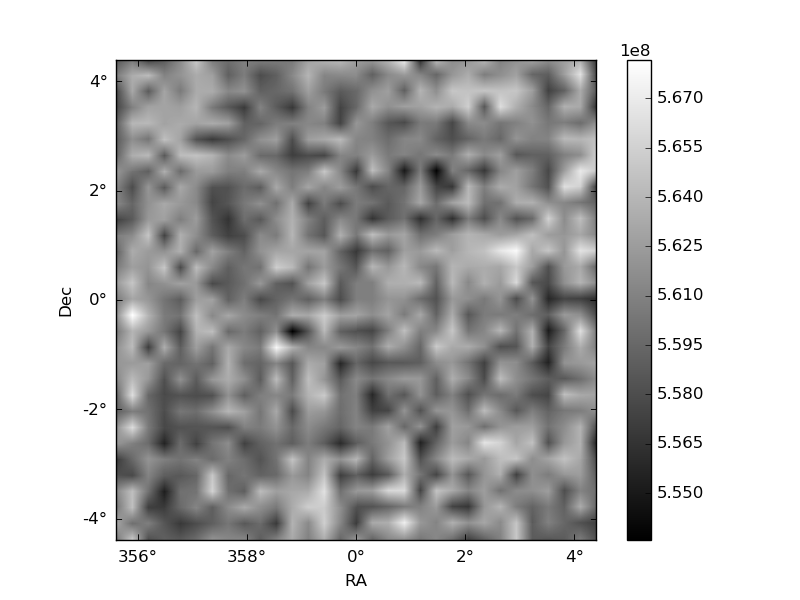
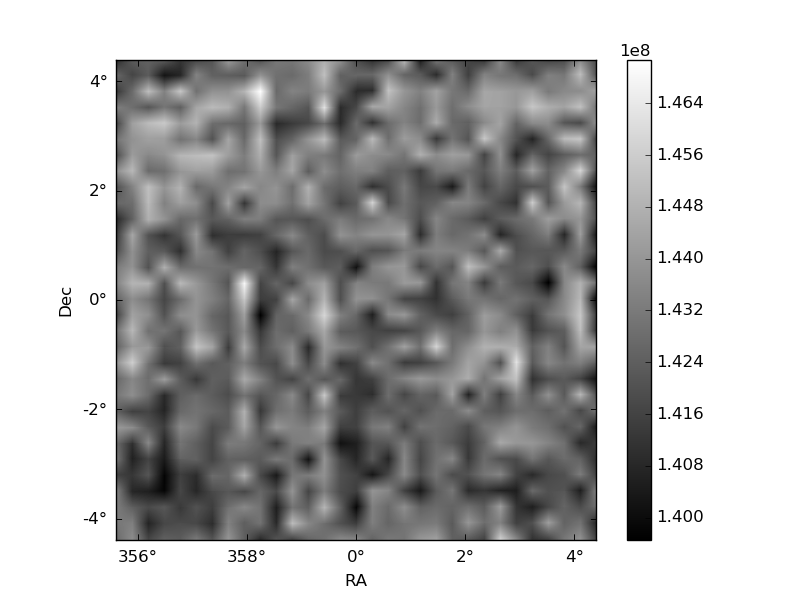
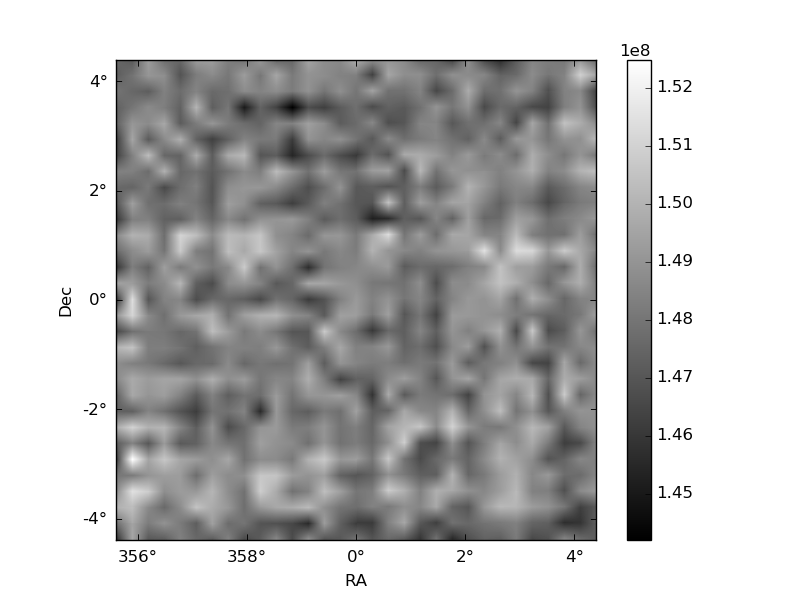
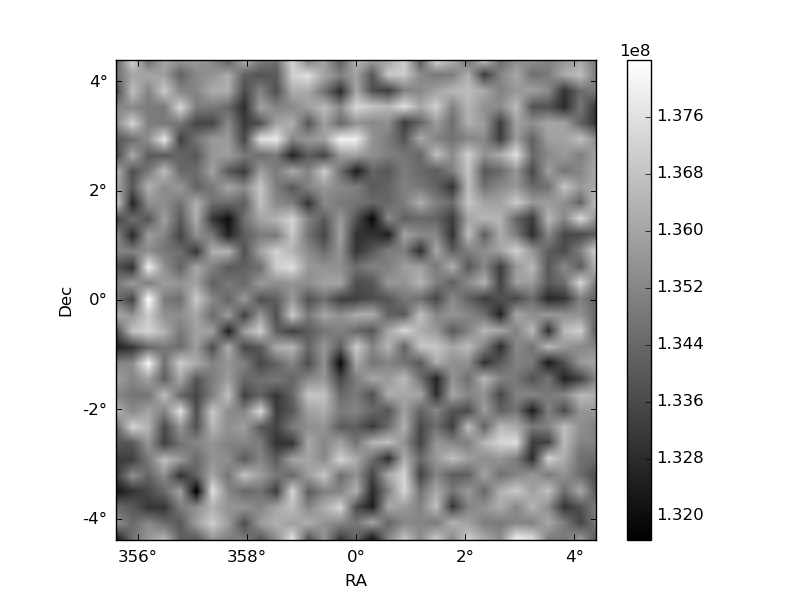
Histogram calculated using DETX and DETY for each event in the final _common_clean file
| Quadrant A | 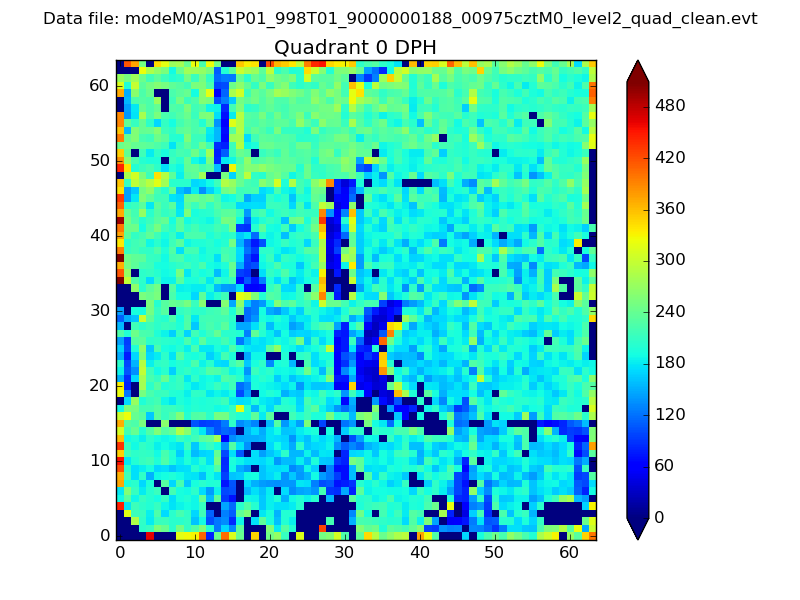 |
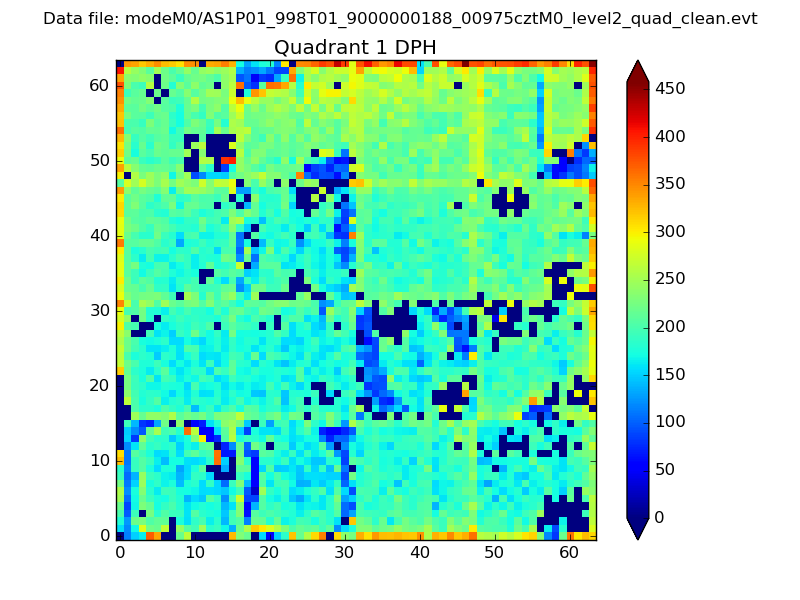 |
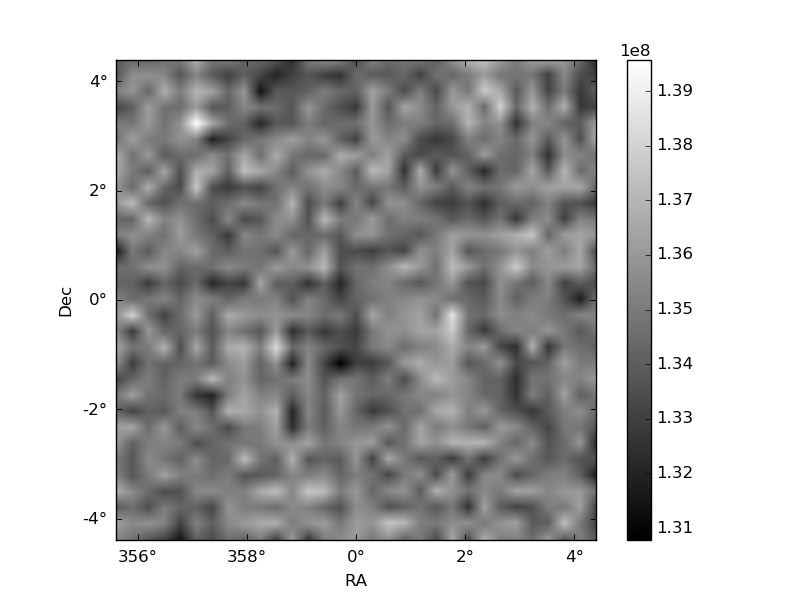
Quadrant B |
|---|---|---|---|
| Quadrant D | 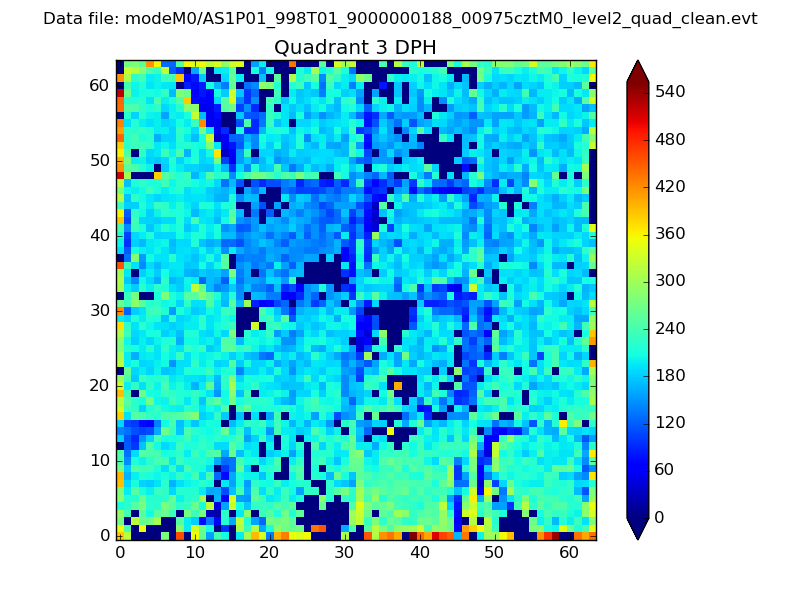 |
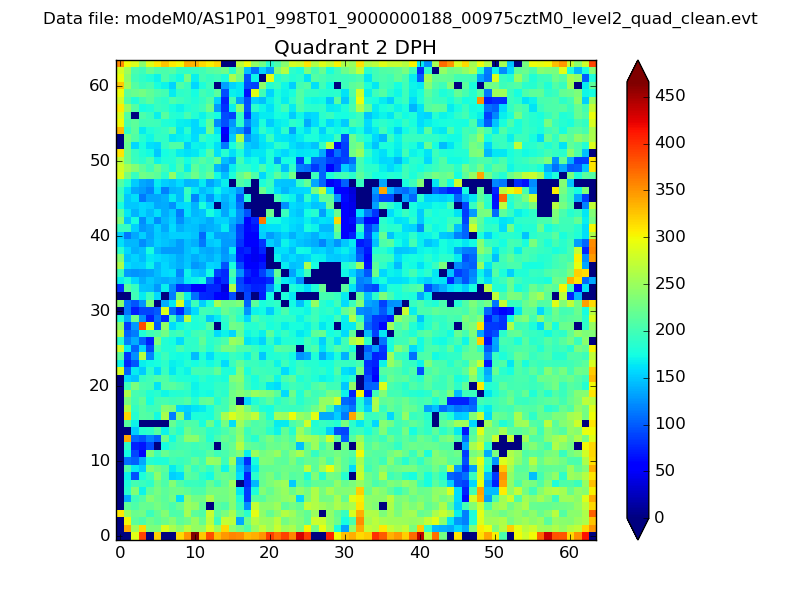 |
Quadrant C |
| Plot type | Count rate plots | Images |
|---|---|---|
| Comparison with Poisson distribution Blue bars denote a histogram of data divided into 1 sec bins. Red curve is a Poisson curve with rate = median count rate of data. |
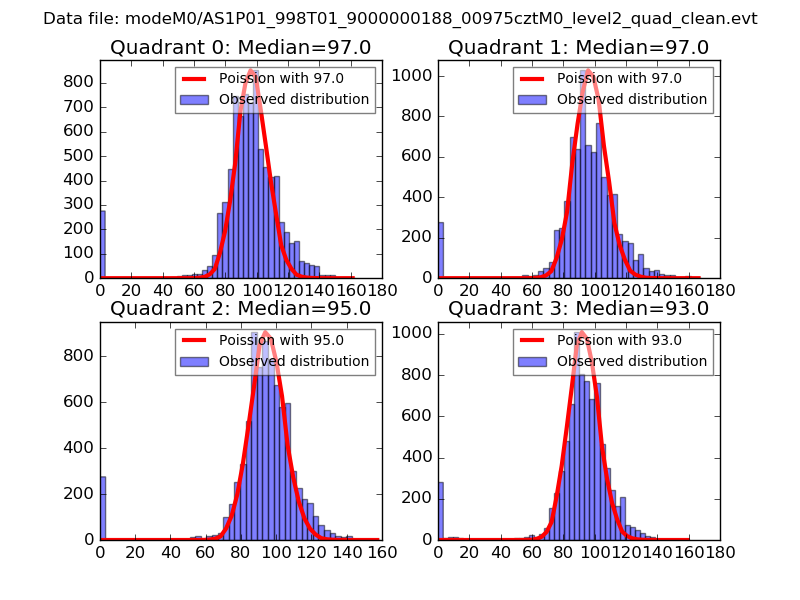 |
 |
| Quadrant-wise count rates Data is divided into 100 sec bins |
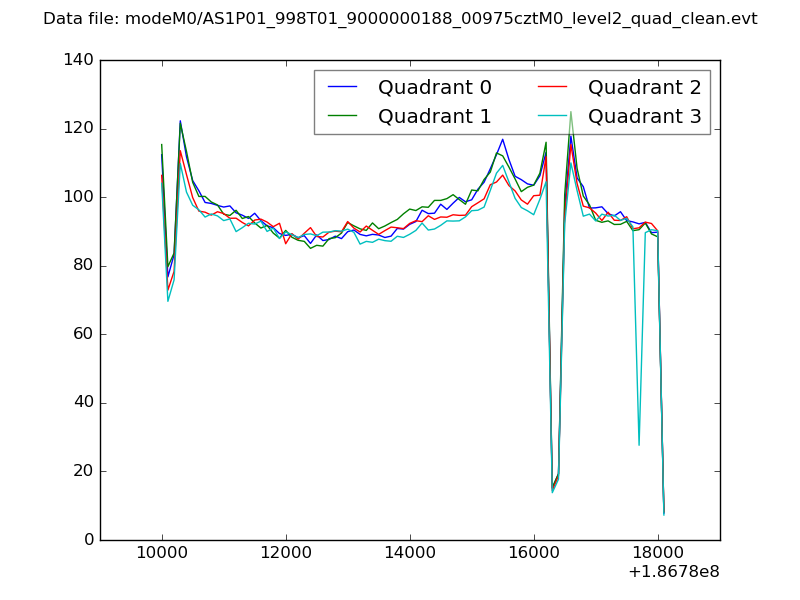 |
|
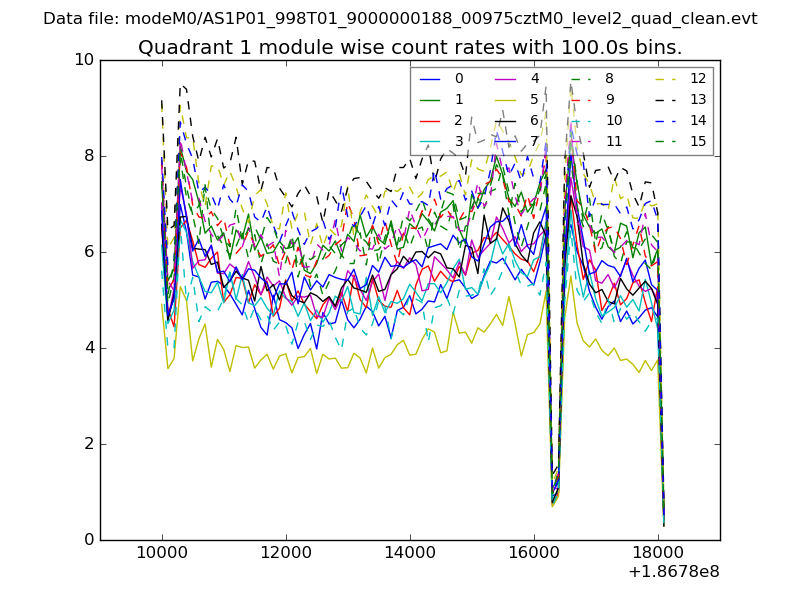
| Module-wise count rates for Quadrant A Data is divided into 100 sec bins |
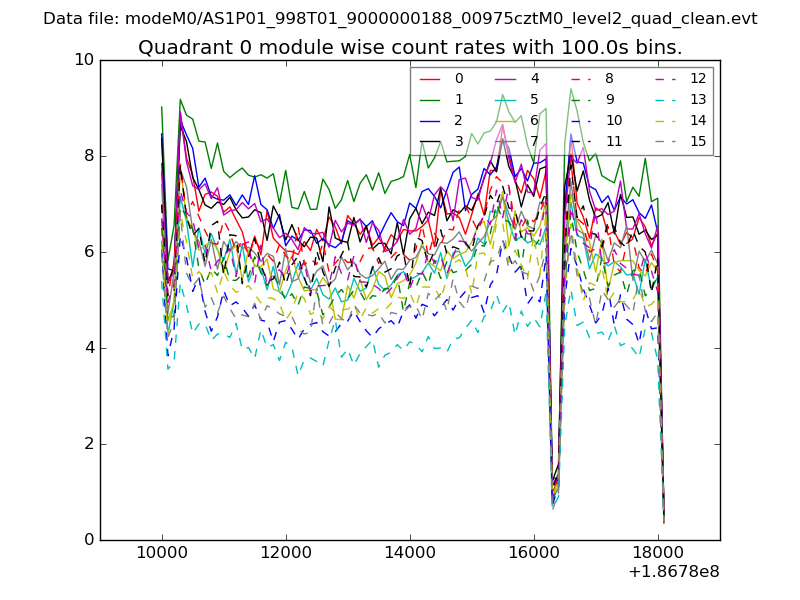 |
 |
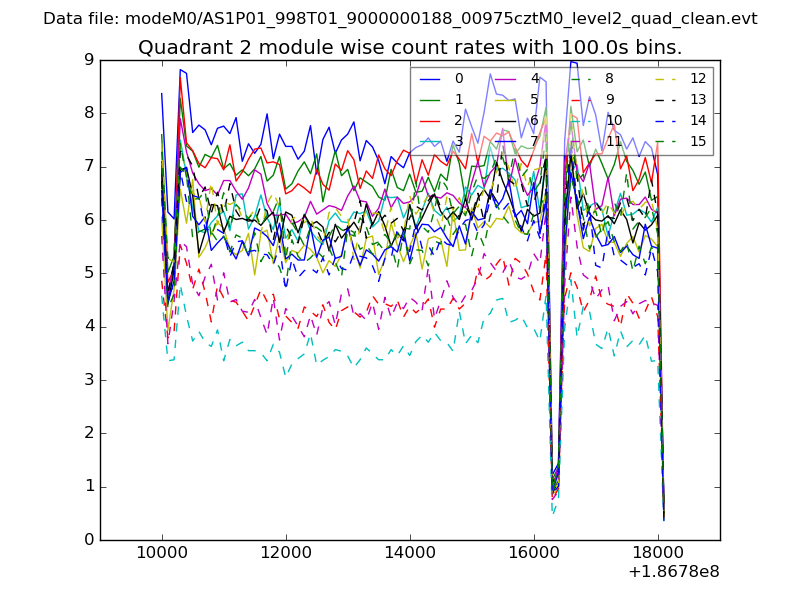
| Module-wise count rates for Quadrant B Data is divided into 100 sec bins |
 |
 |
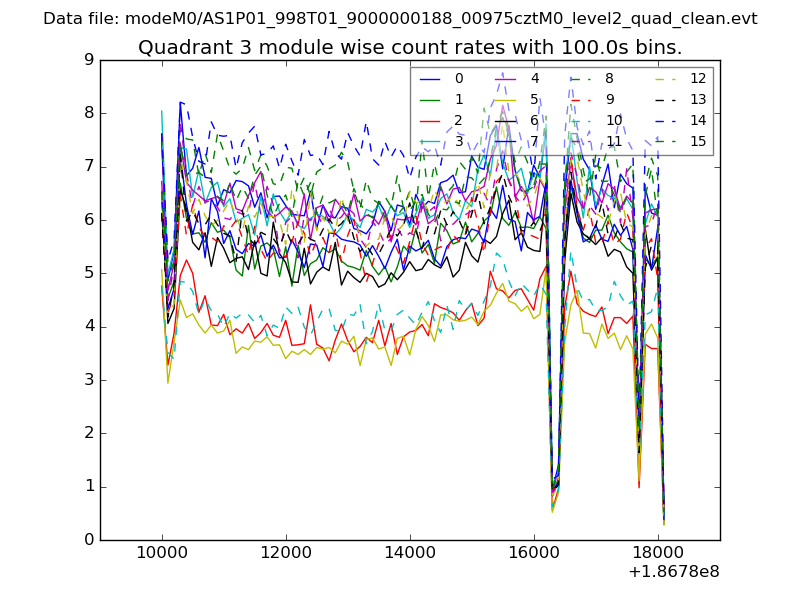
| Module-wise count rates for Quadrant C Data is divided into 100 sec bins |
 |
 |
| Module-wise count rates for Quadrant D Data is divided into 100 sec bins |
 |
 |
| Parameter | Plot |
|---|---|
| CZT HV Monitor | 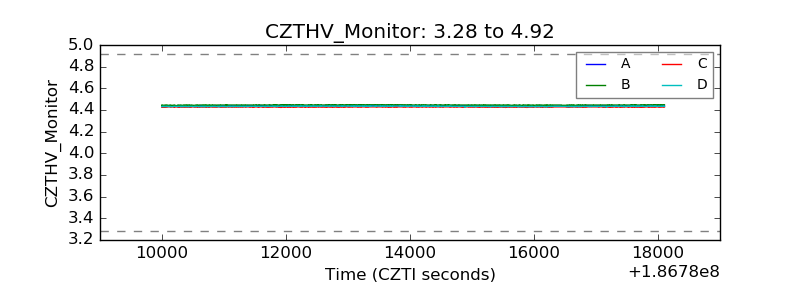 |
| D_VDD | 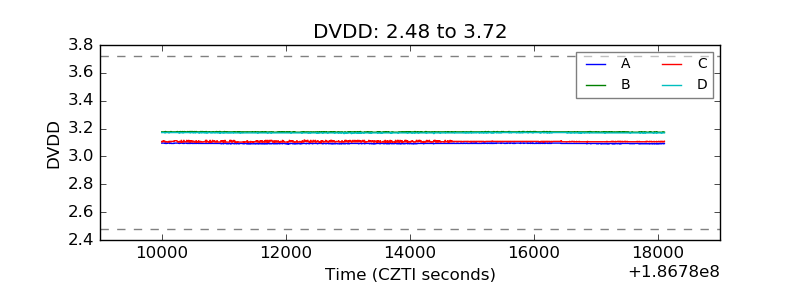 |
| Temperature 1 | 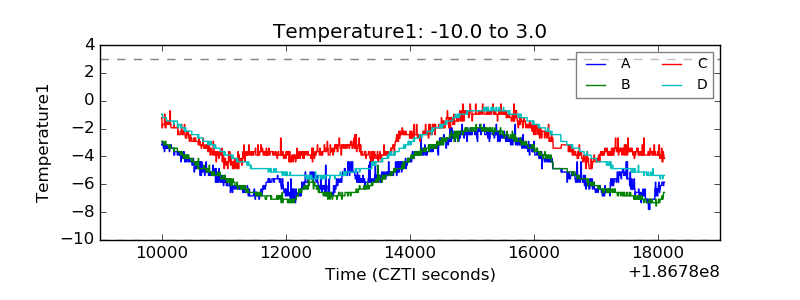 |
| Veto HV Monitor | 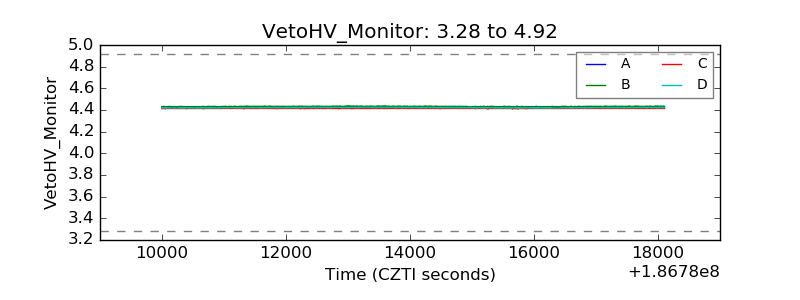 |
| Veto LLD |  |
| Alpha Counter | 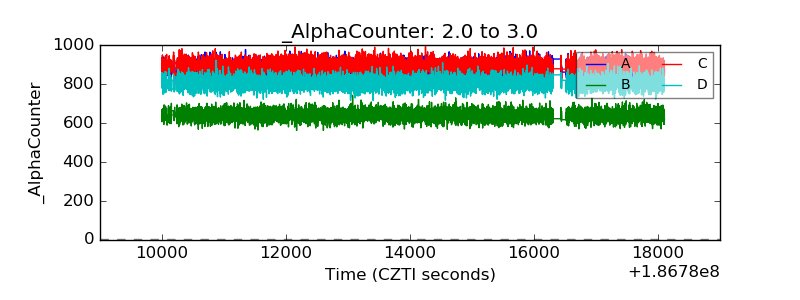 |
| _CPM_Rate | 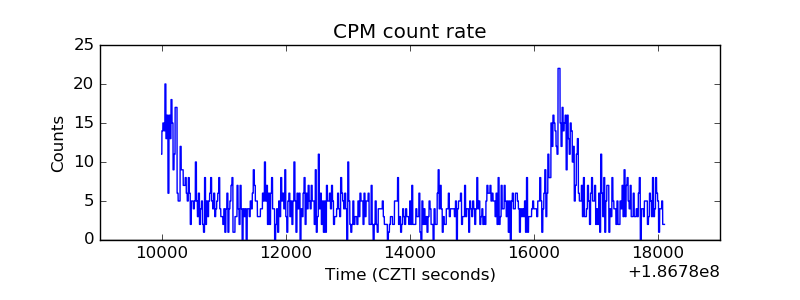 |
| CZT Counter | 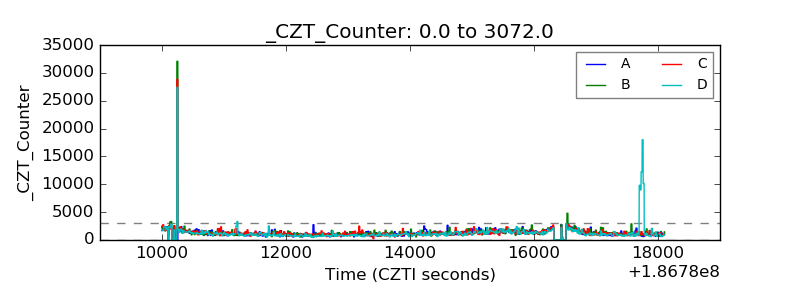 |
| +2.5 Volts monitor |  |
| +5 Volts monitor | 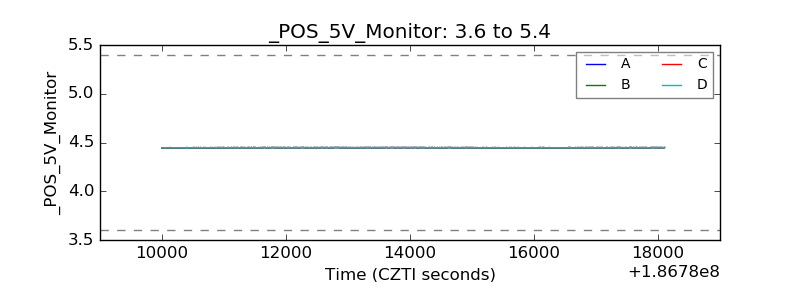 |
| _ROLL_ROT |  |
| _Roll_DEC | 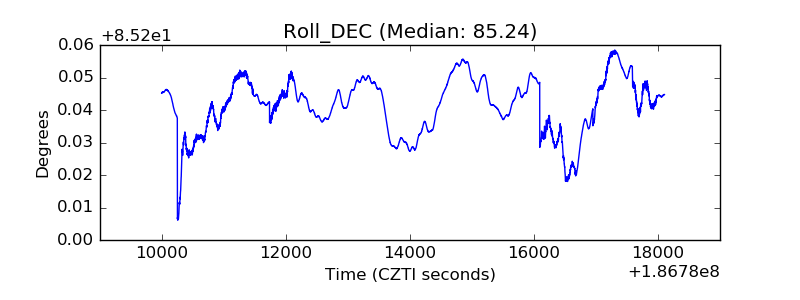 |
| _Roll_RA | 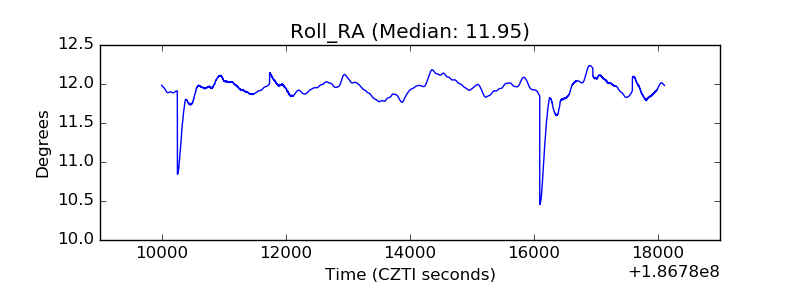 |
| Veto Counter | 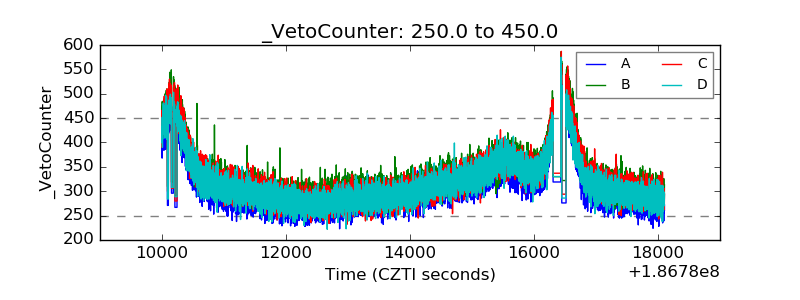 |