| Param | Original file | Final file |
|---|---|---|
| Filename | modeM0/AS1P01_998T01_9000000188_00976cztM0_level2.evt | modeM0/AS1P01_998T01_9000000188_00976cztM0_level2_quad_clean.evt |
| Size (bytes) | 1,145,586,240 | 107,182,080 |
| Size | 1.1 GB | 102.2 MB |
| Events in quadrant A | 8,464,525 | 695,155 |
| Events in quadrant B | 9,185,264 | 691,865 |
| Events in quadrant C | 8,650,318 | 683,759 |
| Events in quadrant D | 7,911,796 | 669,028 |
| Mode M0 | |||
|---|---|---|---|
| Quadrant | BADHDUFLAG | Total packets | Discarded packets |
| A | 0 | 30321 | 0 |
| B | 0 | 32398 | 0 |
| C | 0 | 30871 | 0 |
| D | 0 | 28714 | 0 |
| Mode M9 | |||
|---|---|---|---|
| Quadrant | BADHDUFLAG | Total packets | Discarded packets |
| A | 0 | 4 | 0 |
| B | 0 | 4 | 0 |
| C | 0 | 4 | 0 |
| D | 0 | 4 | 0 |
| Mode SS | |||
|---|---|---|---|
| Quadrant | BADHDUFLAG | Total packets | Discarded packets |
| A | 0 | 148 | 0 |
| B | 0 | 148 | 0 |
| C | 0 | 148 | 0 |
| D | 0 | 148 | 0 |
| Quadrant | Total seconds | Saturated seconds | Saturation percentage |
|---|---|---|---|
| A | 7271 | 2 | 0.027507% |
| B | 7271 | 34 | 0.467611% |
| C | 7271 | 17 | 0.233806% |
| D | 7272 | 90 | 1.237624% |
Noise dominated data is calculated using 1-second bins in cleaned event files. If a bin has >2000 counts, and if more than 50% of those come from <1% of pixels, then it is considered to be noise-dominated and hence unusable.
| Quadrant | # 1 sec bins | Bins with >0 counts | Bins with >2000 counts | High rate bins dominated by noise | Noise dominated (total time) | Noise dominated (detector-on time) | Marked lightcurve |
|---|---|---|---|---|---|---|---|
| A | 7676 | 7272 | 180 | 180 | 2.34% | 2.48% | 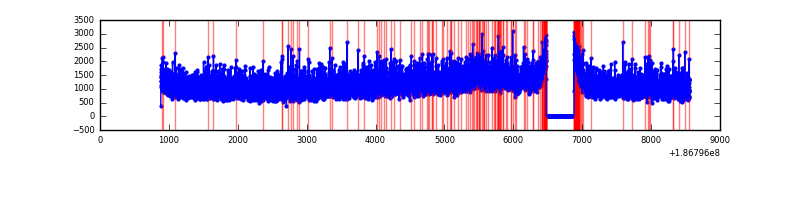 |
| B | 7676 | 7272 | 314 | 314 | 4.09% | 4.32% | 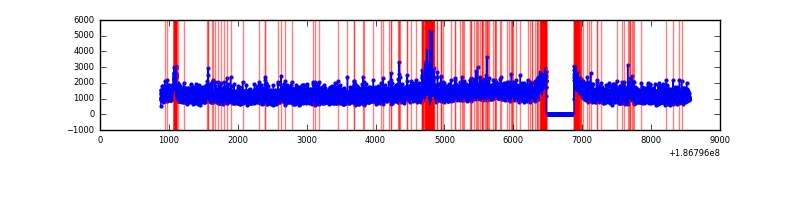 |
| C | 7676 | 7272 | 175 | 175 | 2.28% | 2.41% | 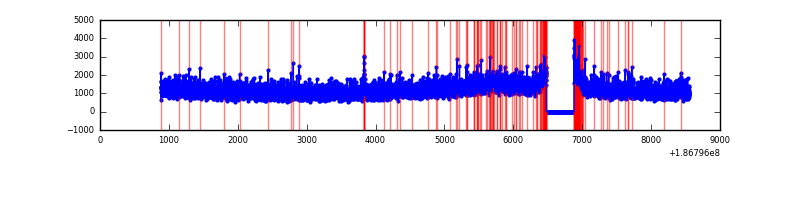 |
| D | 7677 | 7273 | 188 | 188 | 2.45% | 2.58% |  |
Top three noisy pixels from each quadrant. If the there are fewer than three noisy pixels in the level2.evt file, extra rows are filled as -1
| Pixel properties | Quadrant properties | ||||||
|---|---|---|---|---|---|---|---|
| Quadrant | DetID | PixID | Counts | Sigma | Mean | Median | Sigma |
| A | 14 | 170 | 132347 | 251.07 | 2165 | 2186 | 518.4 |
| A | 11 | 79 | 11997 | 18.92 | 2165 | 2186 | 518.4 |
| A | 12 | 189 | 10813 | 16.64 | 2165 | 2186 | 518.4 |
| B | 5 | 249 | 170261 | 311.83 | 2279 | 2291 | 538.7 |
| B | 0 | 220 | 113770 | 206.95 | 2279 | 2291 | 538.7 |
| B | 15 | 22 | 84869 | 153.3 | 2279 | 2291 | 538.7 |
| C | 15 | 241 | 351729 | 603.6 | 2083 | 2154 | 579.1 |
| C | 3 | 111 | 31389 | 50.48 | 2083 | 2154 | 579.1 |
| C | 3 | 79 | 30101 | 48.25 | 2083 | 2154 | 579.1 |
| D | 2 | 63 | 269080 | 438.39 | 1967 | 2038 | 609.1 |
| D | 1 | 4 | 182536 | 296.32 | 1967 | 2038 | 609.1 |
| D | 13 | 169 | 21078 | 31.26 | 1967 | 2038 | 609.1 |
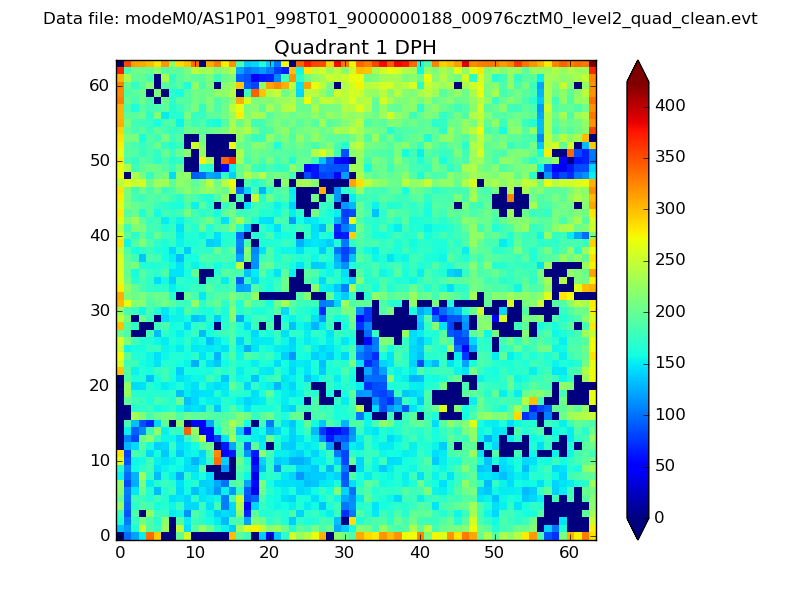
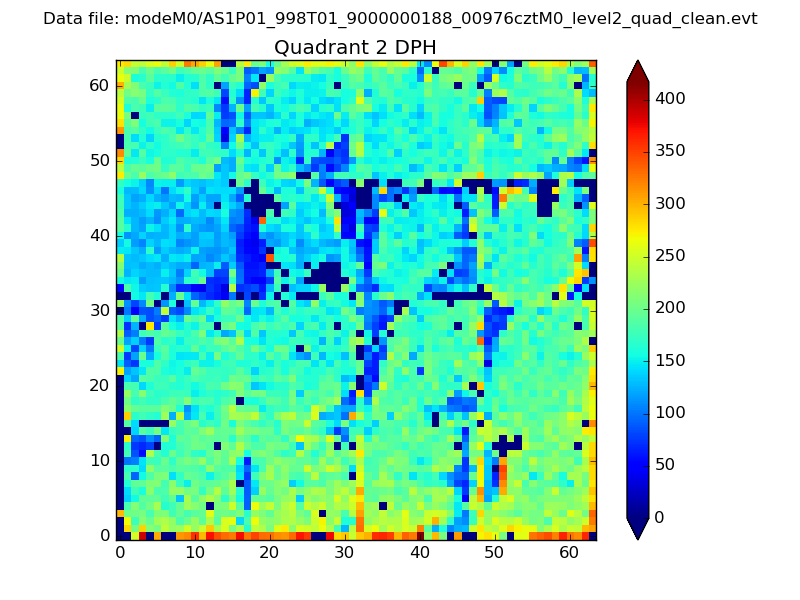
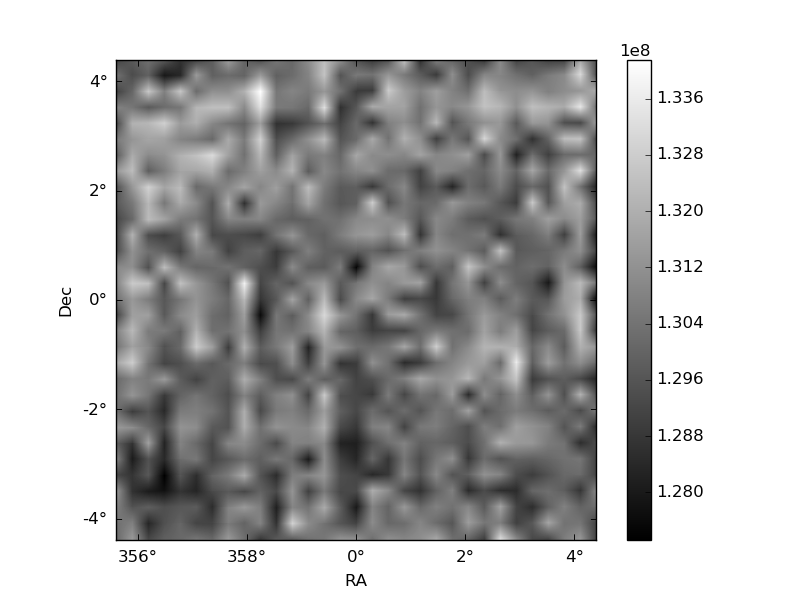
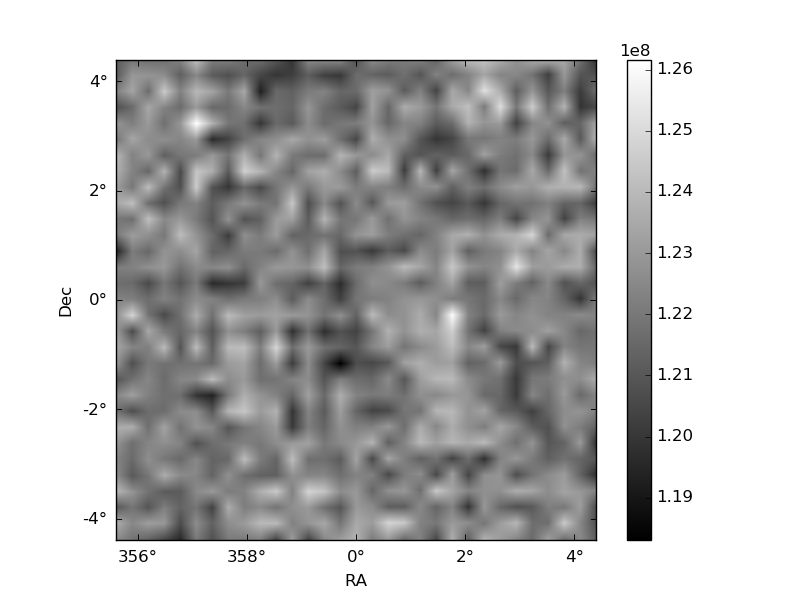
Histogram calculated using DETX and DETY for each event in the final _common_clean file
| Quadrant A | 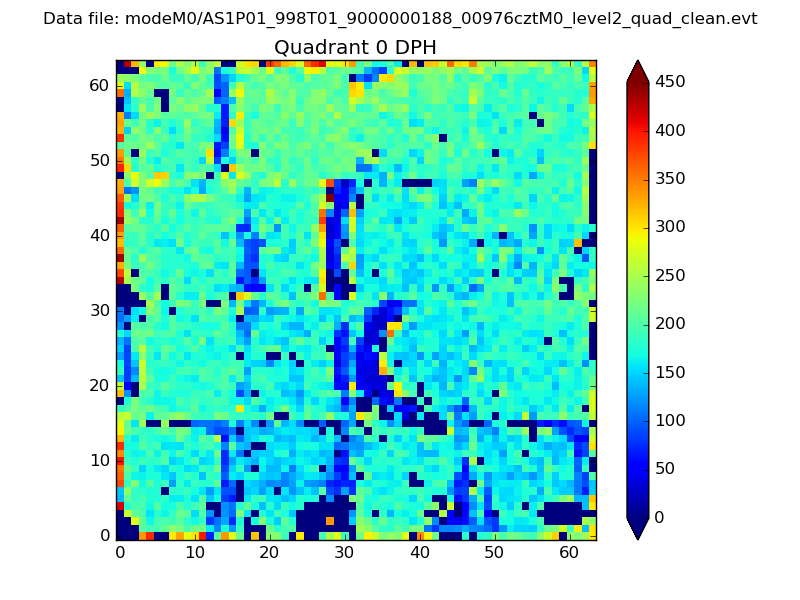 |
 |
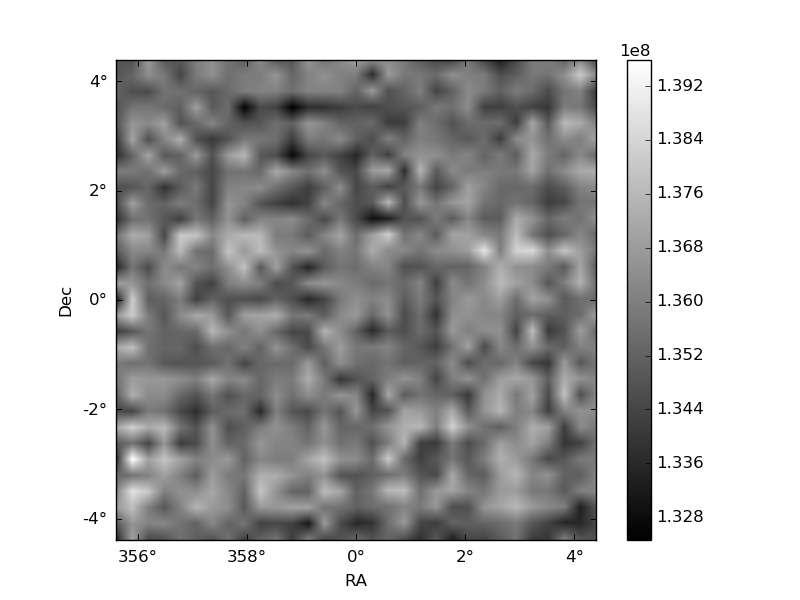
Quadrant B |
|---|---|---|---|
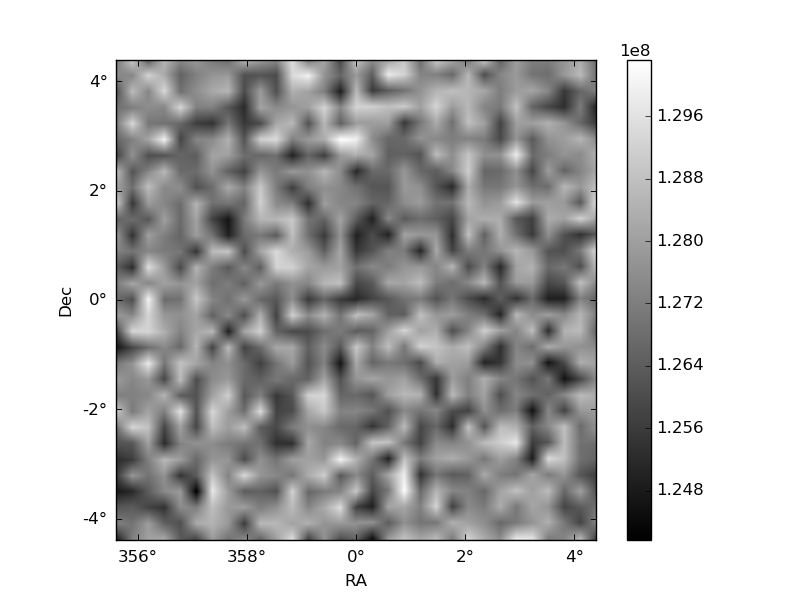
| Quadrant D | 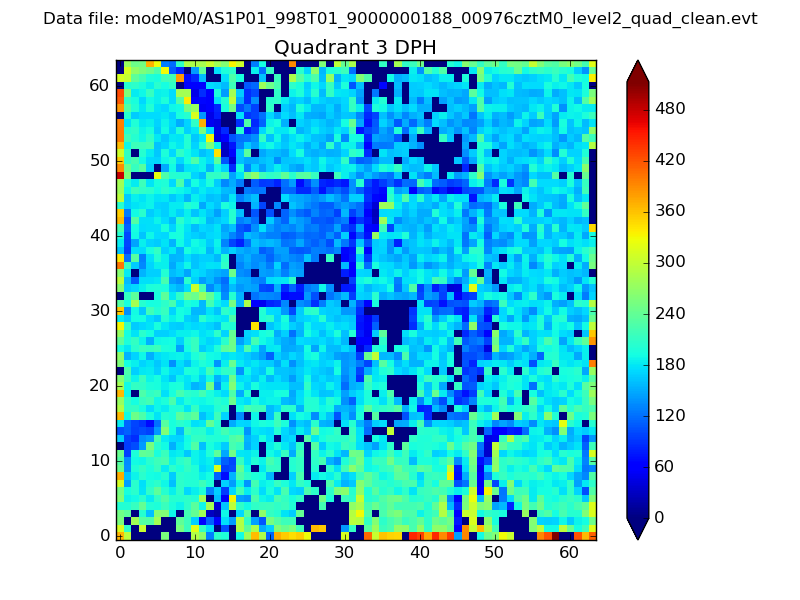 |
 |
Quadrant C |
| Plot type | Count rate plots | Images |
|---|---|---|
| Comparison with Poisson distribution Blue bars denote a histogram of data divided into 1 sec bins. Red curve is a Poisson curve with rate = median count rate of data. |
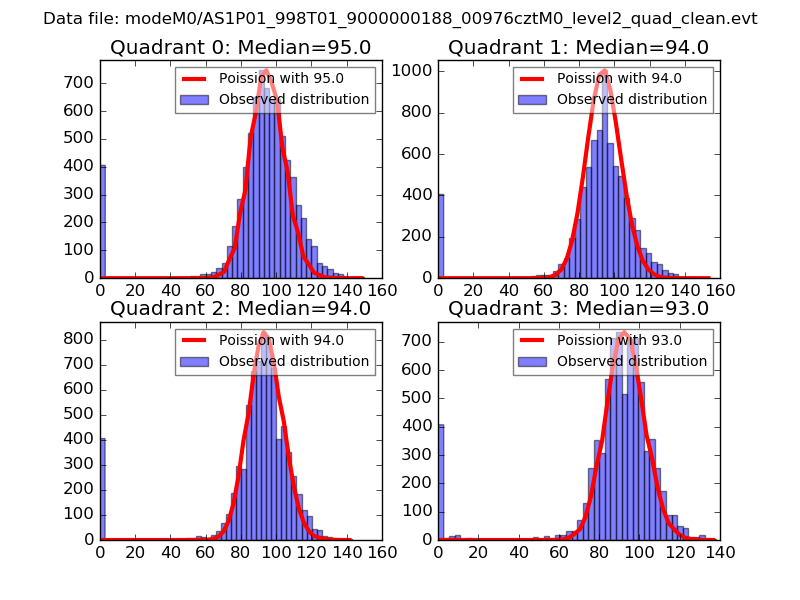 |
 |
| Quadrant-wise count rates Data is divided into 100 sec bins |
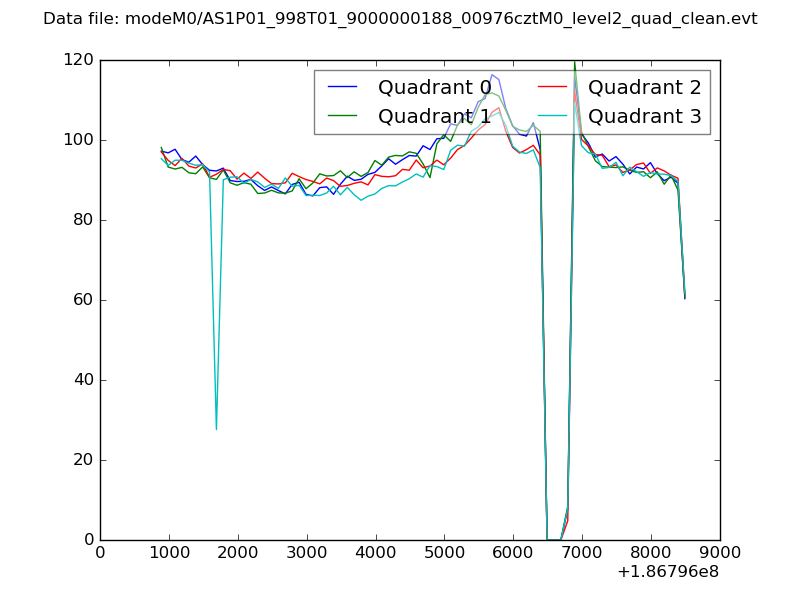 |
|
| Module-wise count rates for Quadrant A Data is divided into 100 sec bins |
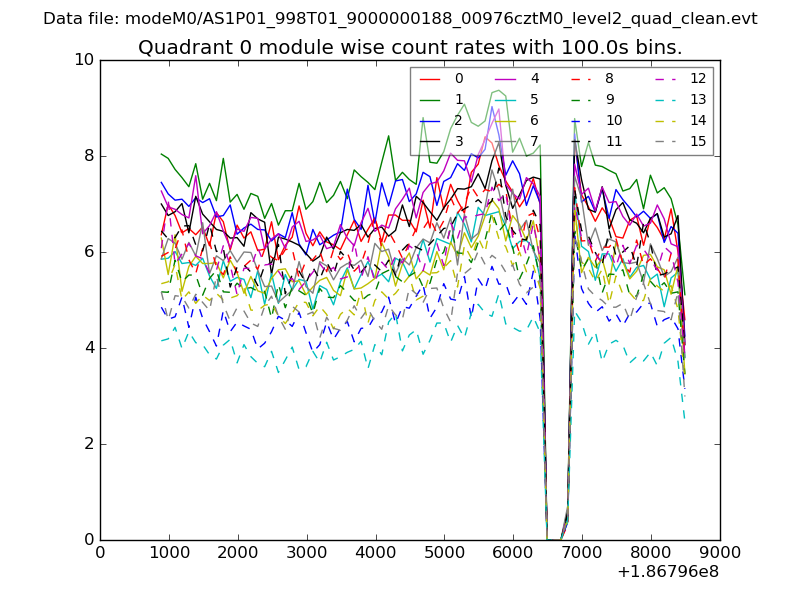 |
 |
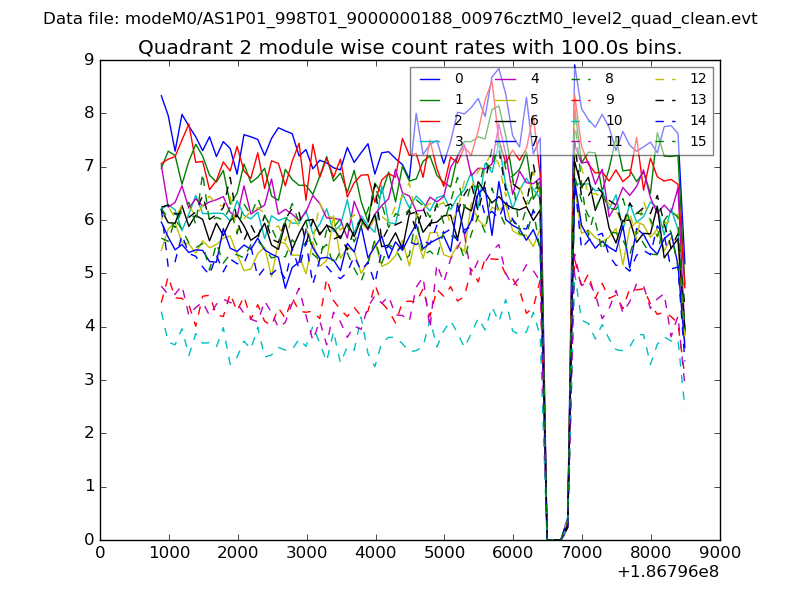
| Module-wise count rates for Quadrant B Data is divided into 100 sec bins |
 |
 |
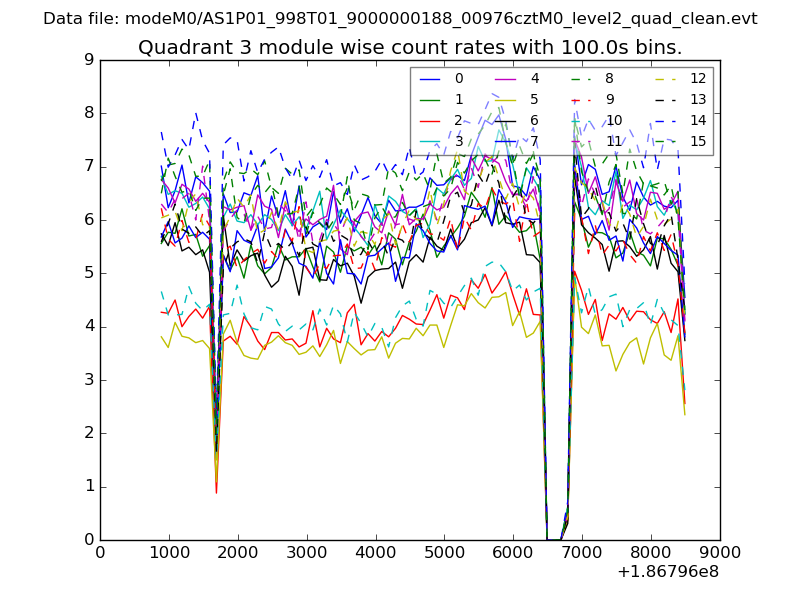
| Module-wise count rates for Quadrant C Data is divided into 100 sec bins |
 |
 |
| Module-wise count rates for Quadrant D Data is divided into 100 sec bins |
 |
 |
| Parameter | Plot |
|---|---|
| CZT HV Monitor | 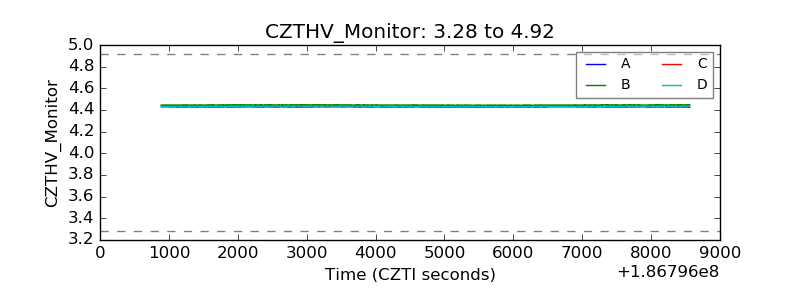 |
| D_VDD | 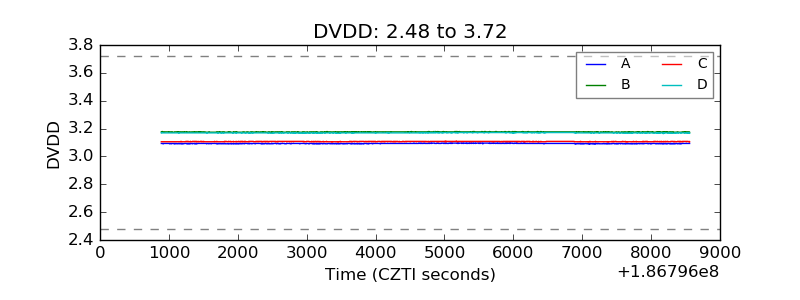 |
| Temperature 1 | 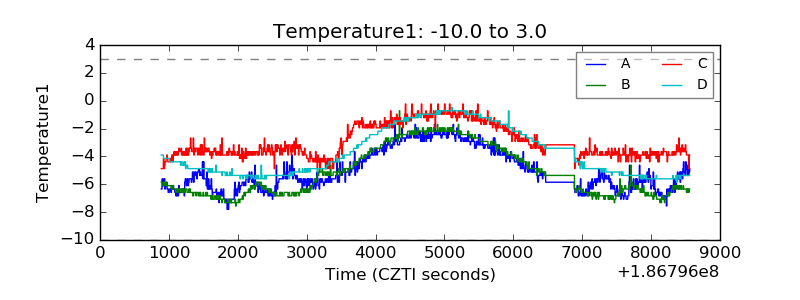 |
| Veto HV Monitor | 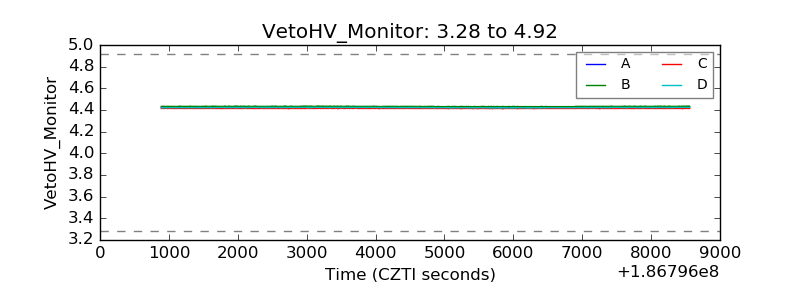 |
| Veto LLD | 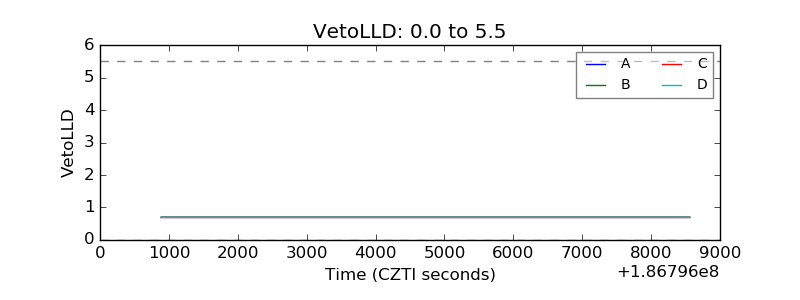 |
| Alpha Counter | 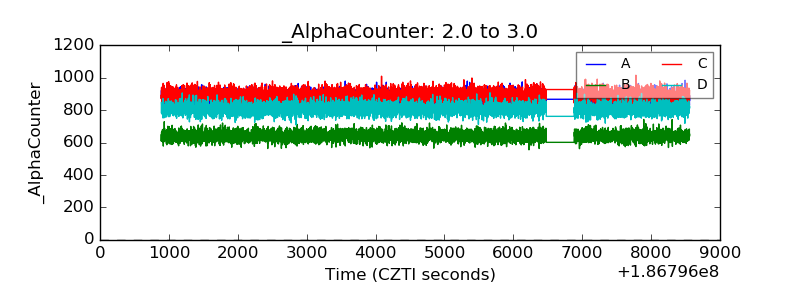 |
| _CPM_Rate | 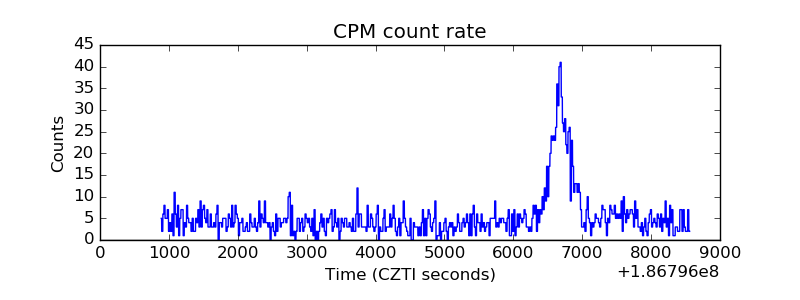 |
| CZT Counter | 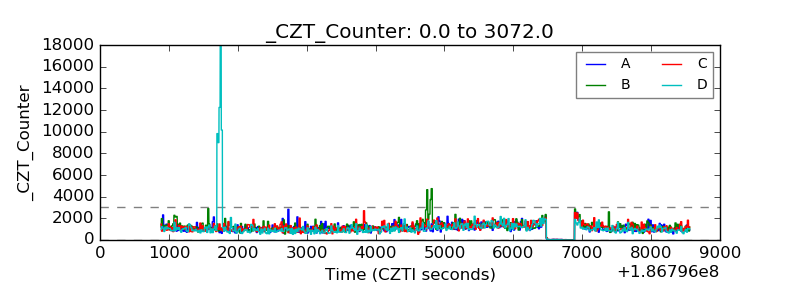 |
| +2.5 Volts monitor |  |
| +5 Volts monitor |  |
| _ROLL_ROT | 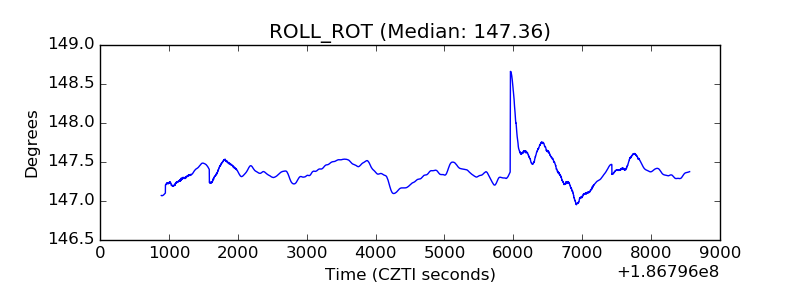 |
| _Roll_DEC | 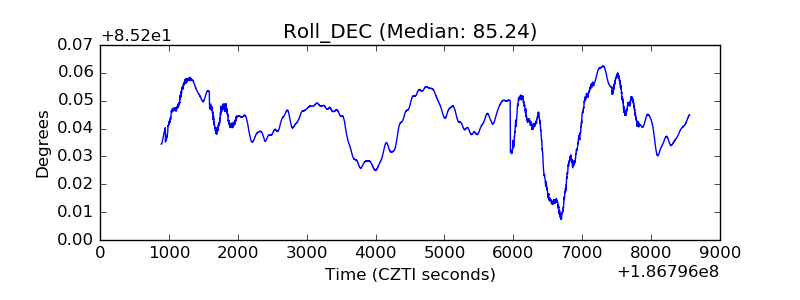 |
| _Roll_RA |  |
| Veto Counter | 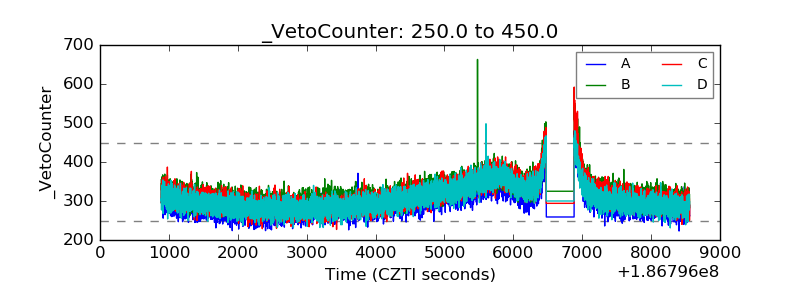 |