| Param | Original file | Final file |
|---|---|---|
| Filename | modeM0/AS1P01_998T01_9000000188_00977cztM0_level2.evt | modeM0/AS1P01_998T01_9000000188_00977cztM0_level2_quad_clean.evt |
| Size (bytes) | 1,144,667,520 | 108,086,400 |
| Size | 1.1 GB | 103.1 MB |
| Events in quadrant A | 8,528,409 | 700,491 |
| Events in quadrant B | 9,162,951 | 701,183 |
| Events in quadrant C | 8,746,545 | 687,026 |
| Events in quadrant D | 7,744,853 | 677,086 |
| Mode M0 | |||
|---|---|---|---|
| Quadrant | BADHDUFLAG | Total packets | Discarded packets |
| A | 0 | 30508 | 0 |
| B | 0 | 32402 | 0 |
| C | 0 | 31180 | 0 |
| D | 0 | 28210 | 0 |
| Mode M9 | |||
|---|---|---|---|
| Quadrant | BADHDUFLAG | Total packets | Discarded packets |
| A | 0 | 7 | 0 |
| B | 0 | 7 | 0 |
| C | 0 | 7 | 0 |
| D | 0 | 7 | 0 |
| Mode SS | |||
|---|---|---|---|
| Quadrant | BADHDUFLAG | Total packets | Discarded packets |
| A | 0 | 148 | 0 |
| B | 0 | 148 | 0 |
| C | 0 | 148 | 0 |
| D | 0 | 148 | 0 |
| Quadrant | Total seconds | Saturated seconds | Saturation percentage |
|---|---|---|---|
| A | 7292 | 6 | 0.082282% |
| B | 7291 | 14 | 0.192018% |
| C | 7291 | 27 | 0.370320% |
| D | 7291 | 8 | 0.109724% |
Noise dominated data is calculated using 1-second bins in cleaned event files. If a bin has >2000 counts, and if more than 50% of those come from <1% of pixels, then it is considered to be noise-dominated and hence unusable.
| Quadrant | # 1 sec bins | Bins with >0 counts | Bins with >2000 counts | High rate bins dominated by noise | Noise dominated (total time) | Noise dominated (detector-on time) | Marked lightcurve |
|---|---|---|---|---|---|---|---|
| A | 7902 | 7294 | 158 | 158 | 2.00% | 2.17% | 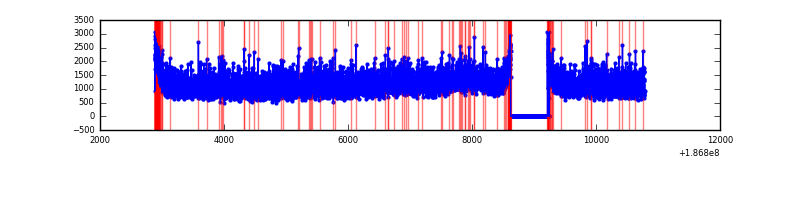 |
| B | 7901 | 7293 | 263 | 263 | 3.33% | 3.61% | 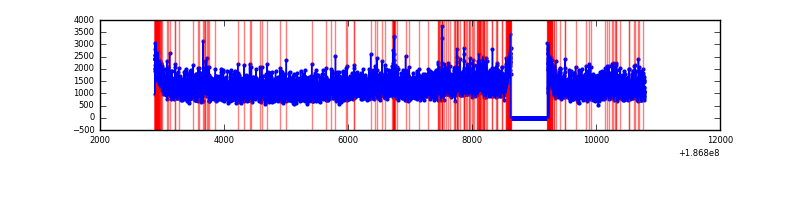 |
| C | 7901 | 7293 | 210 | 210 | 2.66% | 2.88% | 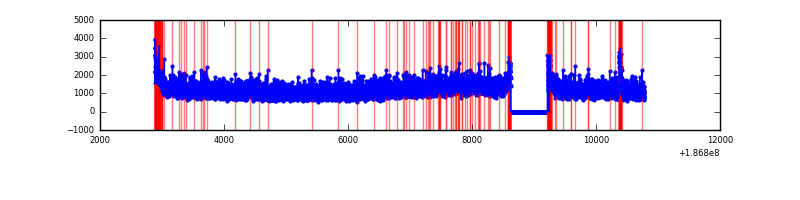 |
| D | 7901 | 7293 | 86 | 86 | 1.09% | 1.18% | 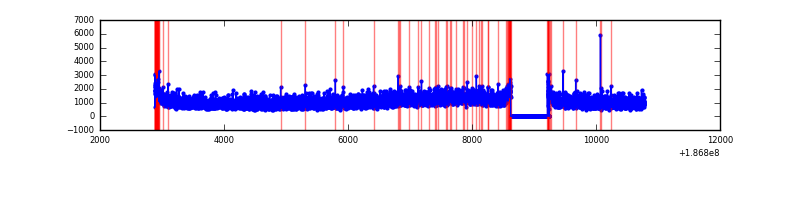 |
Top three noisy pixels from each quadrant. If the there are fewer than three noisy pixels in the level2.evt file, extra rows are filled as -1
| Pixel properties | Quadrant properties | ||||||
|---|---|---|---|---|---|---|---|
| Quadrant | DetID | PixID | Counts | Sigma | Mean | Median | Sigma |
| A | 14 | 170 | 21435 | 35.99 | 2211 | 2227 | 533.7 |
| A | 11 | 242 | 13332 | 20.81 | 2211 | 2227 | 533.7 |
| A | 11 | 79 | 10429 | 15.37 | 2211 | 2227 | 533.7 |
| B | 0 | 220 | 82072 | 144.78 | 2331 | 2347 | 550.7 |
| B | 15 | 22 | 71006 | 124.68 | 2331 | 2347 | 550.7 |
| B | 5 | 249 | 70459 | 123.69 | 2331 | 2347 | 550.7 |
| C | 15 | 241 | 347275 | 589.65 | 2100 | 2171 | 585.3 |
| C | 9 | 52 | 81055 | 134.78 | 2100 | 2171 | 585.3 |
| C | 7 | 159 | 33496 | 53.52 | 2100 | 2171 | 585.3 |
| D | 1 | 4 | 151358 | 238.21 | 2011 | 2081 | 626.7 |
| D | 13 | 170 | 28824 | 42.68 | 2011 | 2081 | 626.7 |
| D | 13 | 73 | 19611 | 27.97 | 2011 | 2081 | 626.7 |
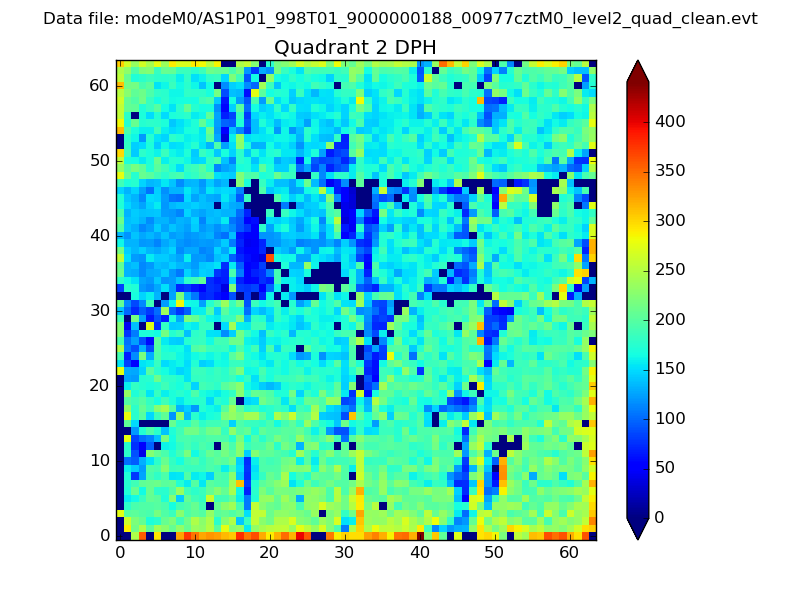
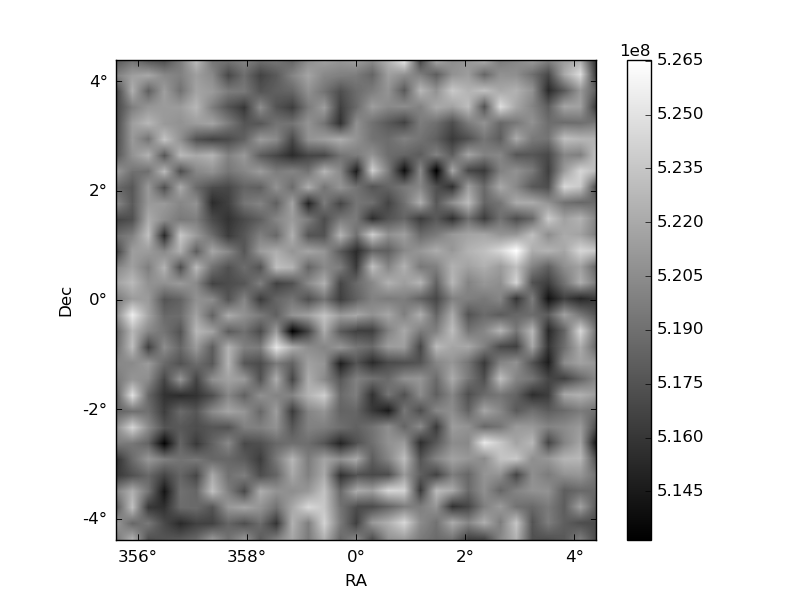
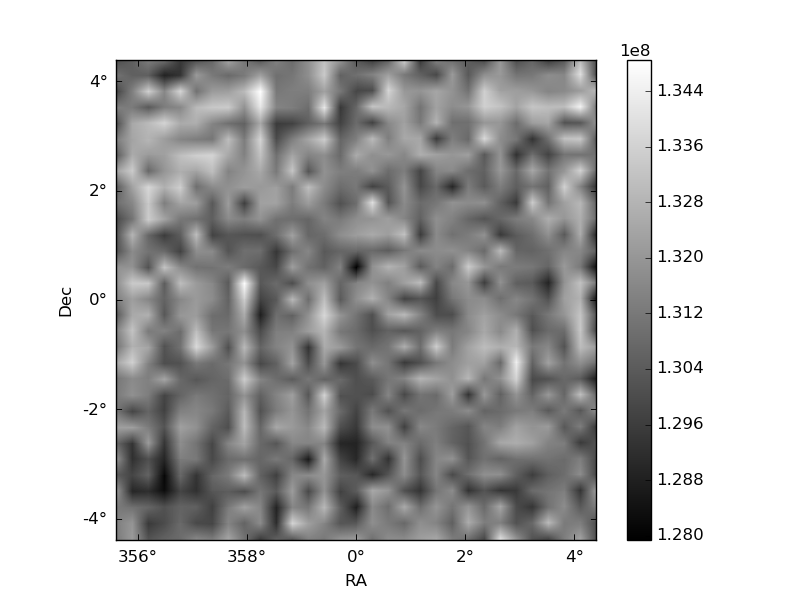
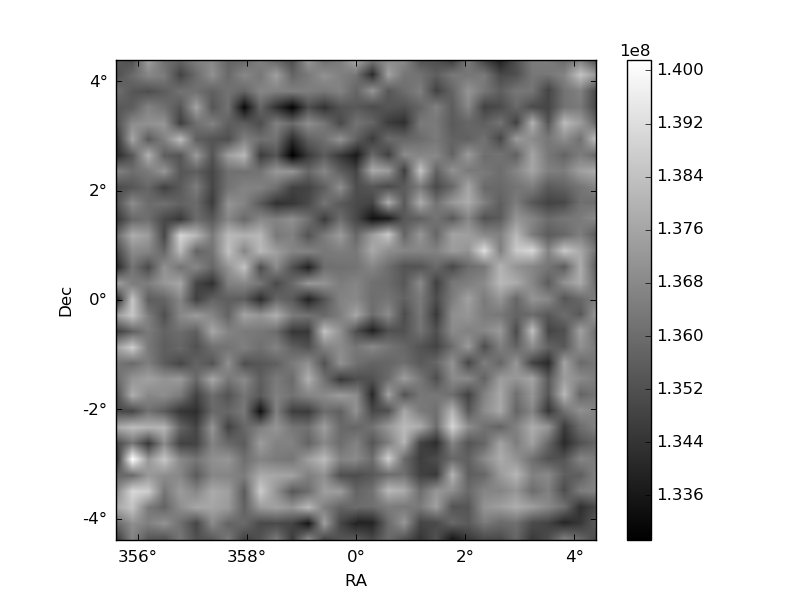
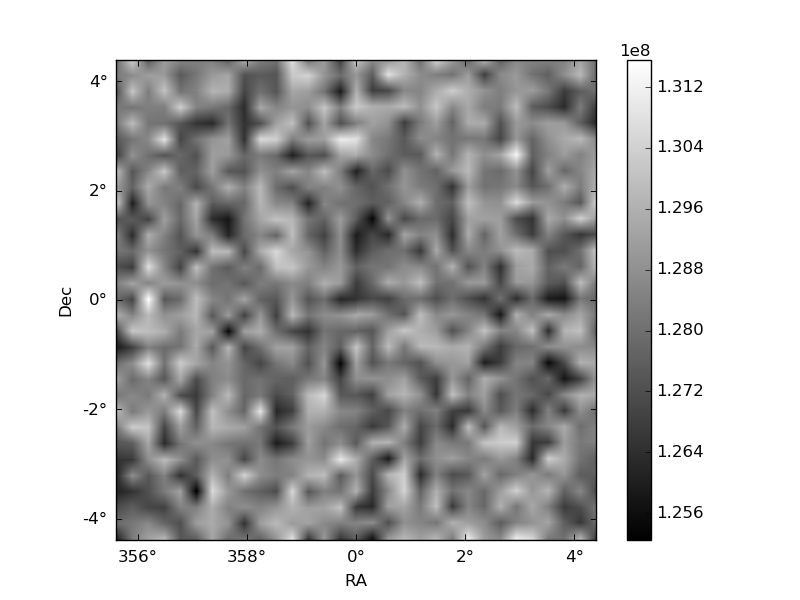
Histogram calculated using DETX and DETY for each event in the final _common_clean file
| Quadrant A | 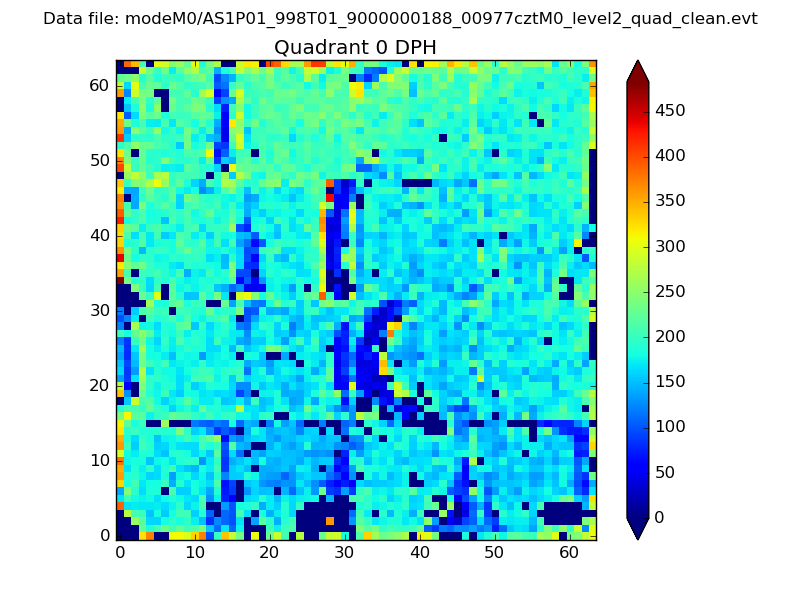 |
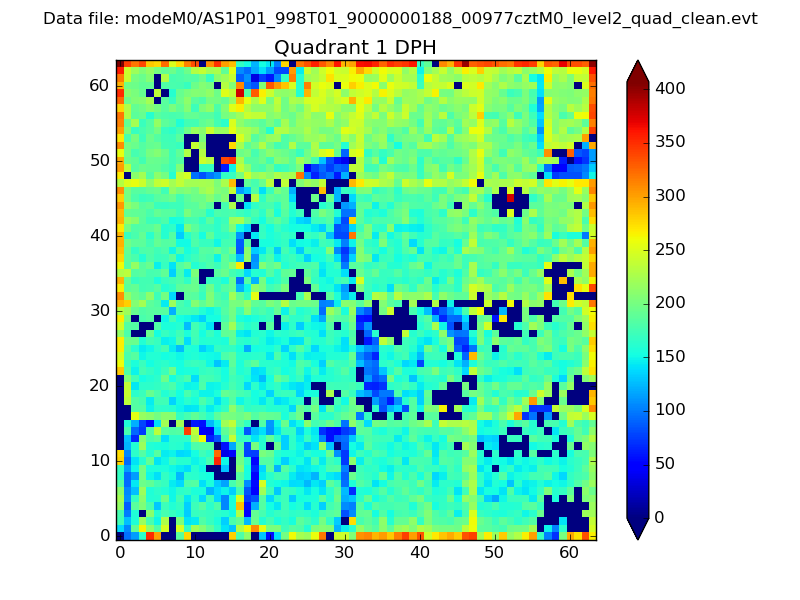 |
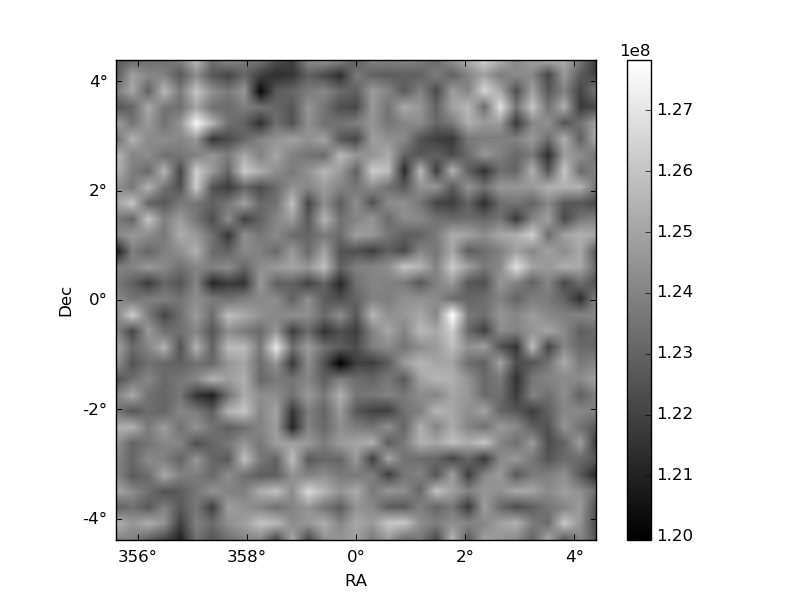
Quadrant B |
|---|---|---|---|
| Quadrant D | 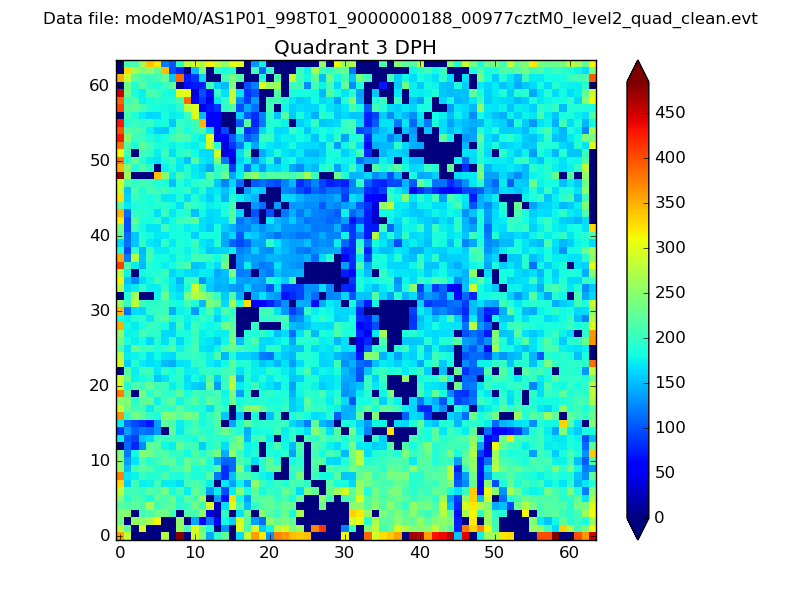 |
 |
Quadrant C |
| Plot type | Count rate plots | Images |
|---|---|---|
| Comparison with Poisson distribution Blue bars denote a histogram of data divided into 1 sec bins. Red curve is a Poisson curve with rate = median count rate of data. |
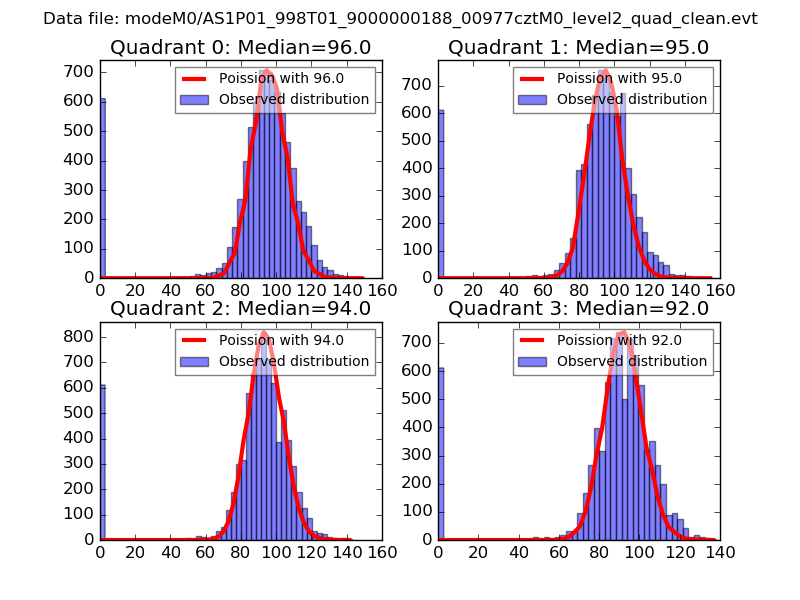 |
 |
| Quadrant-wise count rates Data is divided into 100 sec bins |
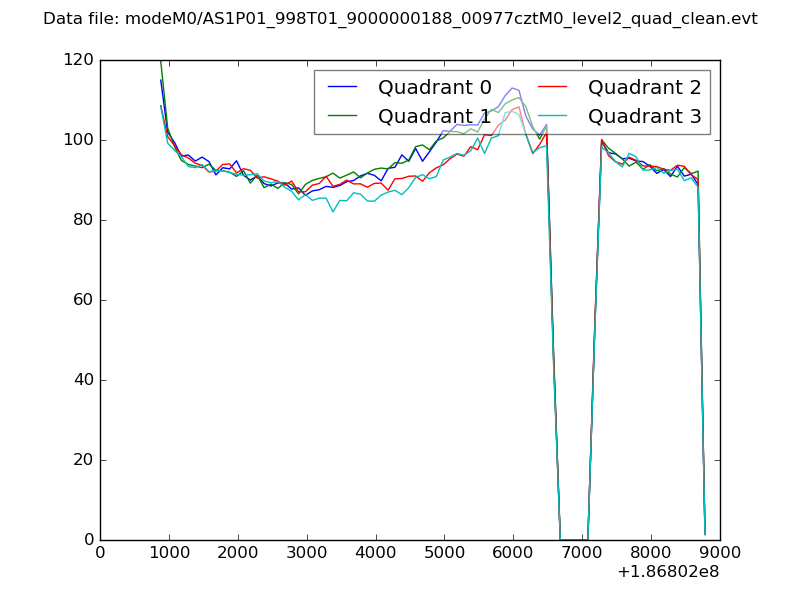 |
|
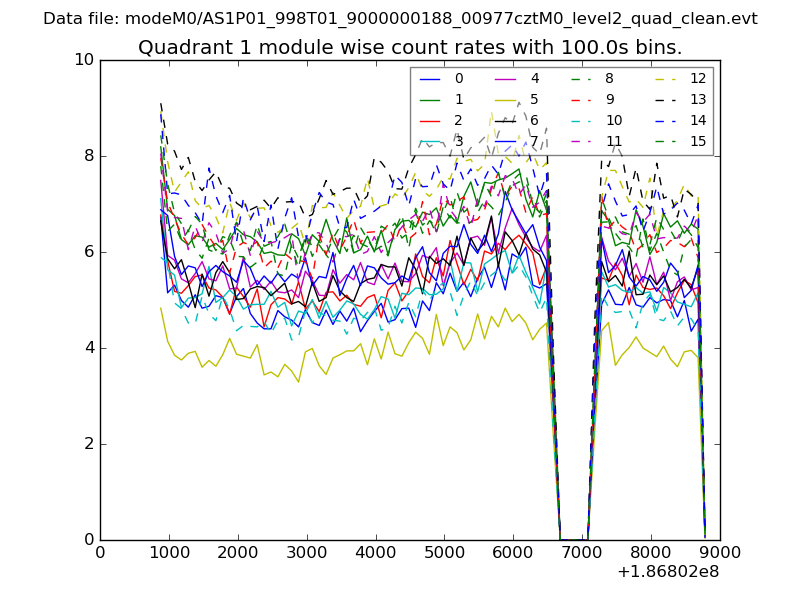
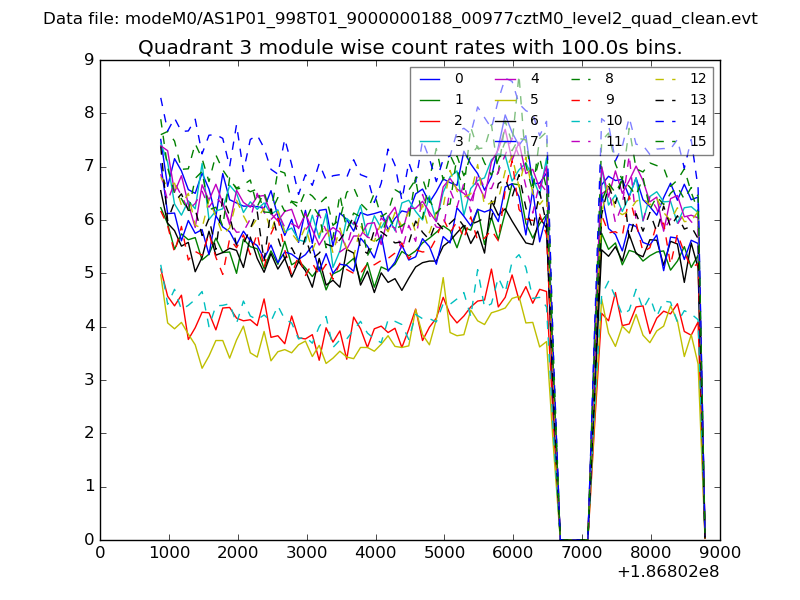
| Module-wise count rates for Quadrant A Data is divided into 100 sec bins |
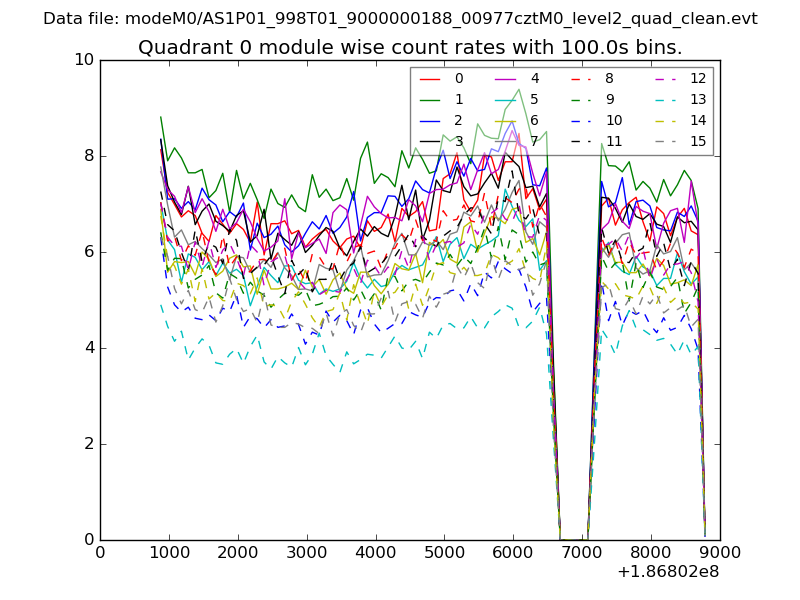 |
 |
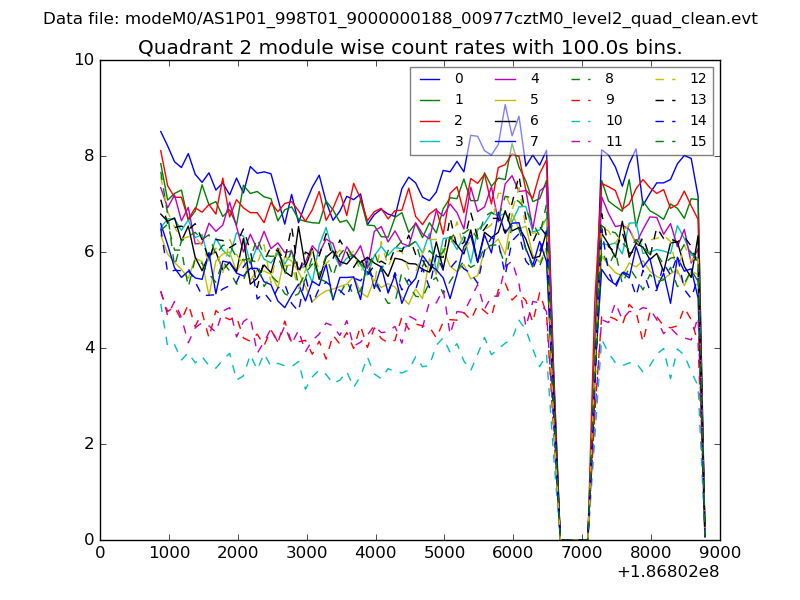
| Module-wise count rates for Quadrant B Data is divided into 100 sec bins |
 |
 |
| Module-wise count rates for Quadrant C Data is divided into 100 sec bins |
 |
 |
| Module-wise count rates for Quadrant D Data is divided into 100 sec bins |
 |
 |
| Parameter | Plot |
|---|---|
| CZT HV Monitor | 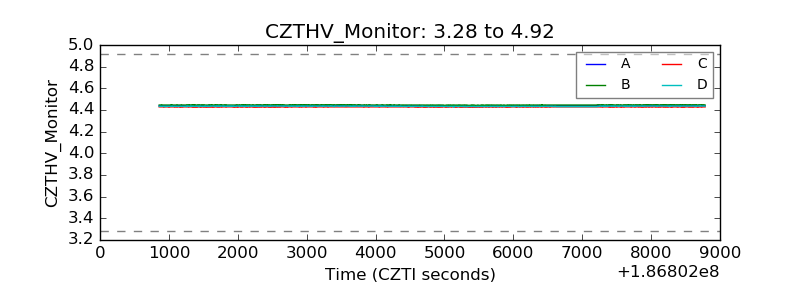 |
| D_VDD | 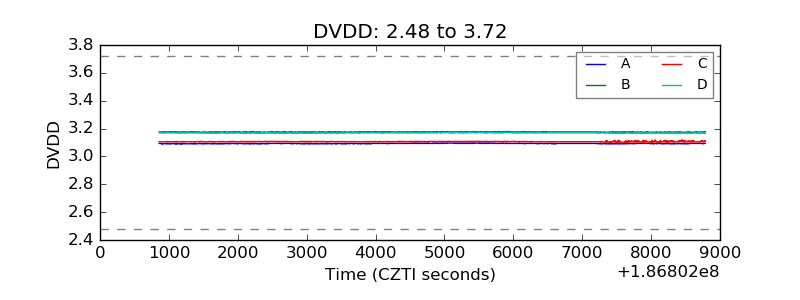 |
| Temperature 1 | 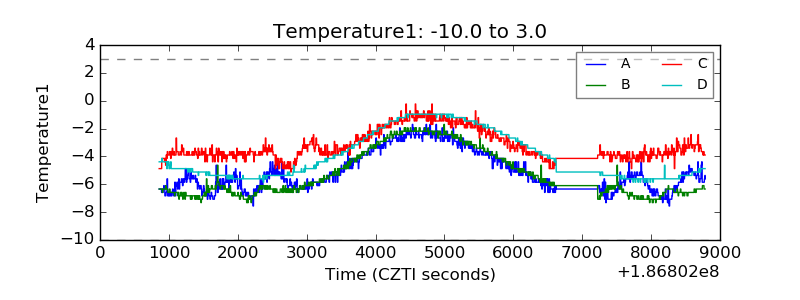 |
| Veto HV Monitor | 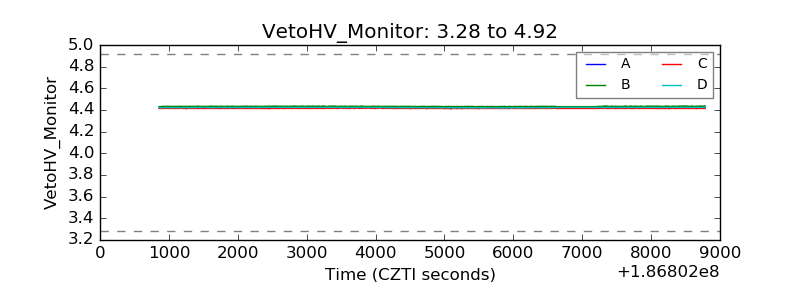 |
| Veto LLD | 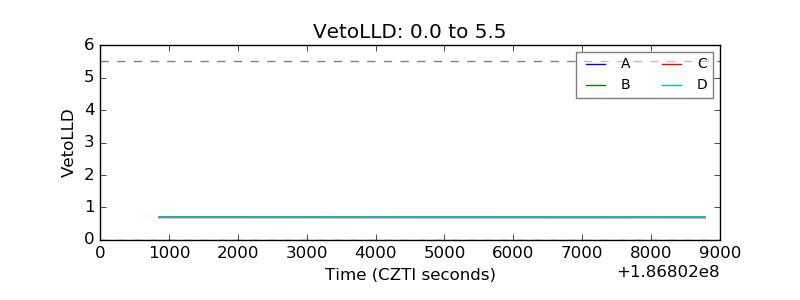 |
| Alpha Counter | 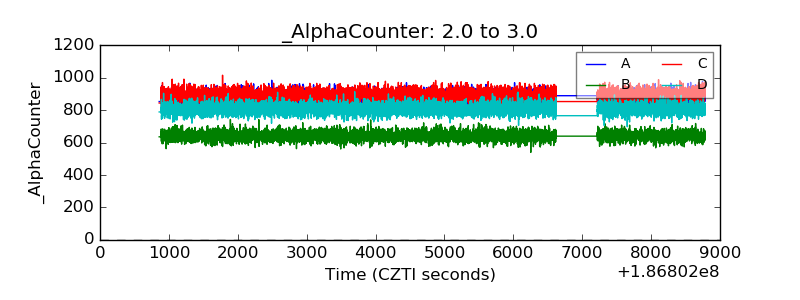 |
| _CPM_Rate | 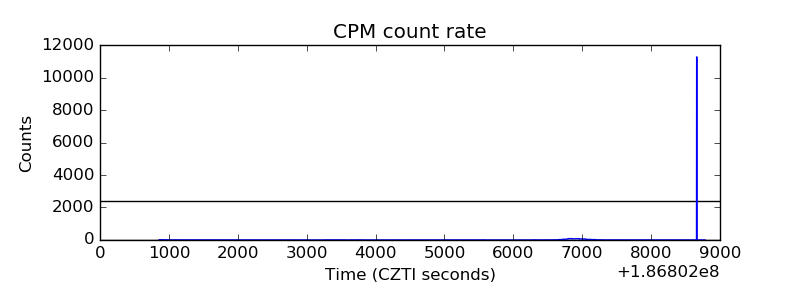 |
| CZT Counter | 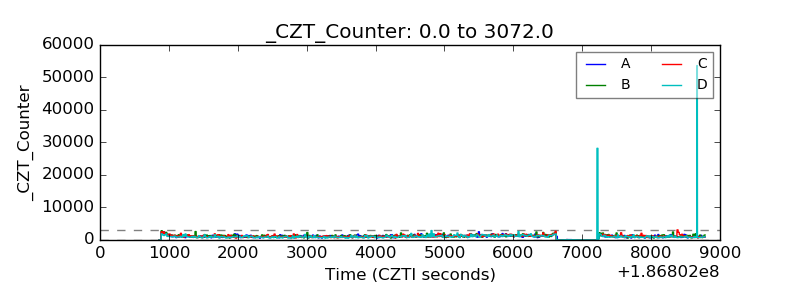 |
| +2.5 Volts monitor |  |
| +5 Volts monitor |  |
| _ROLL_ROT | 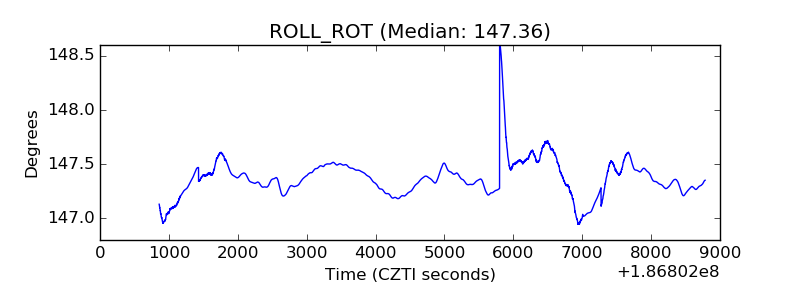 |
| _Roll_DEC | 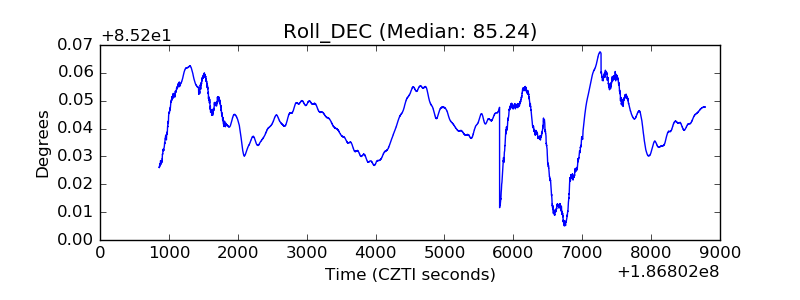 |
| _Roll_RA | 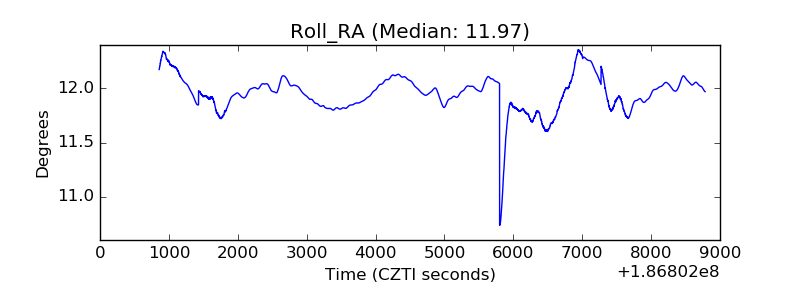 |
| Veto Counter | 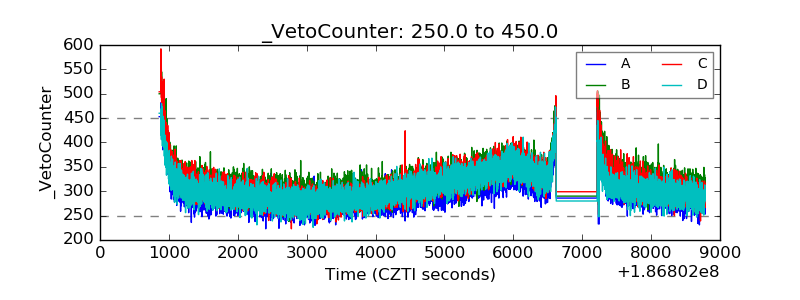 |