| Param | Original file | Final file |
|---|---|---|
| Filename | modeM0/AS1P01_998T01_9000000188_00978cztM0_level2.evt | modeM0/AS1P01_998T01_9000000188_00978cztM0_level2_quad_clean.evt |
| Size (bytes) | 984,519,360 | 91,638,720 |
| Size | 938.9 MB | 87.4 MB |
| Events in quadrant A | 7,610,824 | 589,052 |
| Events in quadrant B | 7,709,437 | 599,331 |
| Events in quadrant C | 7,371,335 | 581,937 |
| Events in quadrant D | 6,712,506 | 571,395 |
| Mode M0 | |||
|---|---|---|---|
| Quadrant | BADHDUFLAG | Total packets | Discarded packets |
| A | 0 | 27032 | 0 |
| B | 0 | 27355 | 0 |
| C | 0 | 26274 | 0 |
| D | 0 | 24382 | 0 |
| Mode M9 | |||
|---|---|---|---|
| Quadrant | BADHDUFLAG | Total packets | Discarded packets |
| A | 0 | 7 | 0 |
| B | 0 | 7 | 0 |
| C | 0 | 7 | 0 |
| D | 0 | 7 | 0 |
| Mode SS | |||
|---|---|---|---|
| Quadrant | BADHDUFLAG | Total packets | Discarded packets |
| A | 0 | 128 | 0 |
| B | 0 | 128 | 0 |
| C | 0 | 128 | 0 |
| D | 0 | 128 | 0 |
| Quadrant | Total seconds | Saturated seconds | Saturation percentage |
|---|---|---|---|
| A | 6201 | 92 | 1.483632% |
| B | 6201 | 17 | 0.274149% |
| C | 6201 | 15 | 0.241896% |
| D | 6201 | 14 | 0.225770% |
Noise dominated data is calculated using 1-second bins in cleaned event files. If a bin has >2000 counts, and if more than 50% of those come from <1% of pixels, then it is considered to be noise-dominated and hence unusable.
| Quadrant | # 1 sec bins | Bins with >0 counts | Bins with >2000 counts | High rate bins dominated by noise | Noise dominated (total time) | Noise dominated (detector-on time) | Marked lightcurve |
|---|---|---|---|---|---|---|---|
| A | 6961 | 6202 | 255 | 255 | 3.66% | 4.11% | 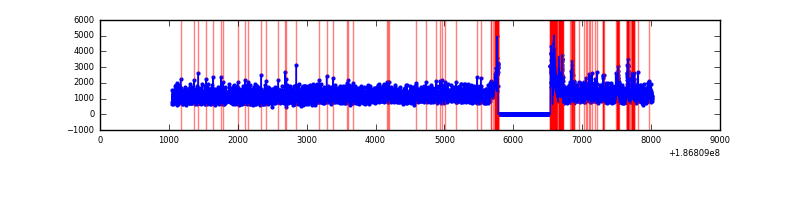 |
| B | 6961 | 6202 | 193 | 193 | 2.77% | 3.11% | 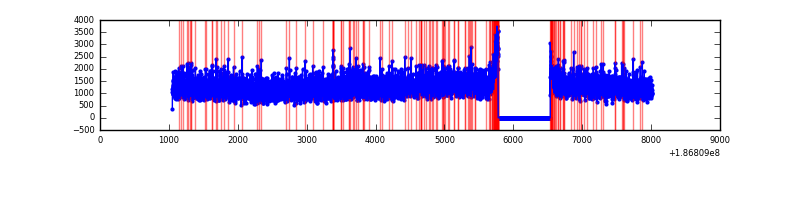 |
| C | 6961 | 6202 | 163 | 163 | 2.34% | 2.63% | 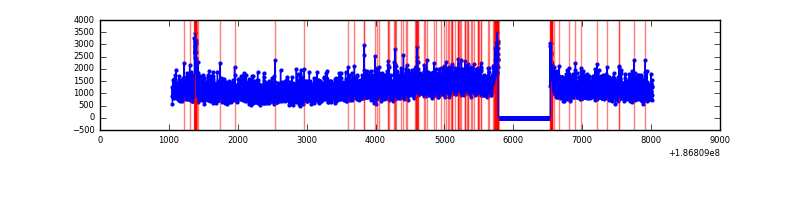 |
| D | 6961 | 6202 | 74 | 74 | 1.06% | 1.19% | 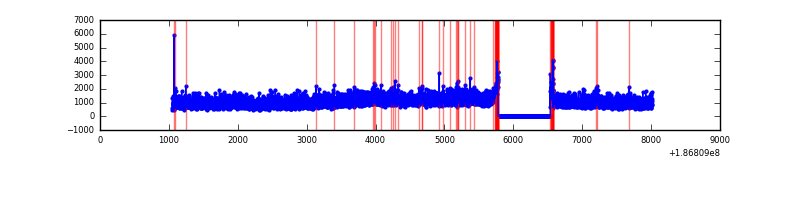 |
Top three noisy pixels from each quadrant. If the there are fewer than three noisy pixels in the level2.evt file, extra rows are filled as -1
| Pixel properties | Quadrant properties | ||||||
|---|---|---|---|---|---|---|---|
| Quadrant | DetID | PixID | Counts | Sigma | Mean | Median | Sigma |
| A | 14 | 170 | 396561 | 871.84 | 1877 | 1889 | 452.7 |
| A | 12 | 189 | 9172 | 16.09 | 1877 | 1889 | 452.7 |
| A | 11 | 242 | 6988 | 11.26 | 1877 | 1889 | 452.7 |
| B | 0 | 220 | 57193 | 119.27 | 1970 | 1981 | 462.9 |
| B | 12 | 52 | 49074 | 101.73 | 1970 | 1981 | 462.9 |
| B | 15 | 22 | 47975 | 99.36 | 1970 | 1981 | 462.9 |
| C | 15 | 241 | 317577 | 646.06 | 1755 | 1813 | 488.8 |
| C | 9 | 52 | 122252 | 246.42 | 1755 | 1813 | 488.8 |
| C | 3 | 111 | 28167 | 53.92 | 1755 | 1813 | 488.8 |
| D | 1 | 4 | 155566 | 290.92 | 1708 | 1767 | 528.7 |
| D | 0 | 244 | 69020 | 127.21 | 1708 | 1767 | 528.7 |
| D | 12 | 217 | 21460 | 37.25 | 1708 | 1767 | 528.7 |
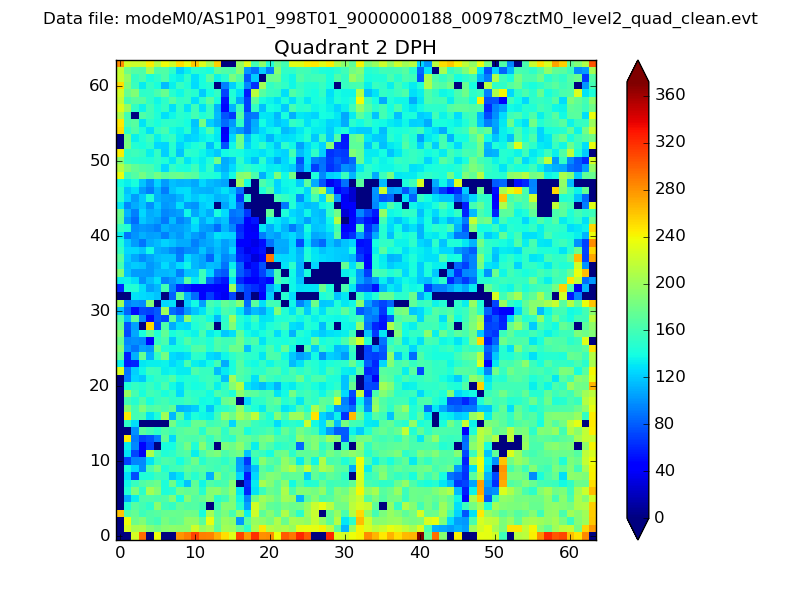
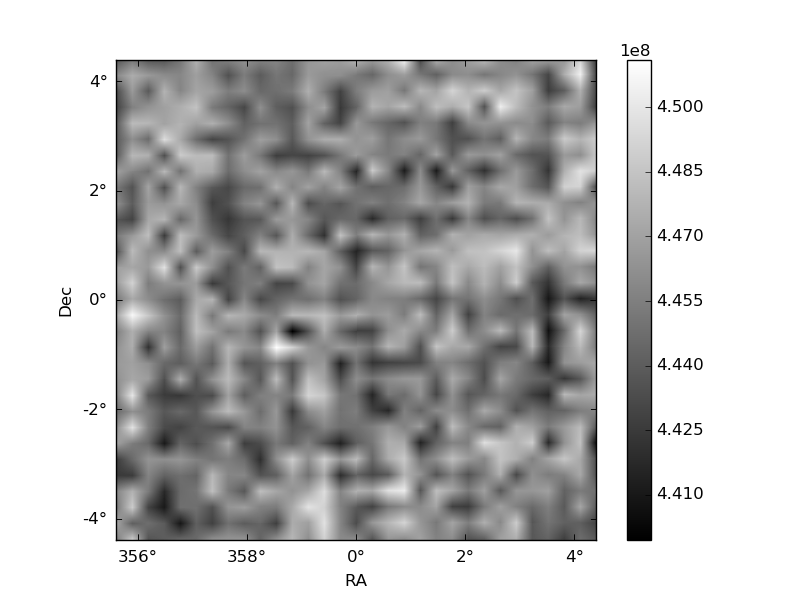
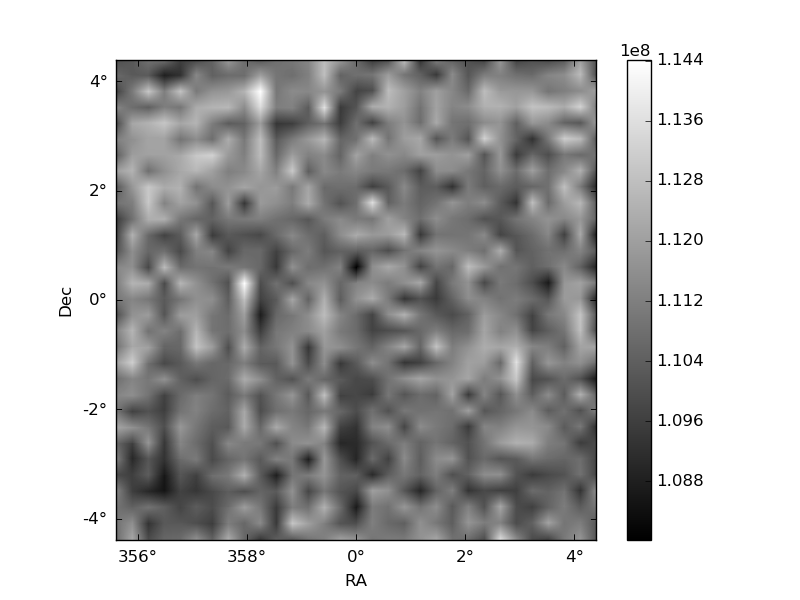
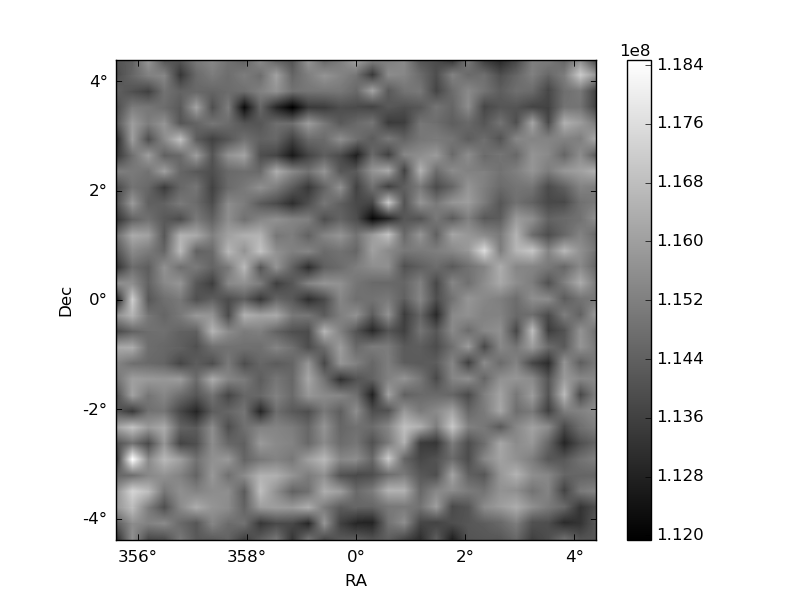
Histogram calculated using DETX and DETY for each event in the final _common_clean file
| Quadrant A | 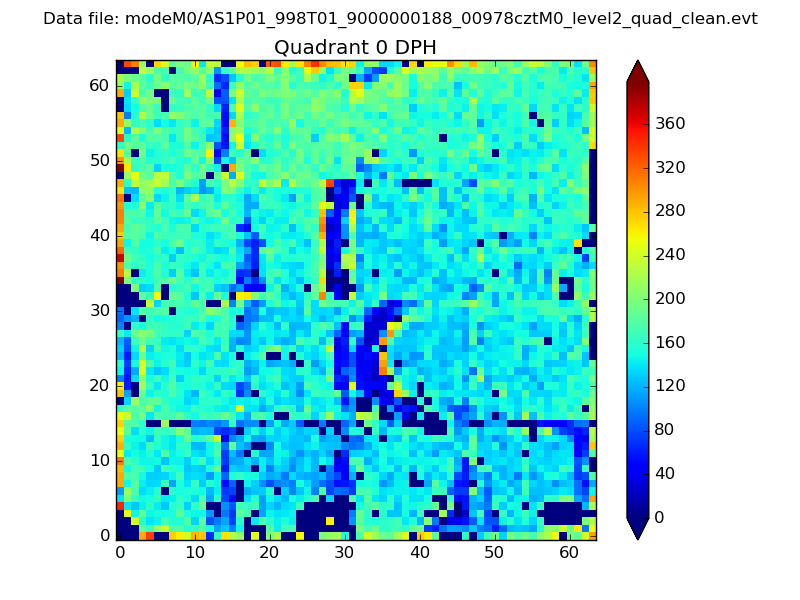 |
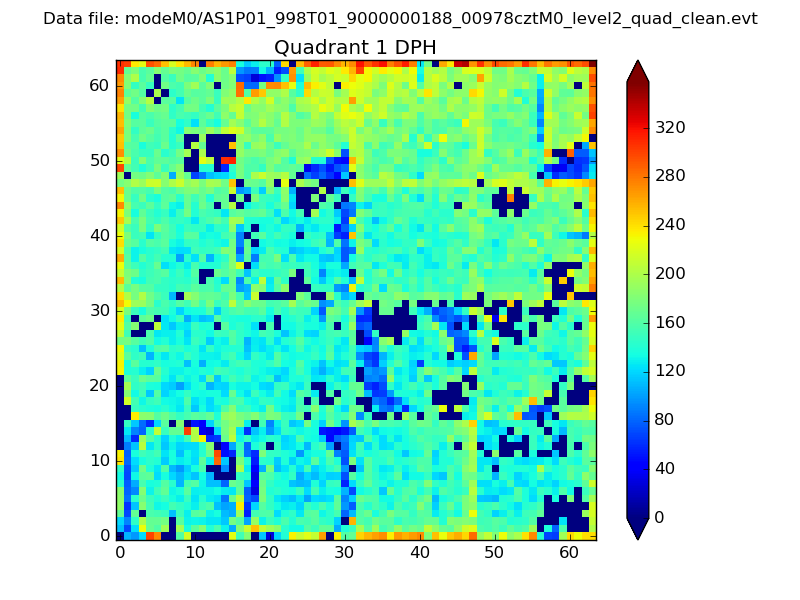 |
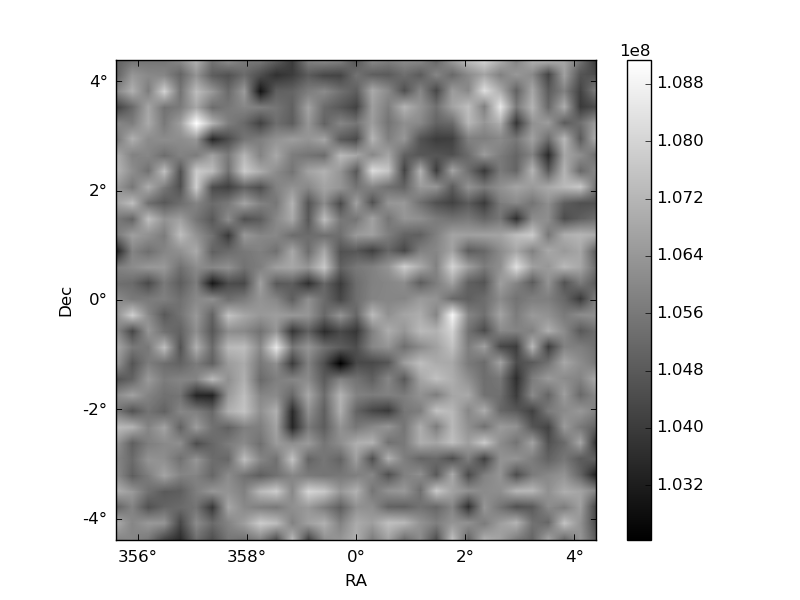
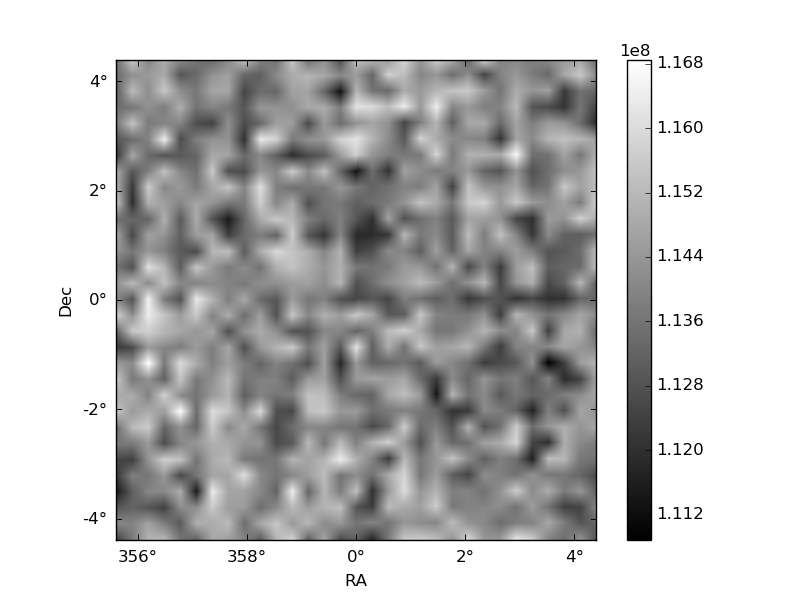
Quadrant B |
|---|---|---|---|
| Quadrant D | 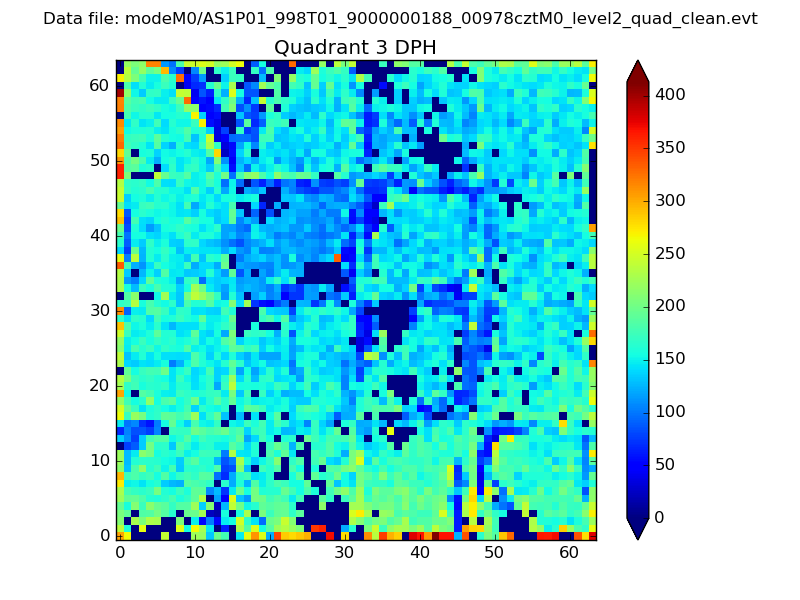 |
 |
Quadrant C |
| Plot type | Count rate plots | Images |
|---|---|---|
| Comparison with Poisson distribution Blue bars denote a histogram of data divided into 1 sec bins. Red curve is a Poisson curve with rate = median count rate of data. |
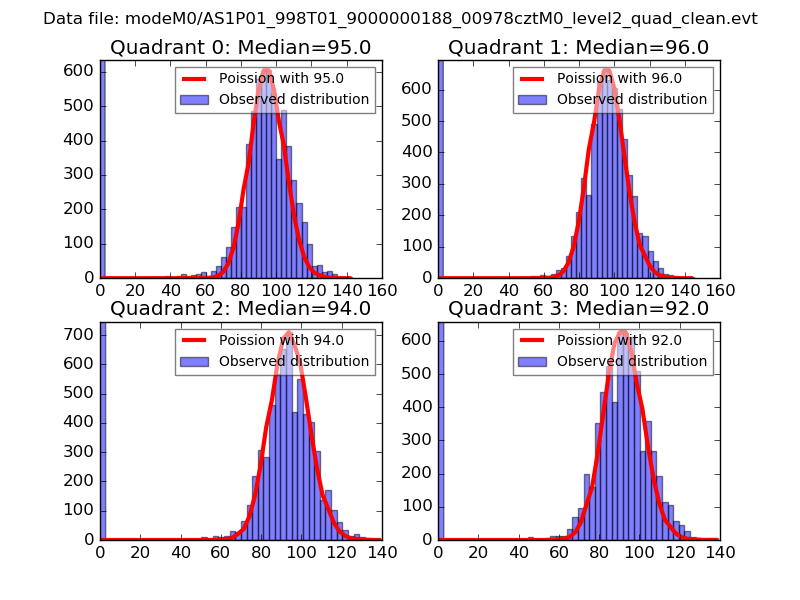 |
 |
| Quadrant-wise count rates Data is divided into 100 sec bins |
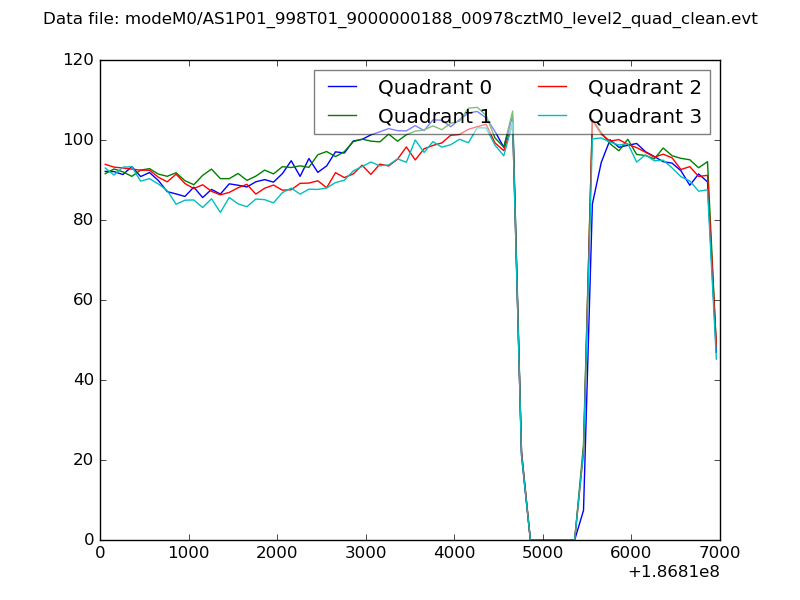 |
|
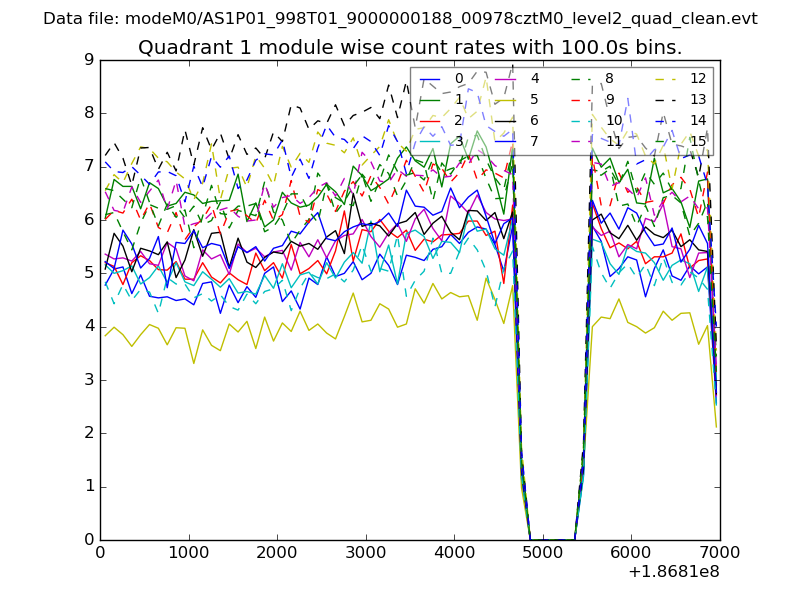
| Module-wise count rates for Quadrant A Data is divided into 100 sec bins |
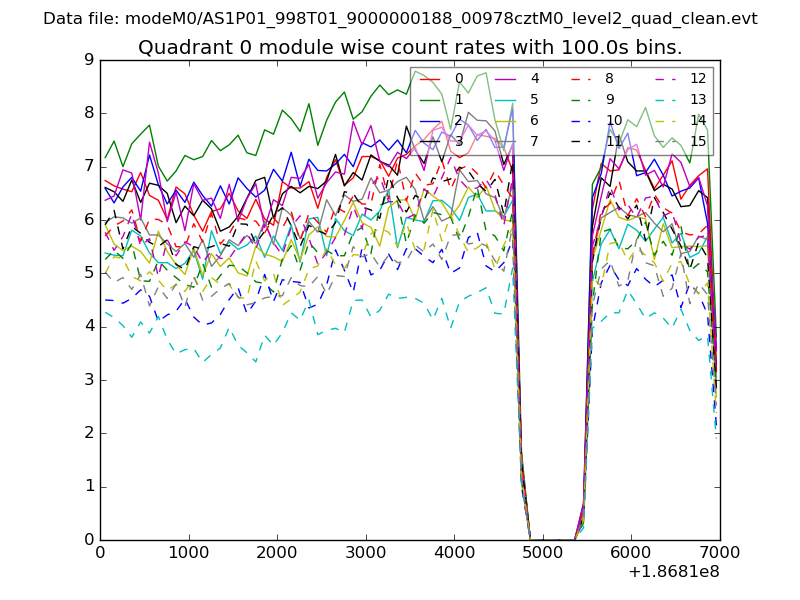 |
 |
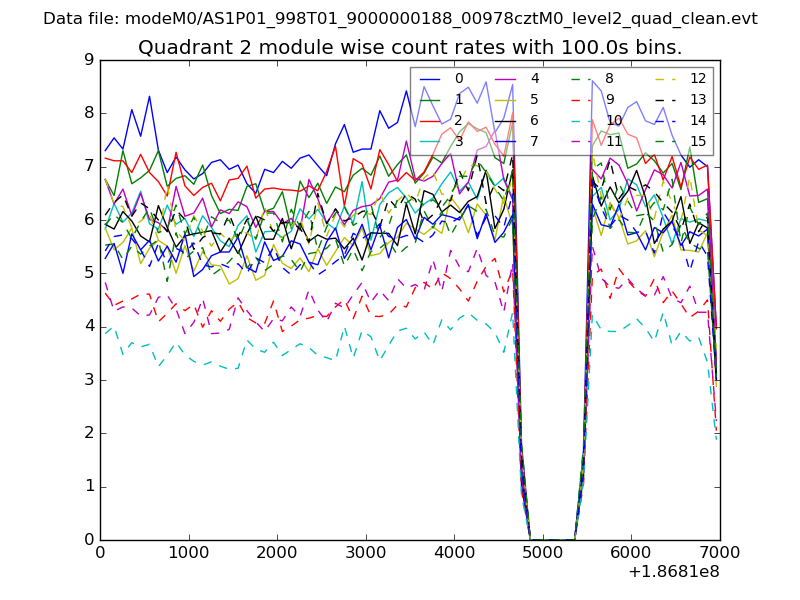
| Module-wise count rates for Quadrant B Data is divided into 100 sec bins |
 |
 |
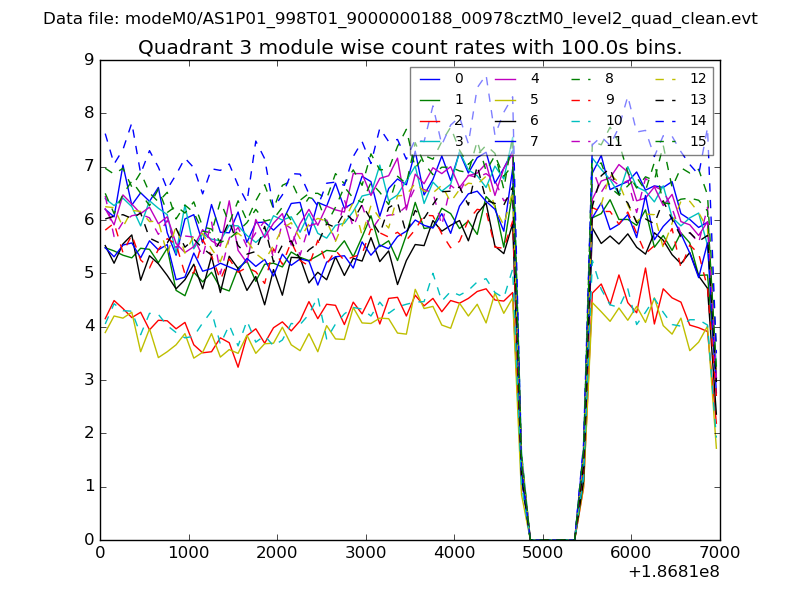
| Module-wise count rates for Quadrant C Data is divided into 100 sec bins |
 |
 |
| Module-wise count rates for Quadrant D Data is divided into 100 sec bins |
 |
 |
| Parameter | Plot |
|---|---|
| CZT HV Monitor | 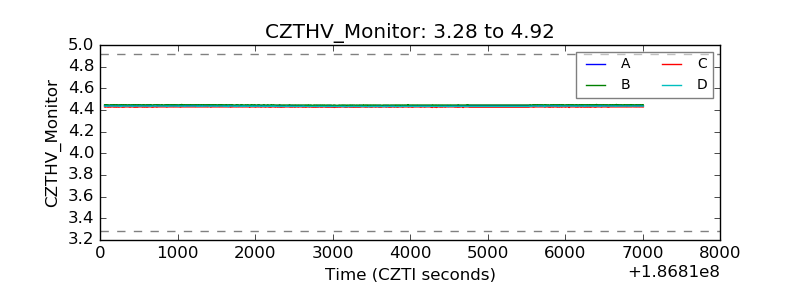 |
| D_VDD | 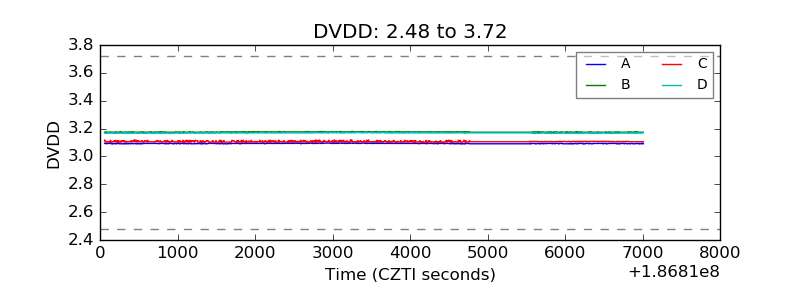 |
| Temperature 1 | 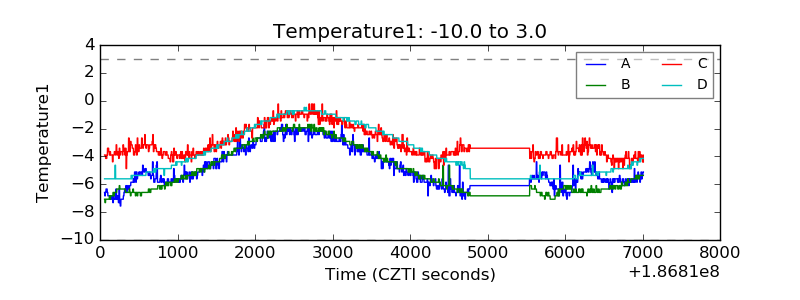 |
| Veto HV Monitor | 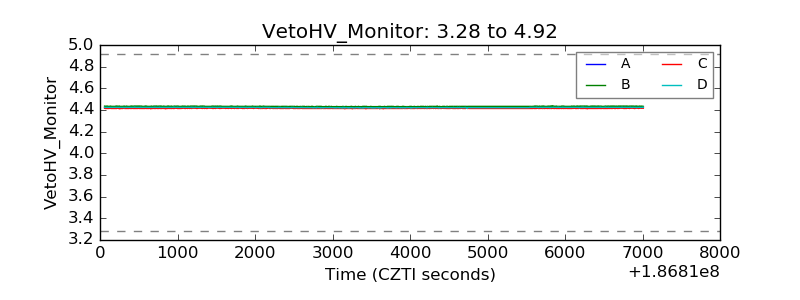 |
| Veto LLD | 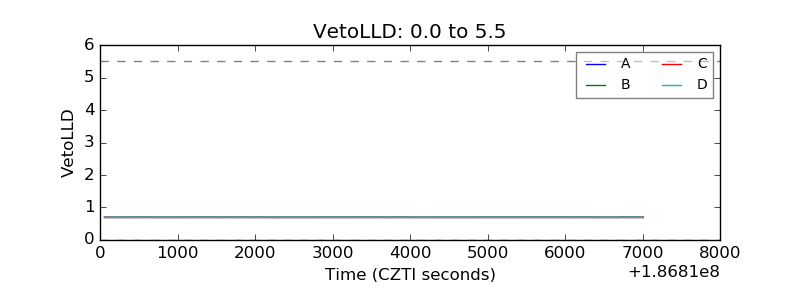 |
| Alpha Counter | 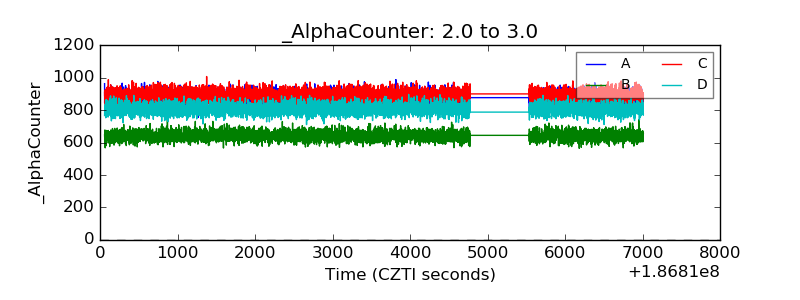 |
| _CPM_Rate | 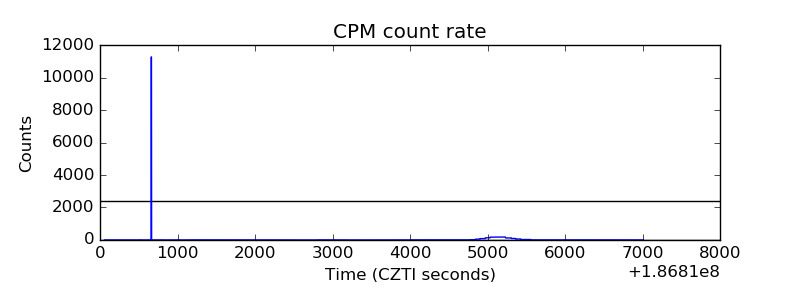 |
| CZT Counter | 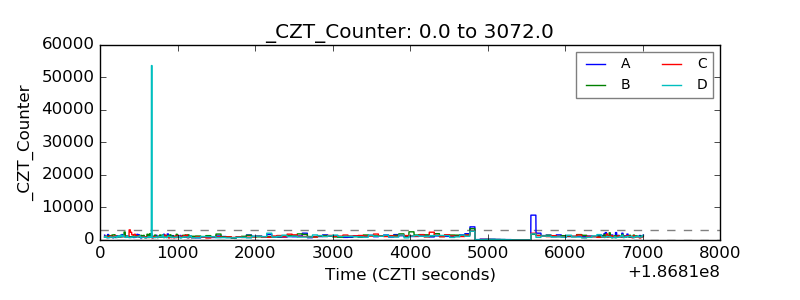 |
| +2.5 Volts monitor | 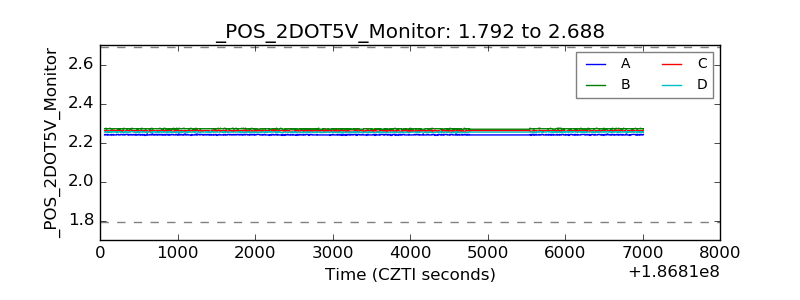 |
| +5 Volts monitor | 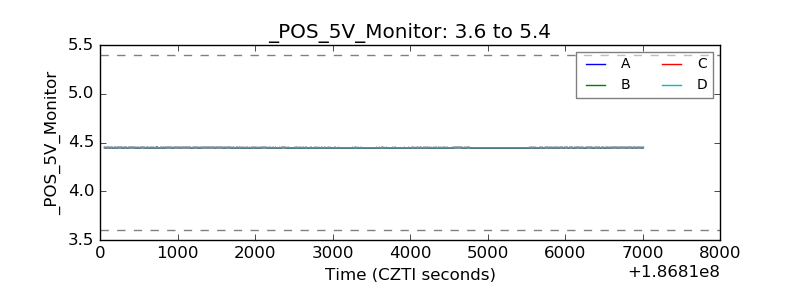 |
| _ROLL_ROT | 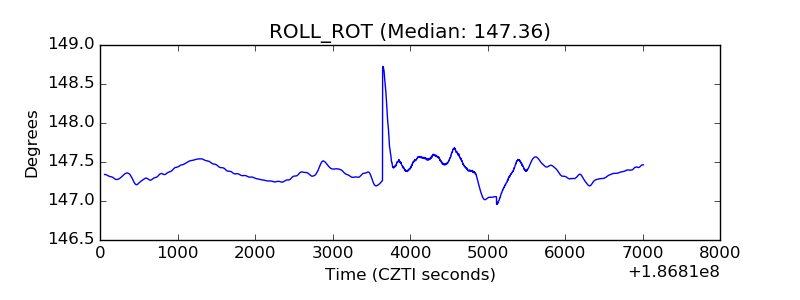 |
| _Roll_DEC | 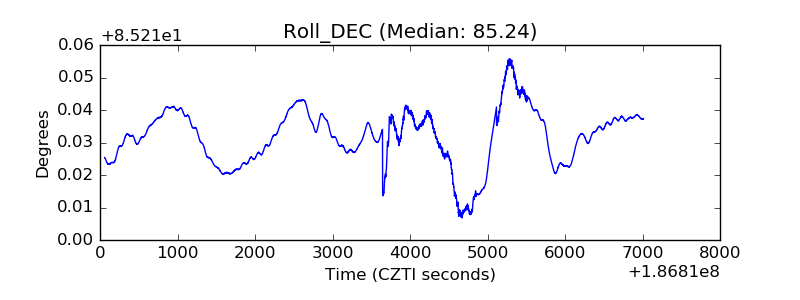 |
| _Roll_RA | 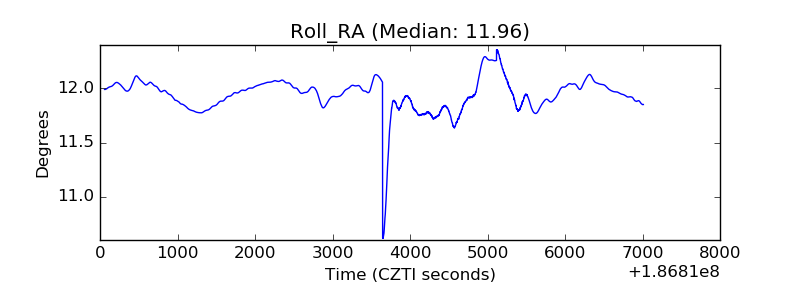 |
| Veto Counter | 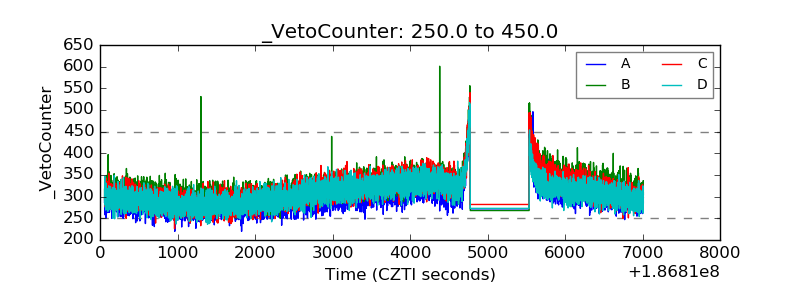 |