| Param | Original file | Final file |
|---|---|---|
| Filename | modeM0/AS1P01_998T01_9000000188_00979cztM0_level2.evt | modeM0/AS1P01_998T01_9000000188_00979cztM0_level2_quad_clean.evt |
| Size (bytes) | 1,020,110,400 | 93,571,200 |
| Size | 972.9 MB | 89.2 MB |
| Events in quadrant A | 7,918,767 | 608,762 |
| Events in quadrant B | 7,851,795 | 613,438 |
| Events in quadrant C | 7,382,634 | 593,872 |
| Events in quadrant D | 7,326,701 | 581,485 |
| Mode M0 | |||
|---|---|---|---|
| Quadrant | BADHDUFLAG | Total packets | Discarded packets |
| A | 0 | 27966 | 0 |
| B | 0 | 27752 | 0 |
| C | 0 | 26313 | 0 |
| D | 0 | 26214 | 0 |
| Mode M9 | |||
|---|---|---|---|
| Quadrant | BADHDUFLAG | Total packets | Discarded packets |
| A | 0 | 9 | 0 |
| B | 0 | 9 | 0 |
| C | 0 | 9 | 0 |
| D | 0 | 9 | 0 |
| Mode SS | |||
|---|---|---|---|
| Quadrant | BADHDUFLAG | Total packets | Discarded packets |
| A | 0 | 128 | 0 |
| B | 0 | 128 | 0 |
| C | 0 | 128 | 0 |
| D | 0 | 128 | 0 |
| Quadrant | Total seconds | Saturated seconds | Saturation percentage |
|---|---|---|---|
| A | 6246 | 34 | 0.544348% |
| B | 6246 | 36 | 0.576369% |
| C | 6246 | 18 | 0.288184% |
| D | 6246 | 40 | 0.640410% |
Noise dominated data is calculated using 1-second bins in cleaned event files. If a bin has >2000 counts, and if more than 50% of those come from <1% of pixels, then it is considered to be noise-dominated and hence unusable.
| Quadrant | # 1 sec bins | Bins with >0 counts | Bins with >2000 counts | High rate bins dominated by noise | Noise dominated (total time) | Noise dominated (detector-on time) | Marked lightcurve |
|---|---|---|---|---|---|---|---|
| A | 7151 | 6247 | 332 | 332 | 4.64% | 5.31% | 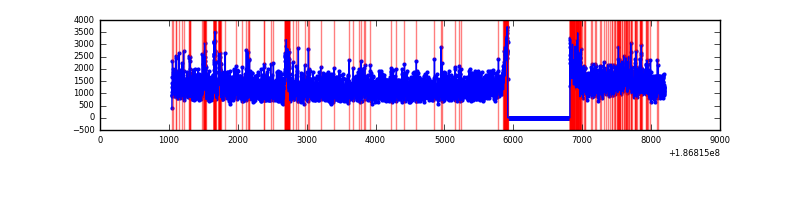 |
| B | 7151 | 6247 | 230 | 230 | 3.22% | 3.68% | 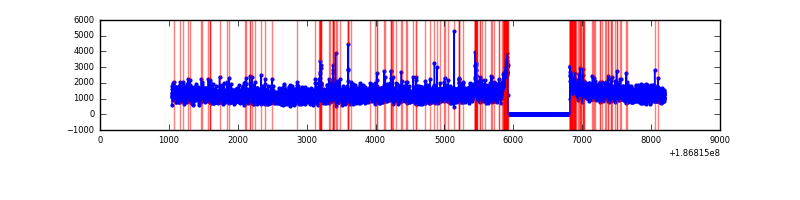 |
| C | 7151 | 6247 | 125 | 125 | 1.75% | 2.00% | 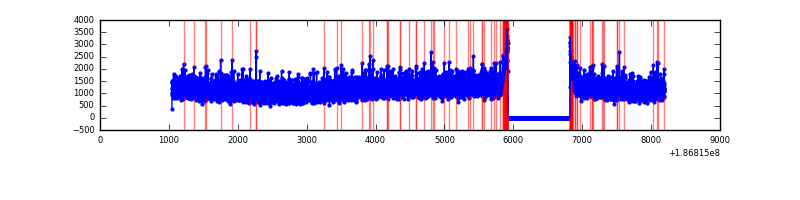 |
| D | 7151 | 6247 | 259 | 259 | 3.62% | 4.15% | 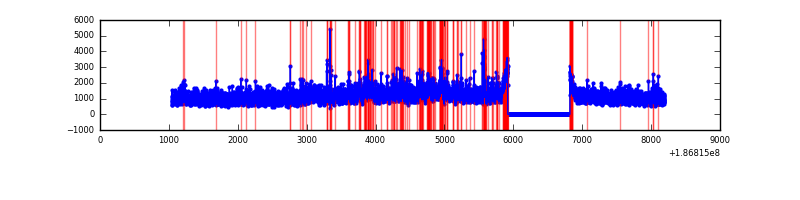 |
Top three noisy pixels from each quadrant. If the there are fewer than three noisy pixels in the level2.evt file, extra rows are filled as -1
| Pixel properties | Quadrant properties | ||||||
|---|---|---|---|---|---|---|---|
| Quadrant | DetID | PixID | Counts | Sigma | Mean | Median | Sigma |
| A | 14 | 170 | 552157 | 1196.15 | 1916 | 1932 | 460.0 |
| A | 12 | 189 | 7971 | 13.13 | 1916 | 1932 | 460.0 |
| A | 11 | 79 | 6798 | 10.58 | 1916 | 1932 | 460.0 |
| B | 5 | 249 | 58218 | 120.16 | 1992 | 2000 | 467.8 |
| B | 15 | 22 | 43594 | 88.91 | 1992 | 2000 | 467.8 |
| B | 4 | 200 | 31610 | 63.29 | 1992 | 2000 | 467.8 |
| C | 15 | 241 | 317050 | 634.77 | 1779 | 1834 | 496.6 |
| C | 9 | 52 | 33875 | 64.52 | 1779 | 1834 | 496.6 |
| C | 8 | 208 | 24475 | 45.59 | 1779 | 1834 | 496.6 |
| D | 1 | 4 | 620470 | 1171.55 | 1746 | 1803 | 528.1 |
| D | 0 | 244 | 65536 | 120.69 | 1746 | 1803 | 528.1 |
| D | 12 | 22 | 48578 | 88.58 | 1746 | 1803 | 528.1 |
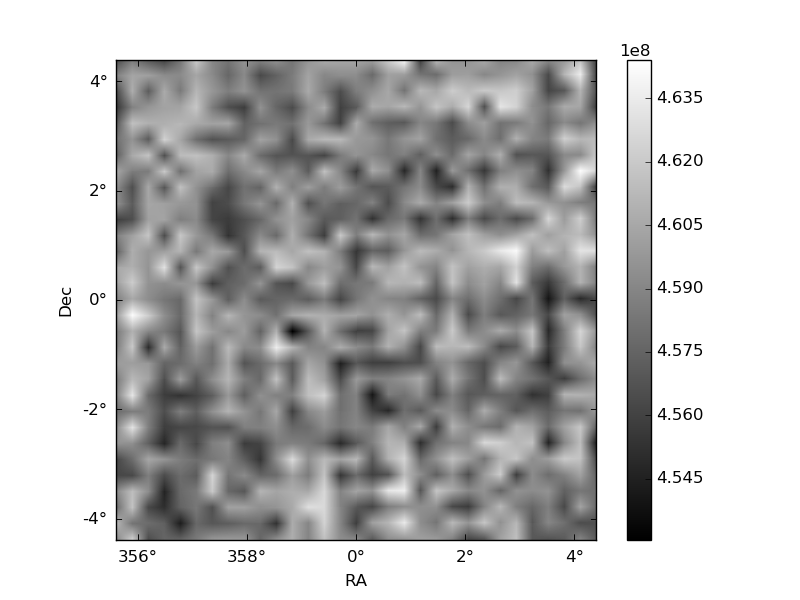
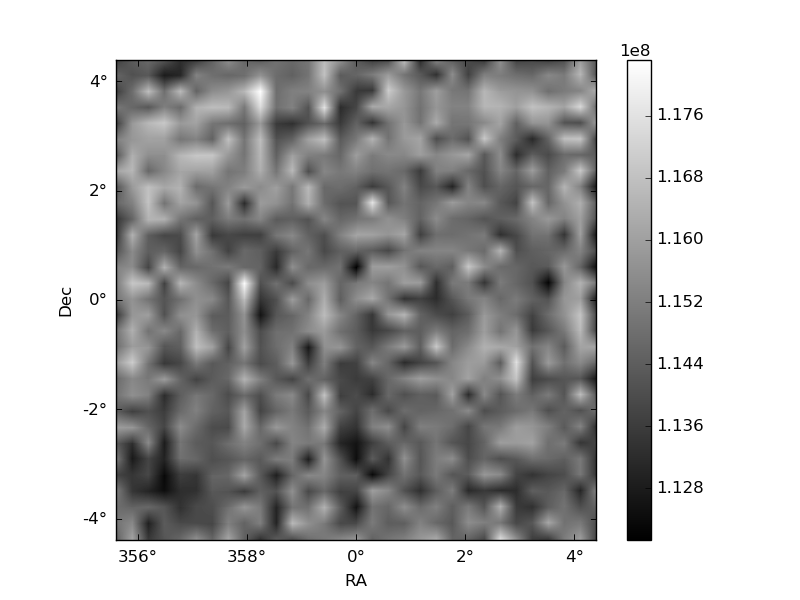
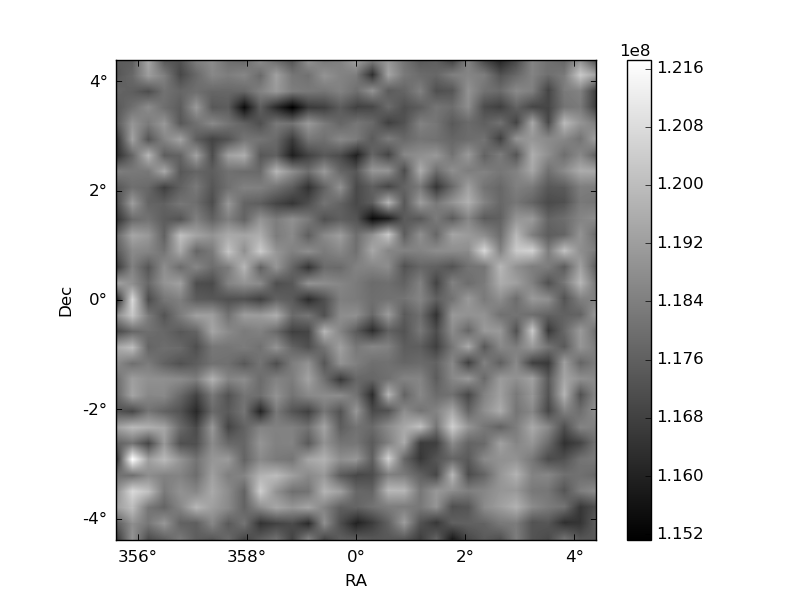
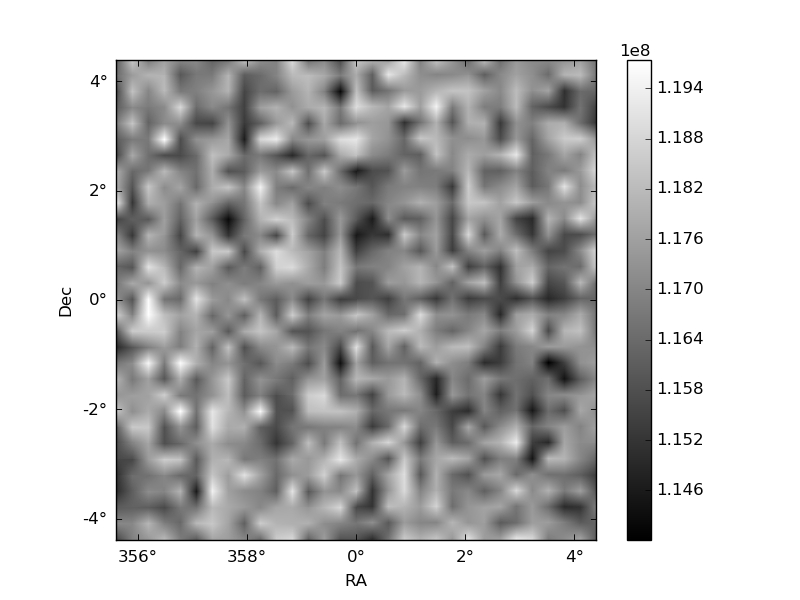
Histogram calculated using DETX and DETY for each event in the final _common_clean file
| Quadrant A | 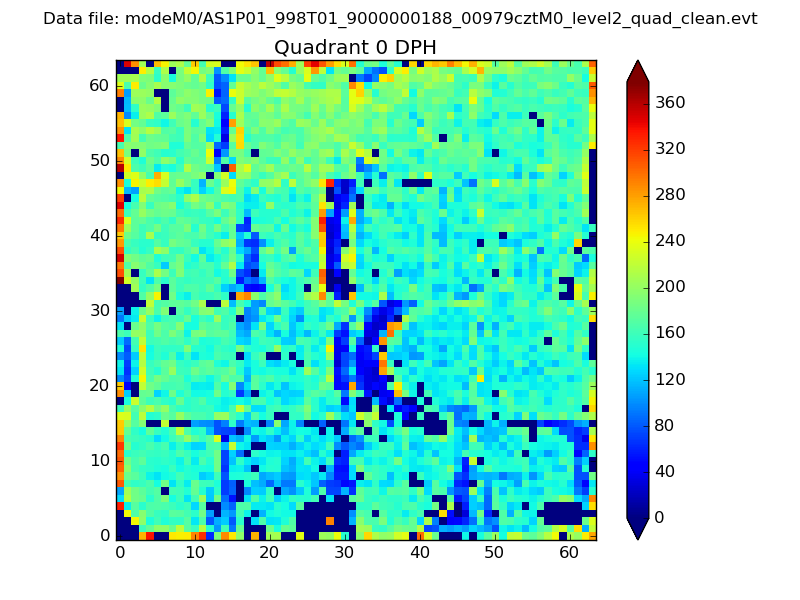 |
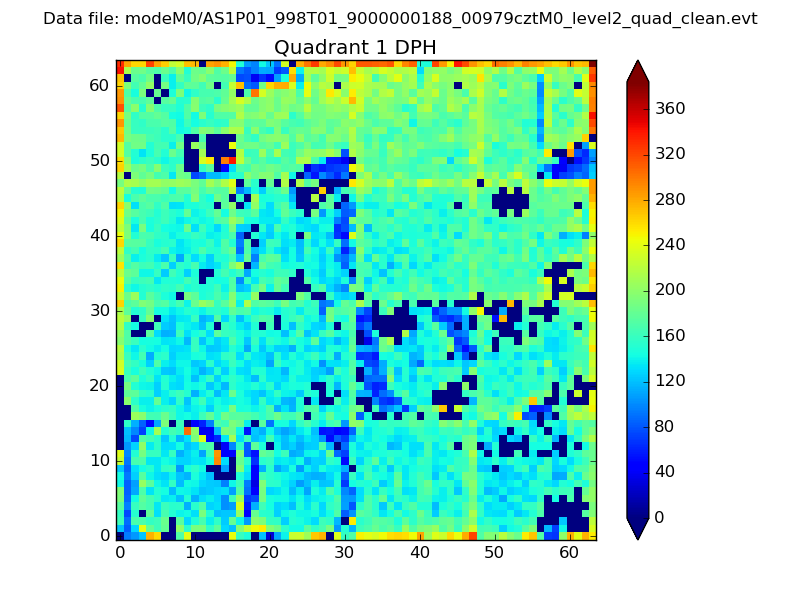 |
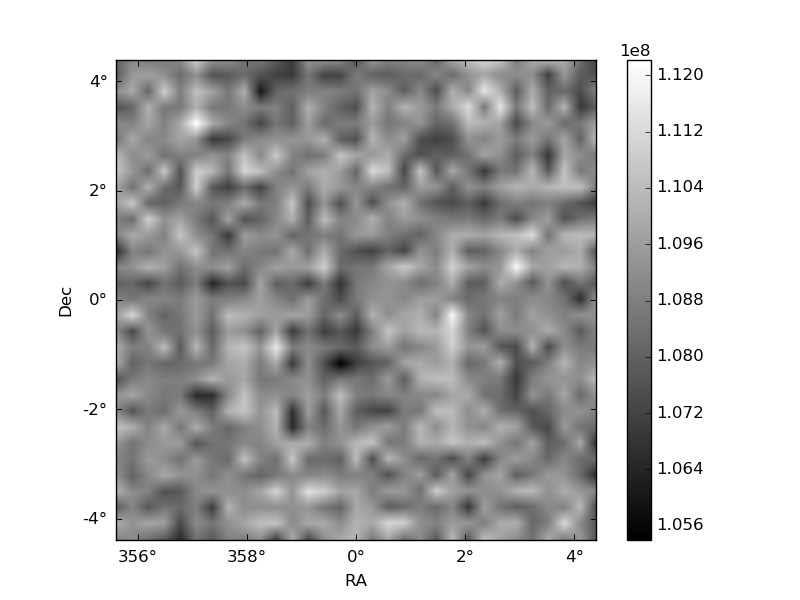
Quadrant B |
|---|---|---|---|
| Quadrant D | 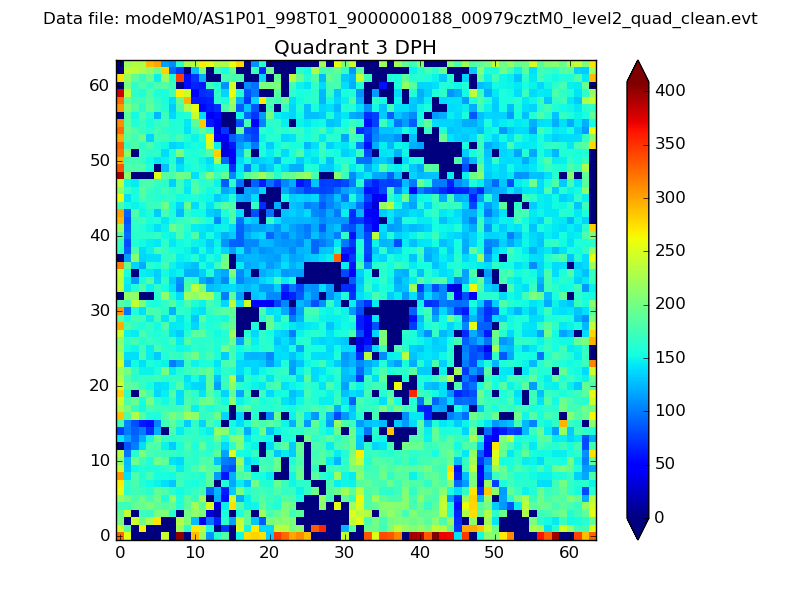 |
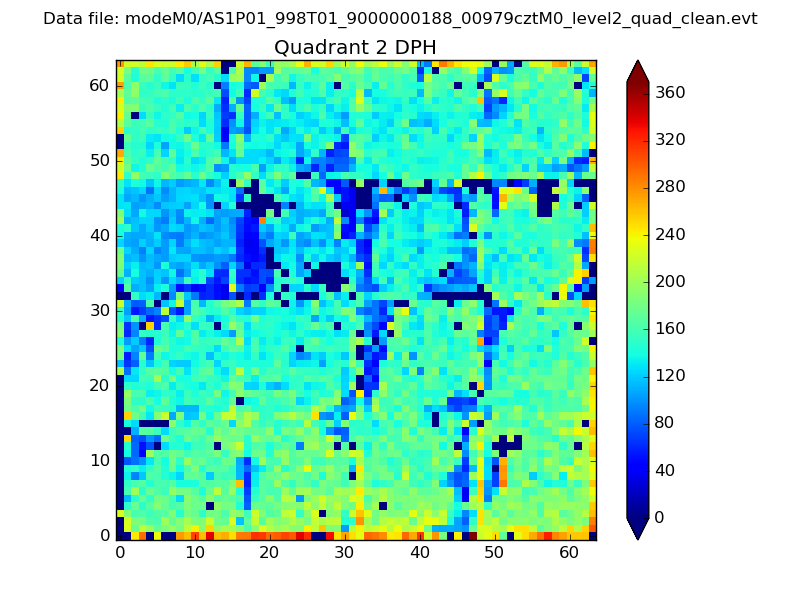 |
Quadrant C |
| Plot type | Count rate plots | Images |
|---|---|---|
| Comparison with Poisson distribution Blue bars denote a histogram of data divided into 1 sec bins. Red curve is a Poisson curve with rate = median count rate of data. |
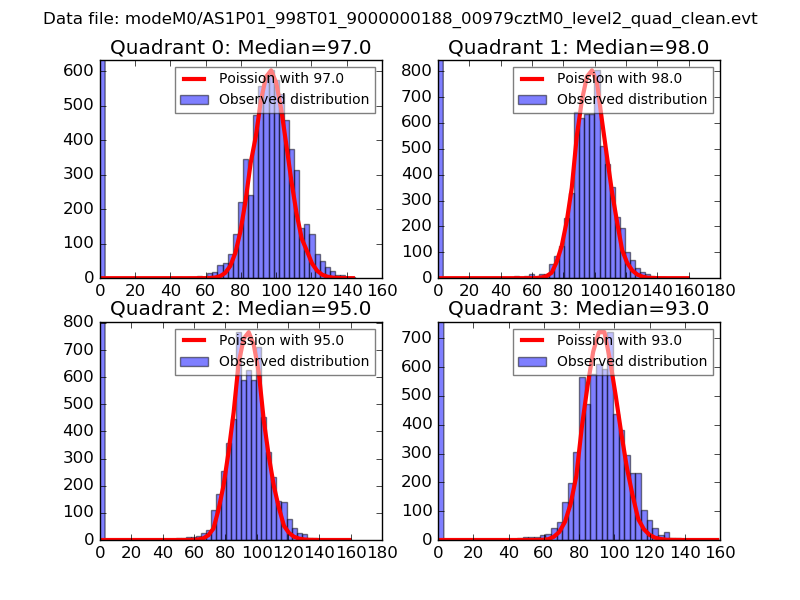 |
 |
| Quadrant-wise count rates Data is divided into 100 sec bins |
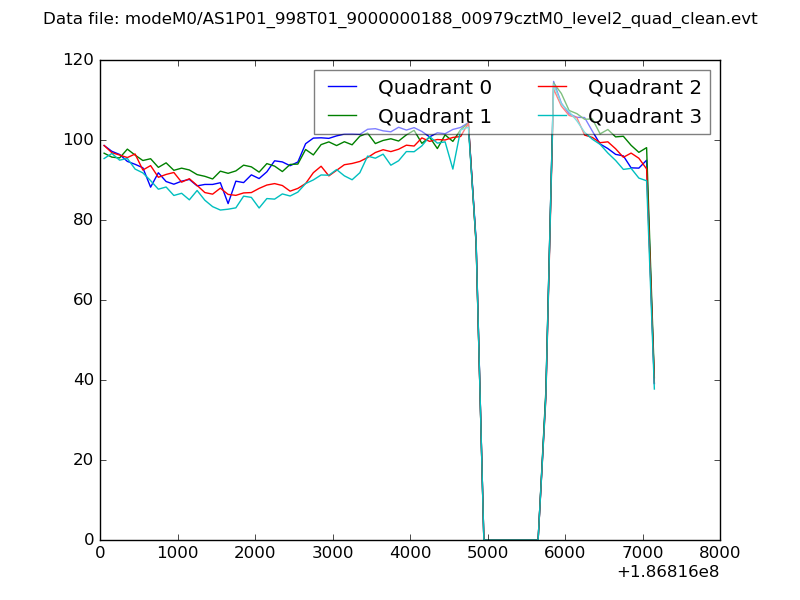 |
|
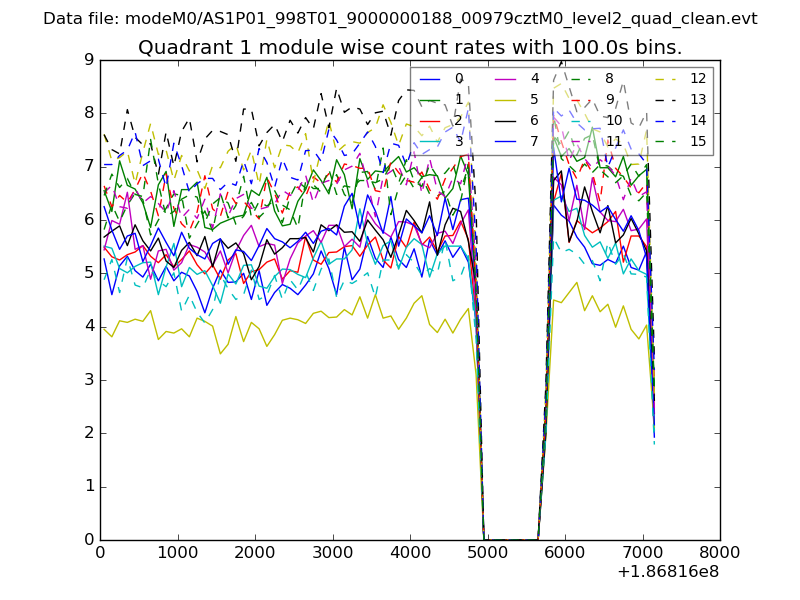
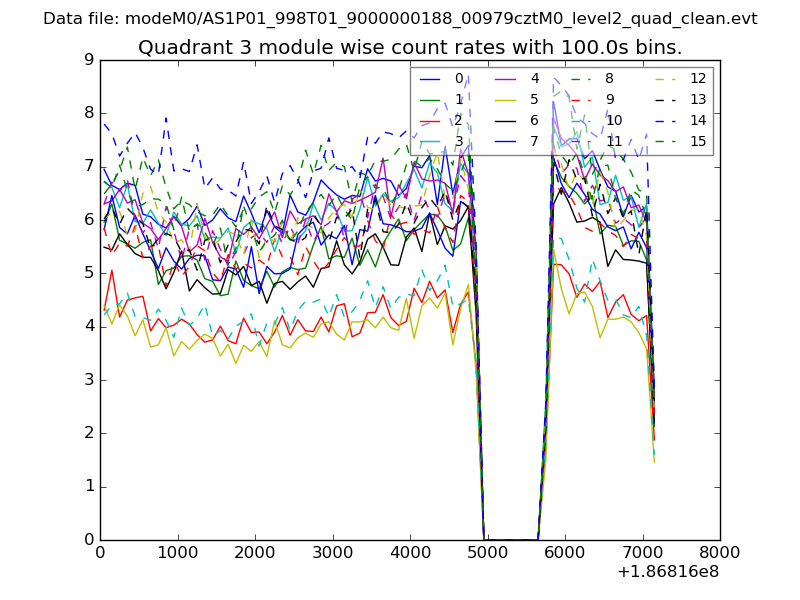
| Module-wise count rates for Quadrant A Data is divided into 100 sec bins |
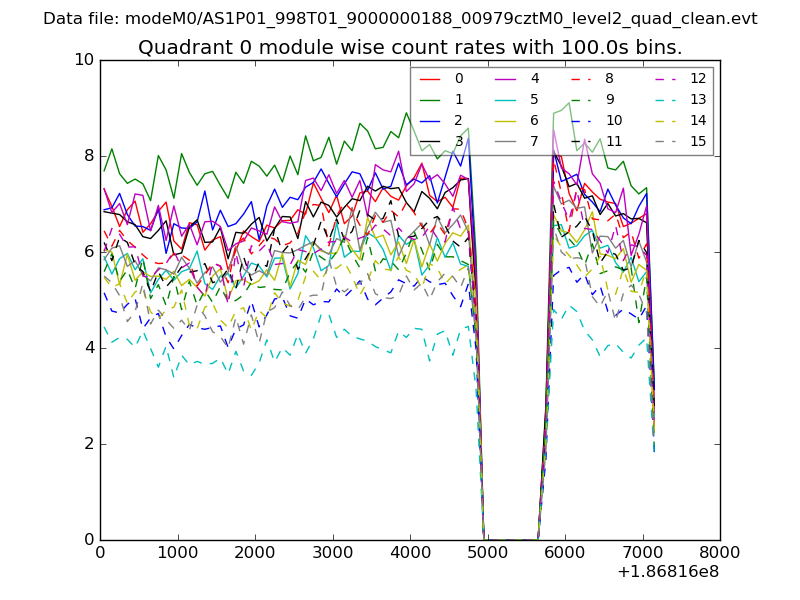 |
 |
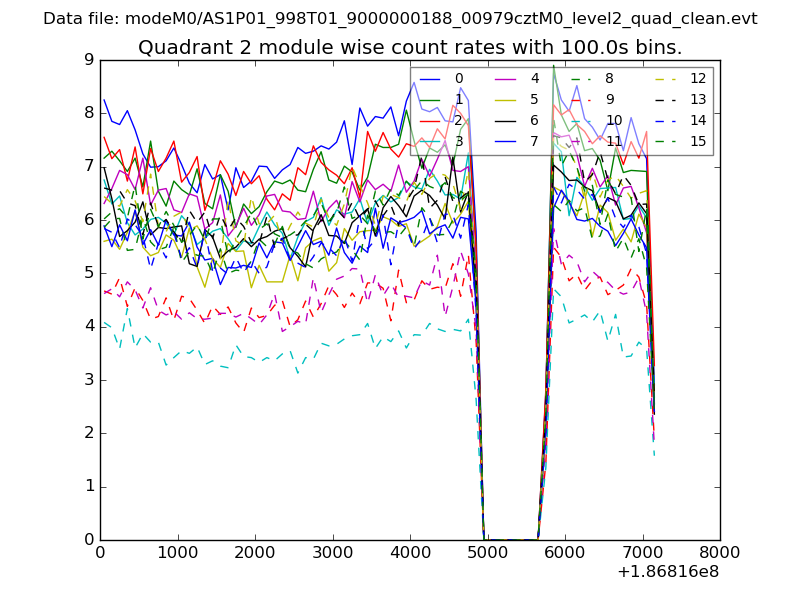
| Module-wise count rates for Quadrant B Data is divided into 100 sec bins |
 |
 |
| Module-wise count rates for Quadrant C Data is divided into 100 sec bins |
 |
 |
| Module-wise count rates for Quadrant D Data is divided into 100 sec bins |
 |
 |
| Parameter | Plot |
|---|---|
| CZT HV Monitor | 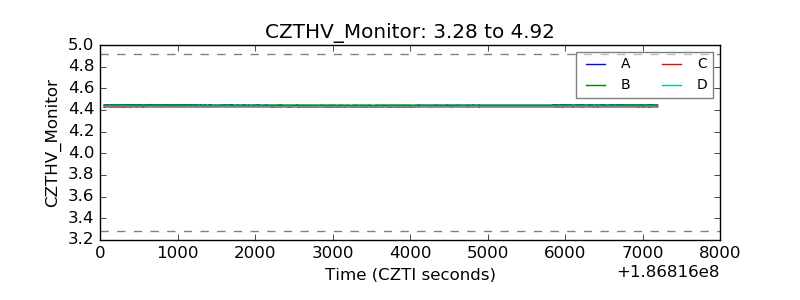 |
| D_VDD | 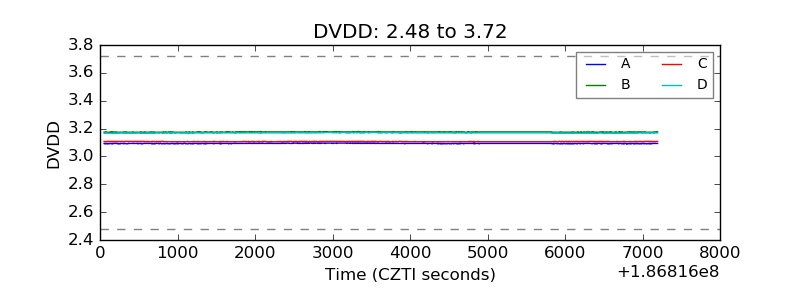 |
| Temperature 1 | 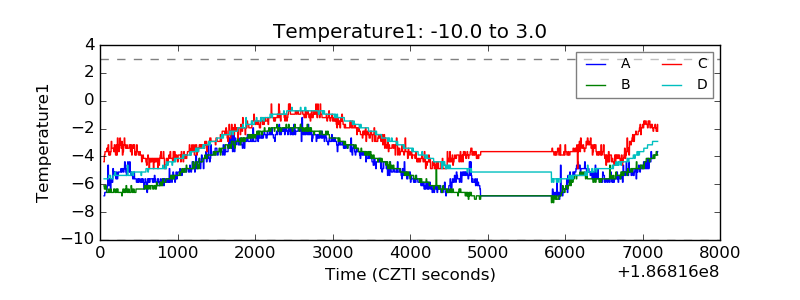 |
| Veto HV Monitor | 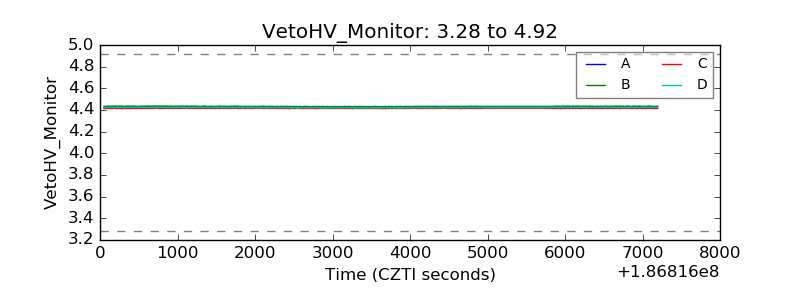 |
| Veto LLD | 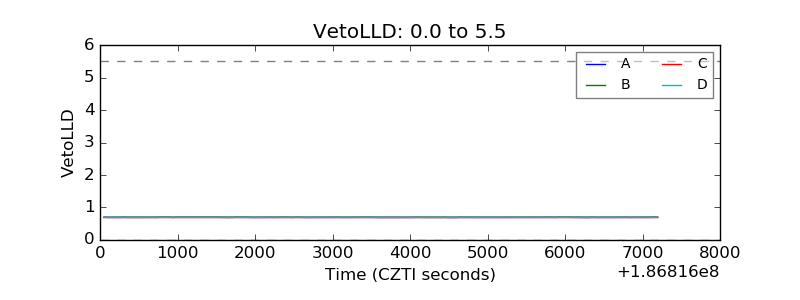 |
| Alpha Counter | 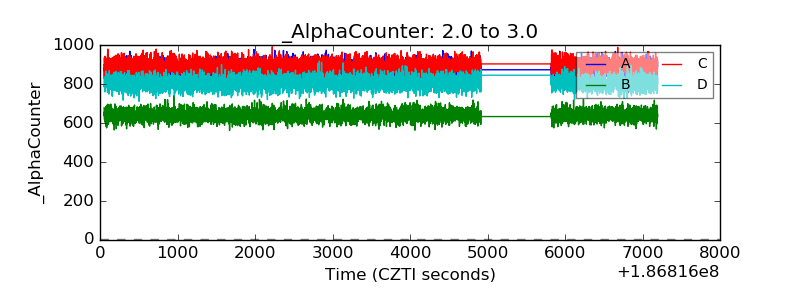 |
| _CPM_Rate | 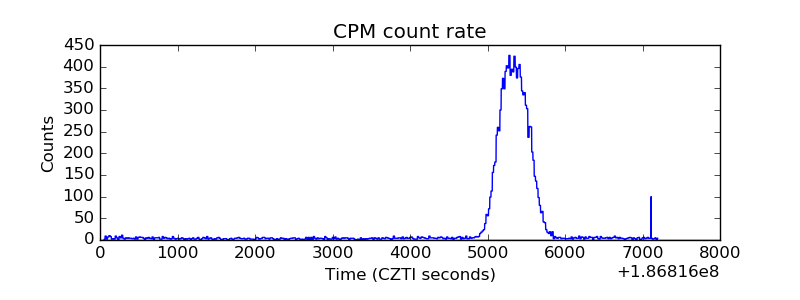 |
| CZT Counter | 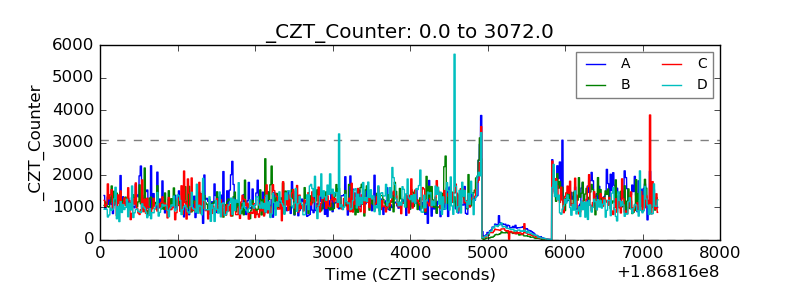 |
| +2.5 Volts monitor | 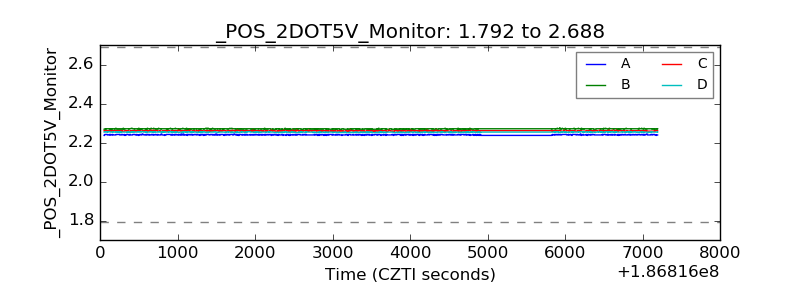 |
| +5 Volts monitor | 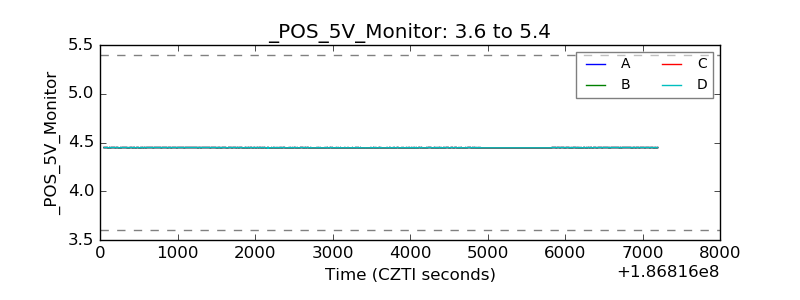 |
| _ROLL_ROT | 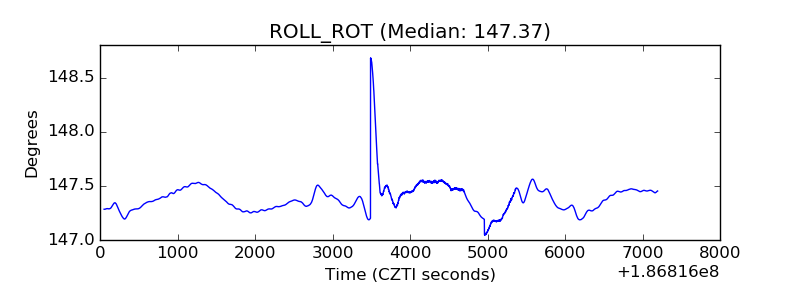 |
| _Roll_DEC | 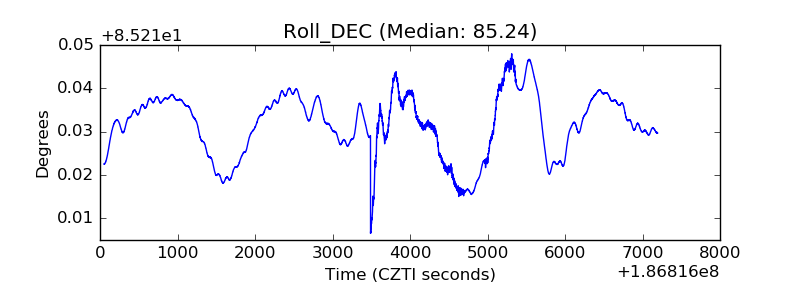 |
| _Roll_RA | 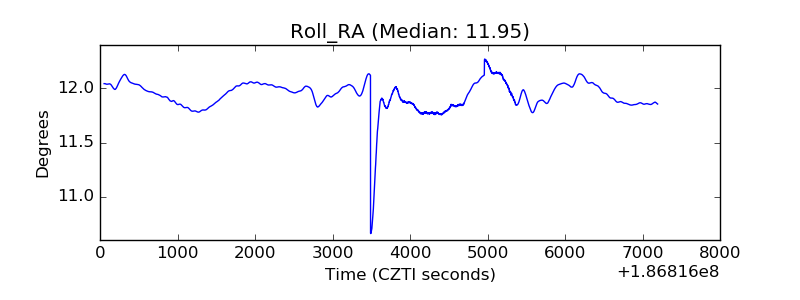 |
| Veto Counter | 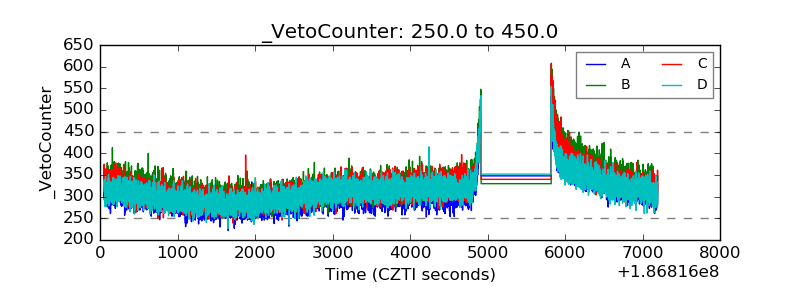 |