| Param | Original file | Final file |
|---|---|---|
| Filename | modeM0/AS1P01_998T01_9000000188_00982cztM0_level2.evt | modeM0/AS1P01_998T01_9000000188_00982cztM0_level2_quad_clean.evt |
| Size (bytes) | 1,027,376,640 | 93,000,960 |
| Size | 979.8 MB | 88.7 MB |
| Events in quadrant A | 7,651,324 | 617,774 |
| Events in quadrant B | 7,533,293 | 623,160 |
| Events in quadrant C | 7,071,944 | 595,911 |
| Events in quadrant D | 8,465,456 | 565,569 |
| Mode M0 | |||
|---|---|---|---|
| Quadrant | BADHDUFLAG | Total packets | Discarded packets |
| A | 0 | 26916 | 0 |
| B | 0 | 26520 | 0 |
| C | 0 | 25215 | 0 |
| D | 0 | 29410 | 0 |
| Mode M9 | |||
|---|---|---|---|
| Quadrant | BADHDUFLAG | Total packets | Discarded packets |
| A | 0 | 12 | 0 |
| B | 0 | 12 | 0 |
| C | 0 | 12 | 0 |
| D | 0 | 12 | 0 |
| Mode SS | |||
|---|---|---|---|
| Quadrant | BADHDUFLAG | Total packets | Discarded packets |
| A | 0 | 120 | 0 |
| B | 0 | 120 | 0 |
| C | 0 | 120 | 0 |
| D | 0 | 120 | 0 |
| Quadrant | Total seconds | Saturated seconds | Saturation percentage |
|---|---|---|---|
| A | 5924 | 89 | 1.502363% |
| B | 5924 | 38 | 0.641458% |
| C | 5924 | 23 | 0.388251% |
| D | 5924 | 504 | 8.507765% |
Noise dominated data is calculated using 1-second bins in cleaned event files. If a bin has >2000 counts, and if more than 50% of those come from <1% of pixels, then it is considered to be noise-dominated and hence unusable.
| Quadrant | # 1 sec bins | Bins with >0 counts | Bins with >2000 counts | High rate bins dominated by noise | Noise dominated (total time) | Noise dominated (detector-on time) | Marked lightcurve |
|---|---|---|---|---|---|---|---|
| A | 7049 | 5925 | 320 | 320 | 4.54% | 5.40% | 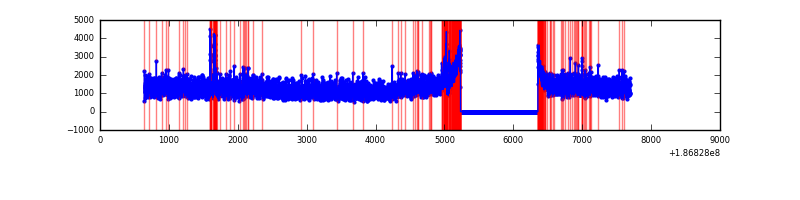 |
| B | 7049 | 5925 | 252 | 252 | 3.57% | 4.25% | 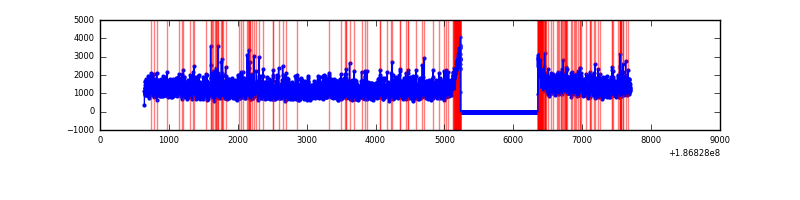 |
| C | 7049 | 5925 | 156 | 156 | 2.21% | 2.63% | 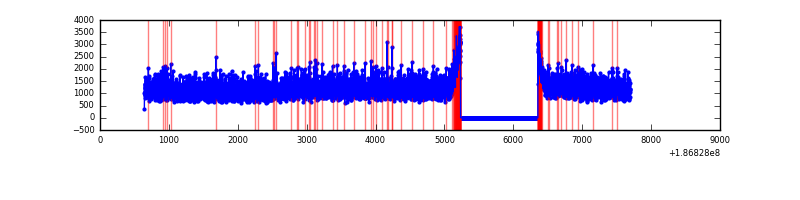 |
| D | 7049 | 5925 | 906 | 906 | 12.85% | 15.29% | 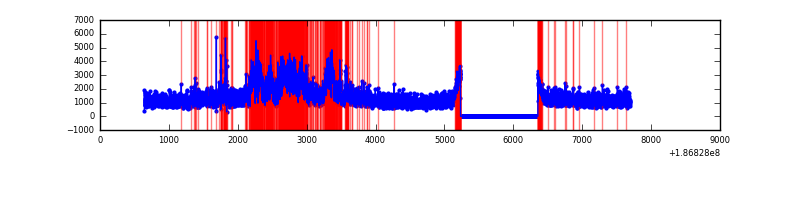 |
Top three noisy pixels from each quadrant. If the there are fewer than three noisy pixels in the level2.evt file, extra rows are filled as -1
| Pixel properties | Quadrant properties | ||||||
|---|---|---|---|---|---|---|---|
| Quadrant | DetID | PixID | Counts | Sigma | Mean | Median | Sigma |
| A | 14 | 170 | 435894 | 979.35 | 1841 | 1853 | 443.2 |
| A | 13 | 164 | 115000 | 255.3 | 1841 | 1853 | 443.2 |
| A | 15 | 233 | 22799 | 47.26 | 1841 | 1853 | 443.2 |
| B | 0 | 220 | 109434 | 243.04 | 1895 | 1906 | 442.4 |
| B | 5 | 249 | 51193 | 111.4 | 1895 | 1906 | 442.4 |
| B | 7 | 221 | 36328 | 77.8 | 1895 | 1906 | 442.4 |
| C | 15 | 241 | 300182 | 626.34 | 1716 | 1773 | 476.4 |
| C | 3 | 79 | 25317 | 49.42 | 1716 | 1773 | 476.4 |
| C | 3 | 111 | 25113 | 48.99 | 1716 | 1773 | 476.4 |
| D | 1 | 4 | 1134592 | 2279.51 | 1665 | 1710 | 497.0 |
| D | 1 | 83 | 919833 | 1847.38 | 1665 | 1710 | 497.0 |
| D | 12 | 22 | 113098 | 224.13 | 1665 | 1710 | 497.0 |
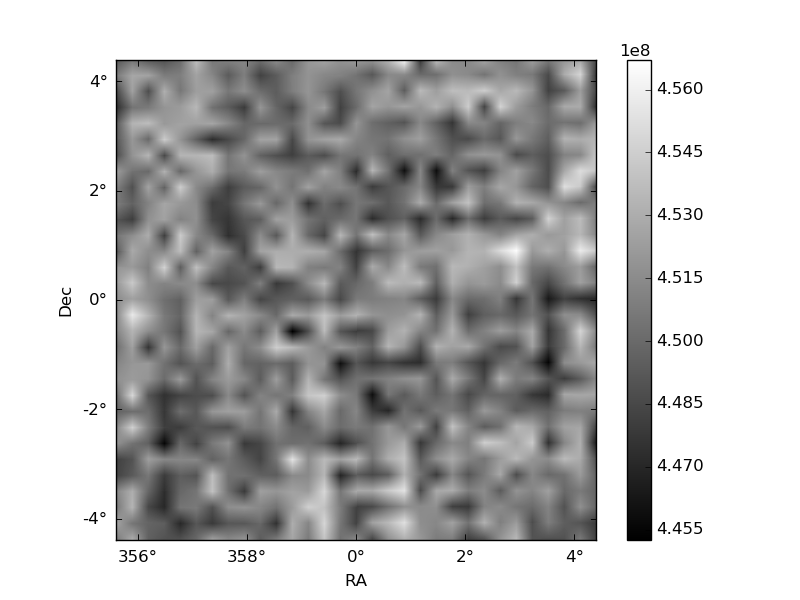
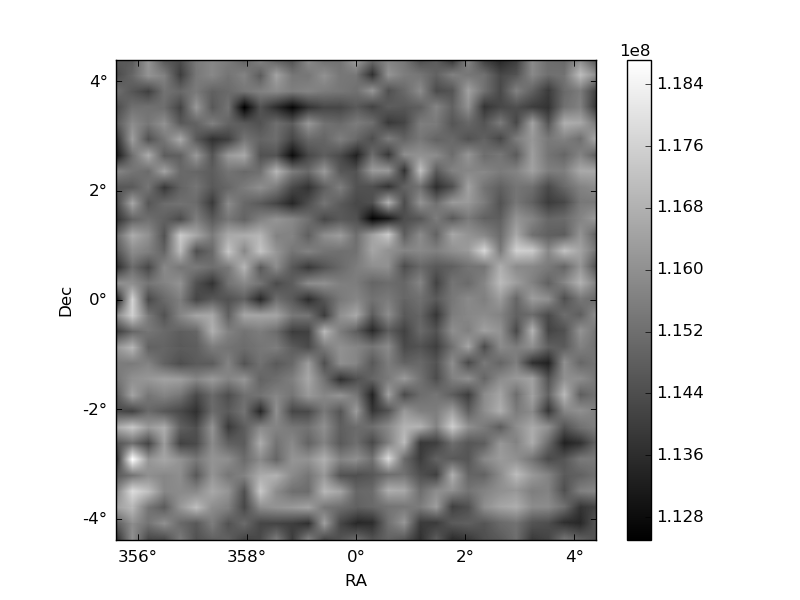
Histogram calculated using DETX and DETY for each event in the final _common_clean file
| Quadrant A | 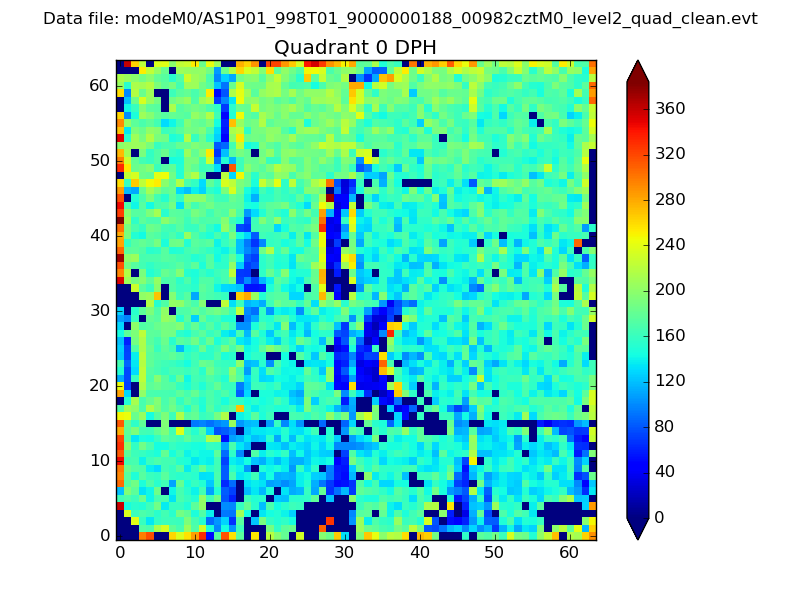 |
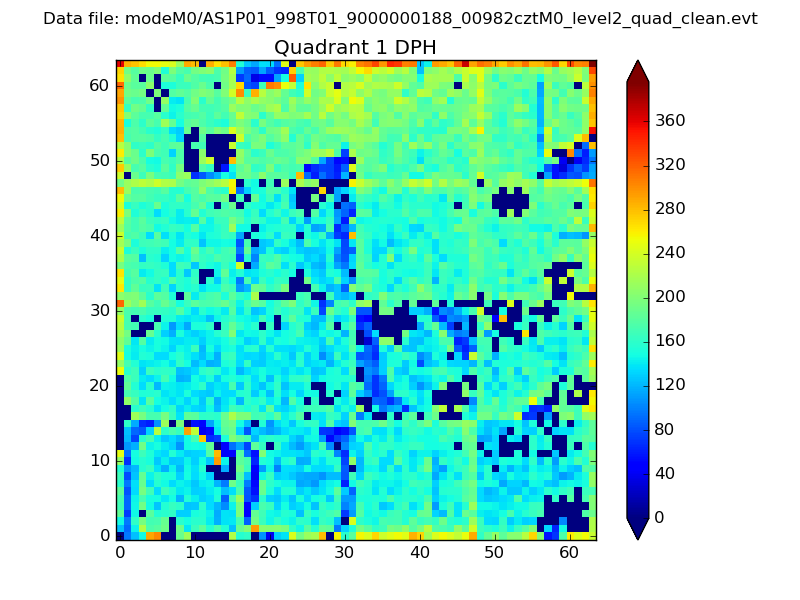 |
Quadrant B |
|---|---|---|---|
| Quadrant D | 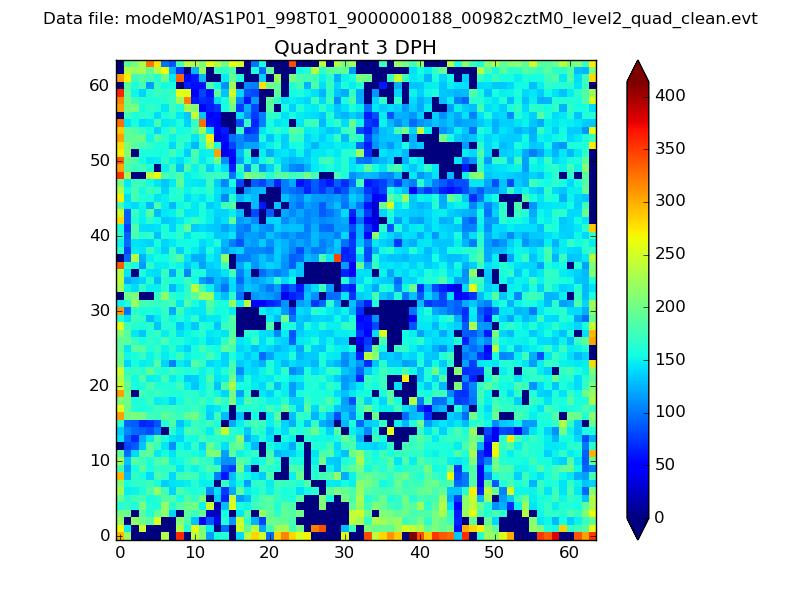 |
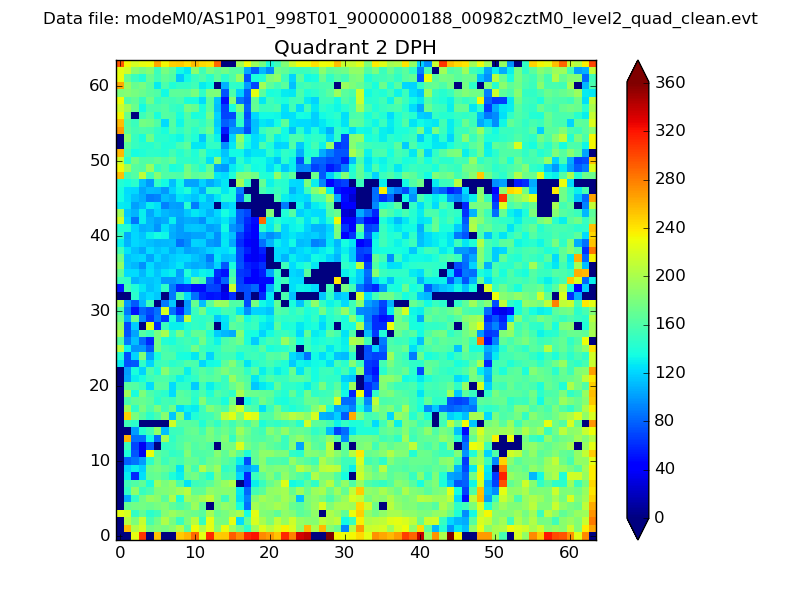 |
Quadrant C |
| Plot type | Count rate plots | Images |
|---|---|---|
| Comparison with Poisson distribution Blue bars denote a histogram of data divided into 1 sec bins. Red curve is a Poisson curve with rate = median count rate of data. |
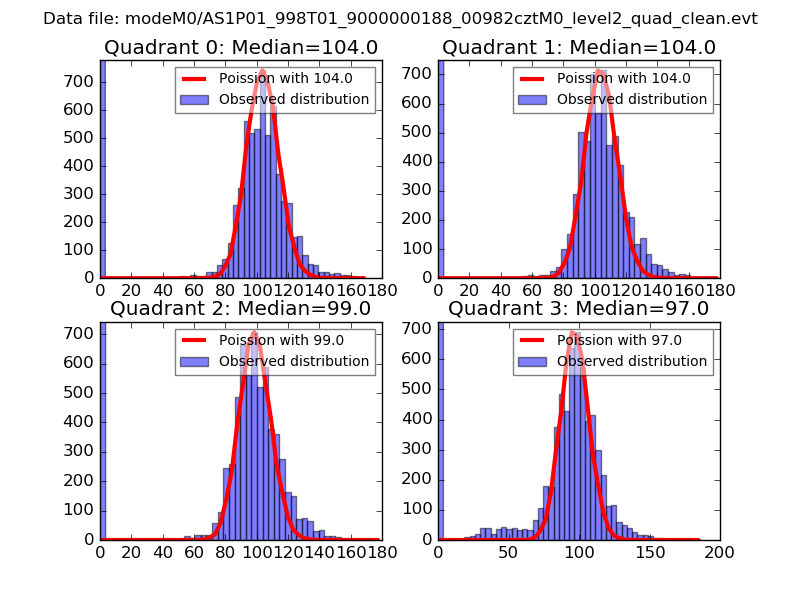 |
 |
| Quadrant-wise count rates Data is divided into 100 sec bins |
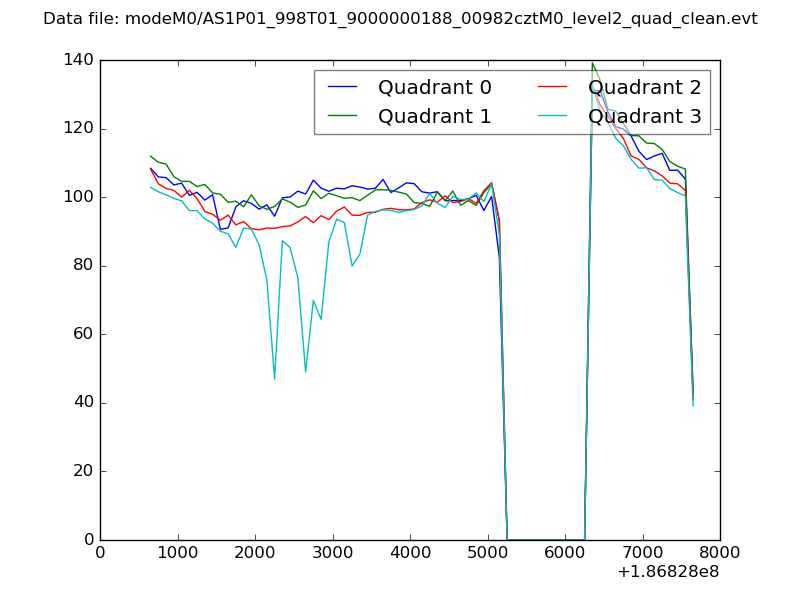 |
|
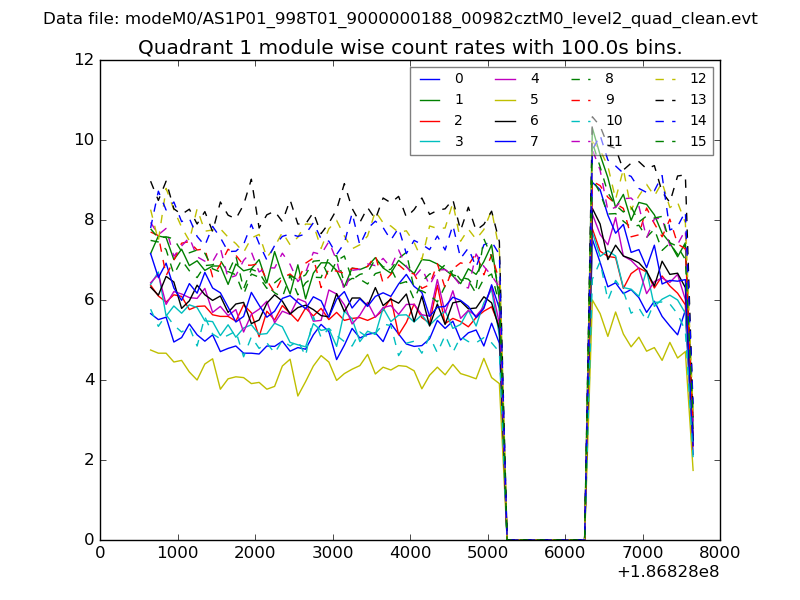
| Module-wise count rates for Quadrant A Data is divided into 100 sec bins |
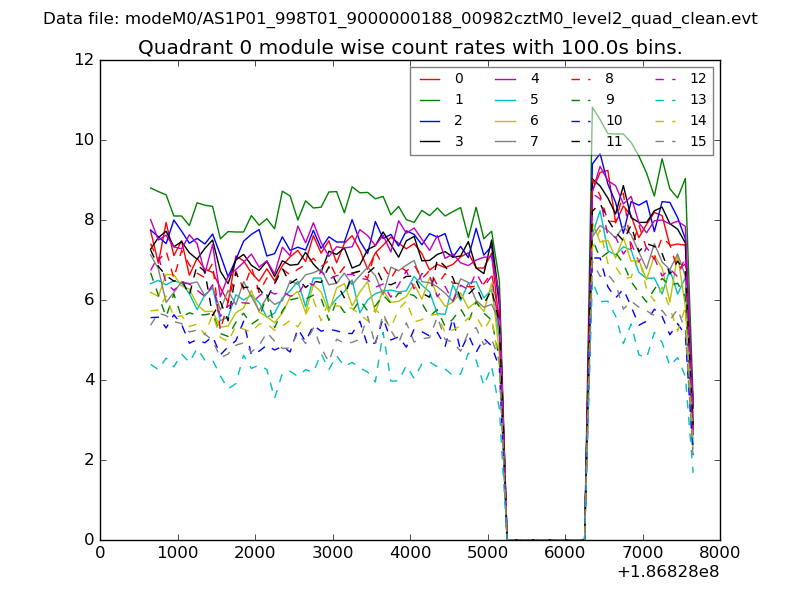 |
 |
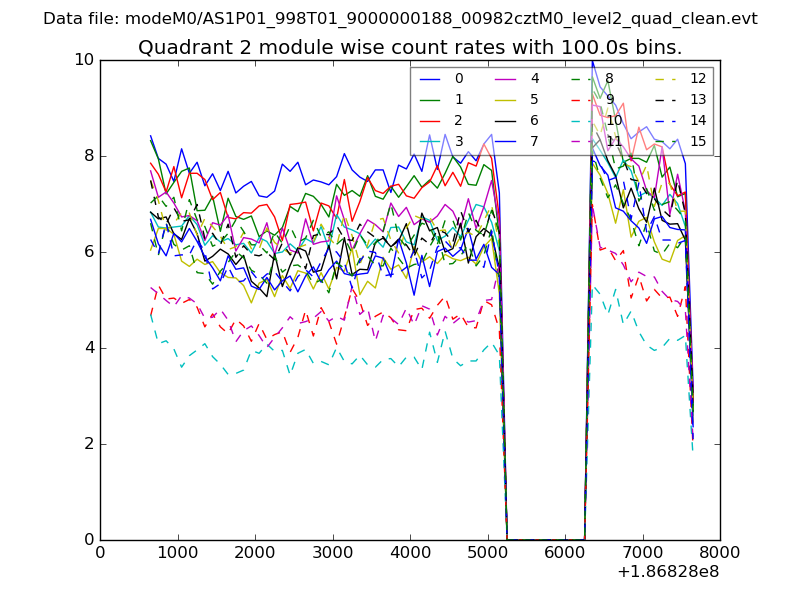
| Module-wise count rates for Quadrant B Data is divided into 100 sec bins |
 |
 |
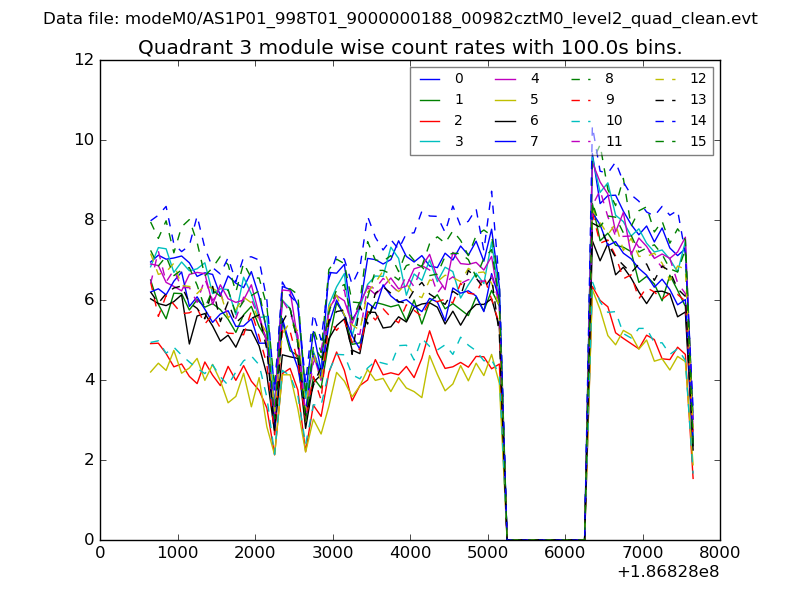
| Module-wise count rates for Quadrant C Data is divided into 100 sec bins |
 |
 |
| Module-wise count rates for Quadrant D Data is divided into 100 sec bins |
 |
 |
| Parameter | Plot |
|---|---|
| CZT HV Monitor | 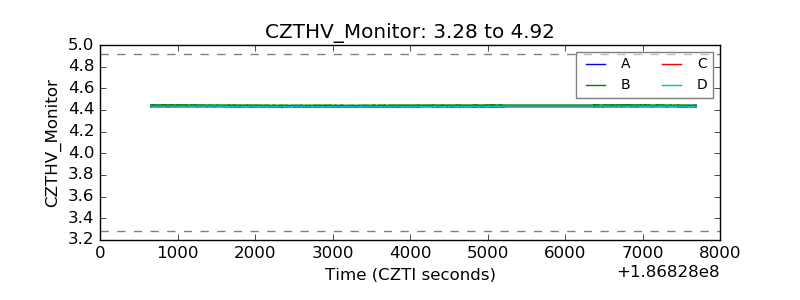 |
| D_VDD | 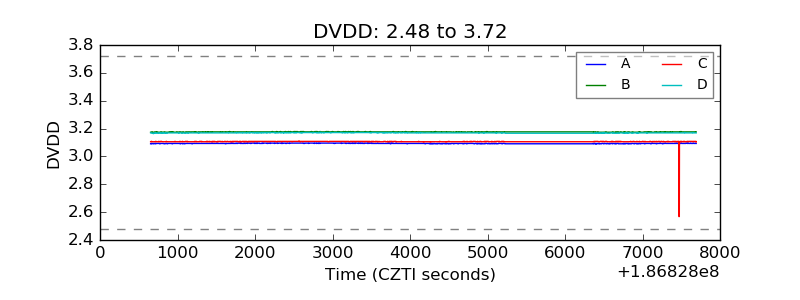 |
| Temperature 1 | 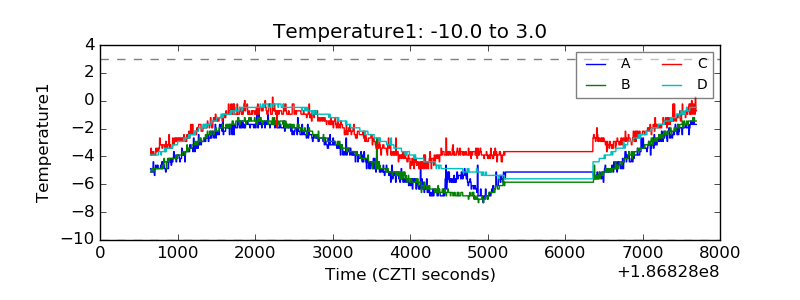 |
| Veto HV Monitor | 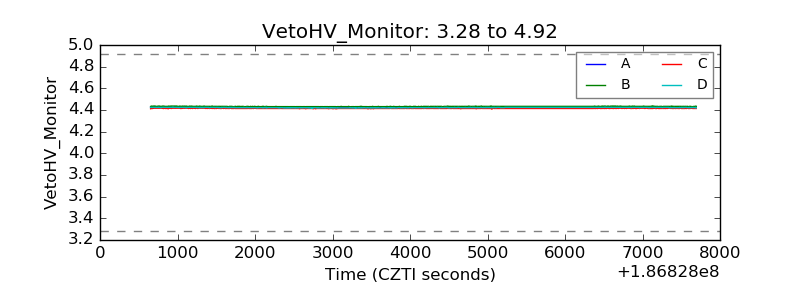 |
| Veto LLD | 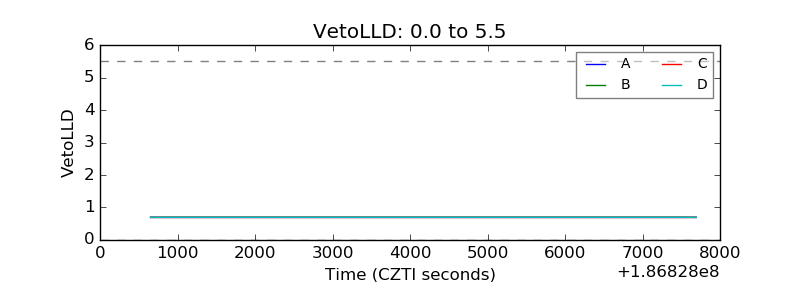 |
| Alpha Counter | 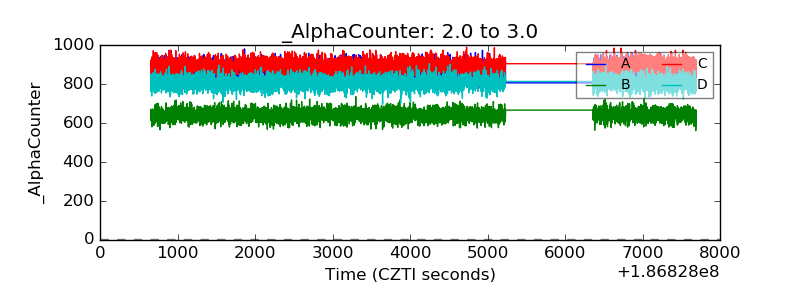 |
| _CPM_Rate | 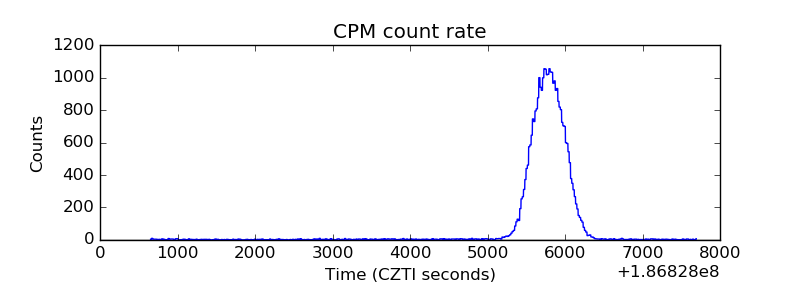 |
| CZT Counter | 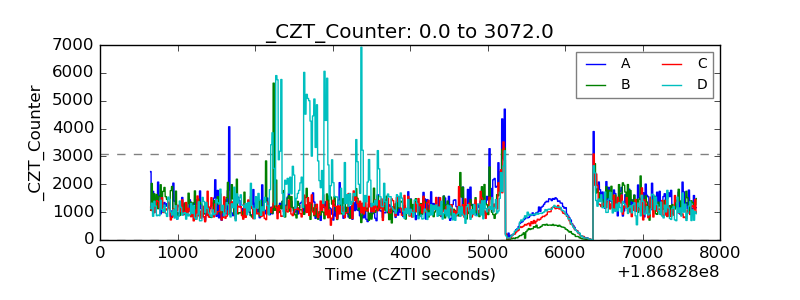 |
| +2.5 Volts monitor | 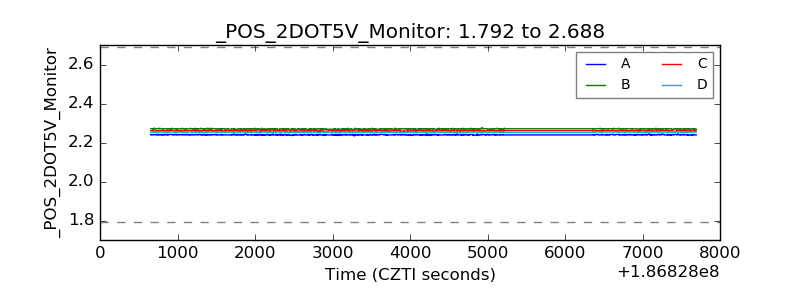 |
| +5 Volts monitor |  |
| _ROLL_ROT | 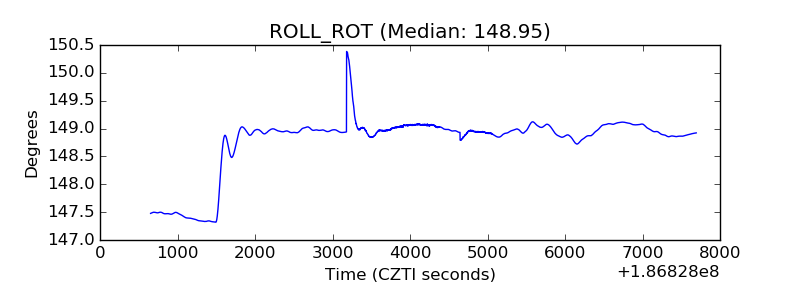 |
| _Roll_DEC | 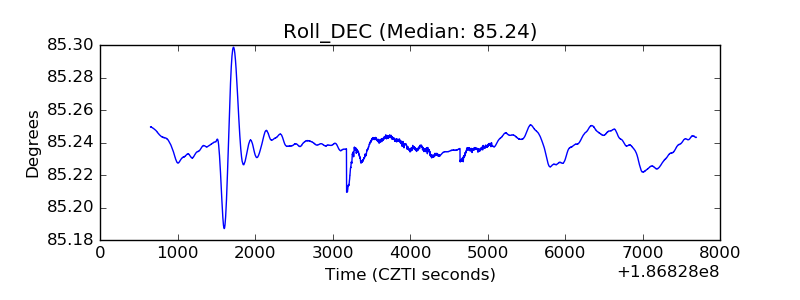 |
| _Roll_RA |  |
| Veto Counter | 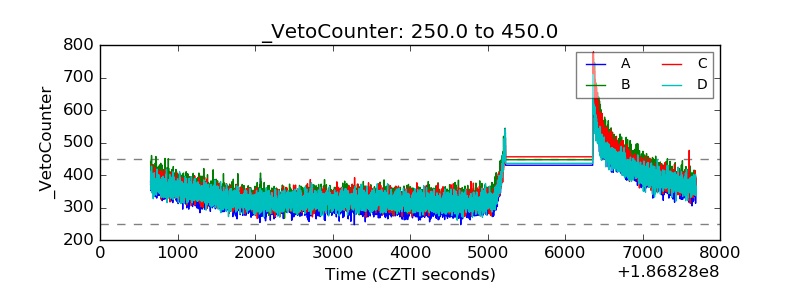 |