| Param | Original file | Final file |
|---|---|---|
| Filename | modeM0/AS1P01_998T01_9000000188_00983cztM0_level2.evt | modeM0/AS1P01_998T01_9000000188_00983cztM0_level2_quad_clean.evt |
| Size (bytes) | 1,110,093,120 | 104,019,840 |
| Size | 1.0 GB | 99.2 MB |
| Events in quadrant A | 7,865,160 | 696,529 |
| Events in quadrant B | 8,367,979 | 691,602 |
| Events in quadrant C | 7,857,770 | 666,630 |
| Events in quadrant D | 9,104,367 | 648,021 |
| Mode M0 | |||
|---|---|---|---|
| Quadrant | BADHDUFLAG | Total packets | Discarded packets |
| A | 0 | 27918 | 0 |
| B | 0 | 29401 | 0 |
| C | 0 | 27918 | 0 |
| D | 0 | 31581 | 0 |
| Mode M9 | |||
|---|---|---|---|
| Quadrant | BADHDUFLAG | Total packets | Discarded packets |
| A | 0 | 12 | 0 |
| B | 0 | 12 | 0 |
| C | 0 | 12 | 0 |
| D | 0 | 12 | 0 |
| Mode SS | |||
|---|---|---|---|
| Quadrant | BADHDUFLAG | Total packets | Discarded packets |
| A | 0 | 130 | 0 |
| B | 0 | 130 | 0 |
| C | 0 | 130 | 0 |
| D | 0 | 130 | 0 |
| Quadrant | Total seconds | Saturated seconds | Saturation percentage |
|---|---|---|---|
| A | 6416 | 36 | 0.561097% |
| B | 6416 | 84 | 1.309227% |
| C | 6415 | 23 | 0.358535% |
| D | 6415 | 112 | 1.745908% |
Noise dominated data is calculated using 1-second bins in cleaned event files. If a bin has >2000 counts, and if more than 50% of those come from <1% of pixels, then it is considered to be noise-dominated and hence unusable.
| Quadrant | # 1 sec bins | Bins with >0 counts | Bins with >2000 counts | High rate bins dominated by noise | Noise dominated (total time) | Noise dominated (detector-on time) | Marked lightcurve |
|---|---|---|---|---|---|---|---|
| A | 7626 | 6417 | 203 | 203 | 2.66% | 3.16% | 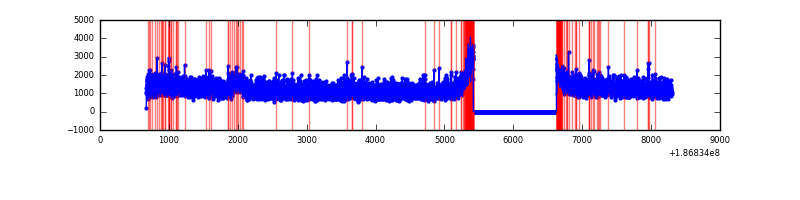 |
| B | 7626 | 6417 | 341 | 341 | 4.47% | 5.31% |  |
| C | 7625 | 6416 | 173 | 173 | 2.27% | 2.70% | 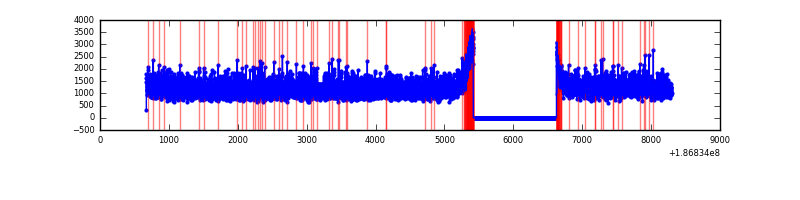 |
| D | 7625 | 6416 | 775 | 775 | 10.16% | 12.08% | 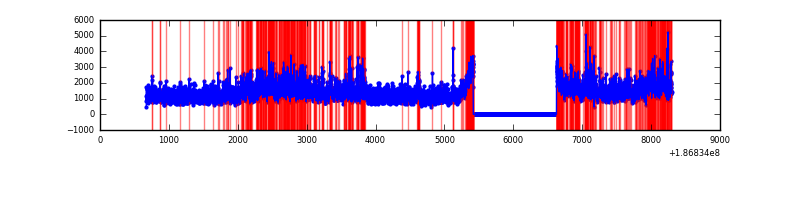 |
Top three noisy pixels from each quadrant. If the there are fewer than three noisy pixels in the level2.evt file, extra rows are filled as -1
| Pixel properties | Quadrant properties | ||||||
|---|---|---|---|---|---|---|---|
| Quadrant | DetID | PixID | Counts | Sigma | Mean | Median | Sigma |
| A | 15 | 233 | 81736 | 166.25 | 2016 | 2028 | 479.4 |
| A | 12 | 247 | 14315 | 25.63 | 2016 | 2028 | 479.4 |
| A | 14 | 170 | 12308 | 21.44 | 2016 | 2028 | 479.4 |
| B | 5 | 200 | 155810 | 320.05 | 2052 | 2064 | 480.4 |
| B | 0 | 220 | 126316 | 258.65 | 2052 | 2064 | 480.4 |
| B | 7 | 221 | 101037 | 206.03 | 2052 | 2064 | 480.4 |
| C | 15 | 241 | 327979 | 625.57 | 1885 | 1953 | 521.2 |
| C | 3 | 9 | 99642 | 187.44 | 1885 | 1953 | 521.2 |
| C | 3 | 79 | 35224 | 63.84 | 1885 | 1953 | 521.2 |
| D | 1 | 4 | 1314272 | 2310.19 | 1855 | 1916 | 568.1 |
| D | 12 | 188 | 582269 | 1021.62 | 1855 | 1916 | 568.1 |
| D | 12 | 22 | 135644 | 235.41 | 1855 | 1916 | 568.1 |
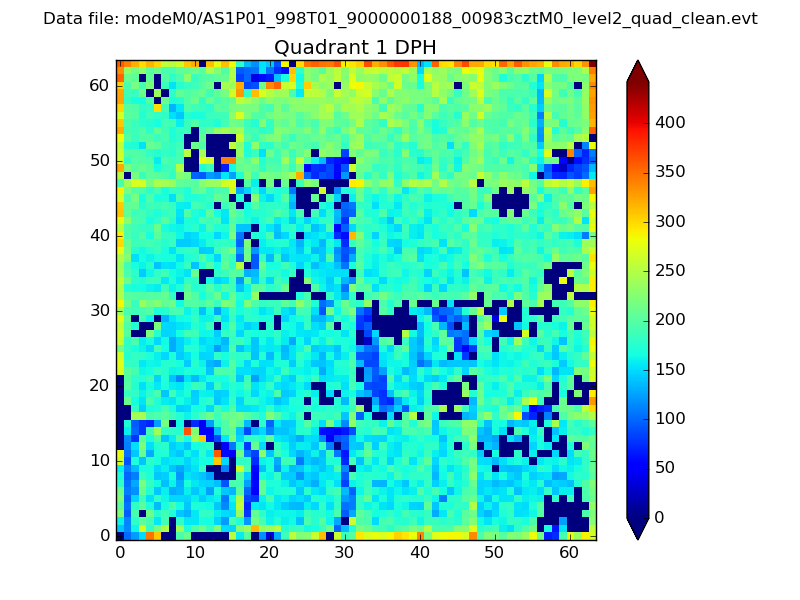
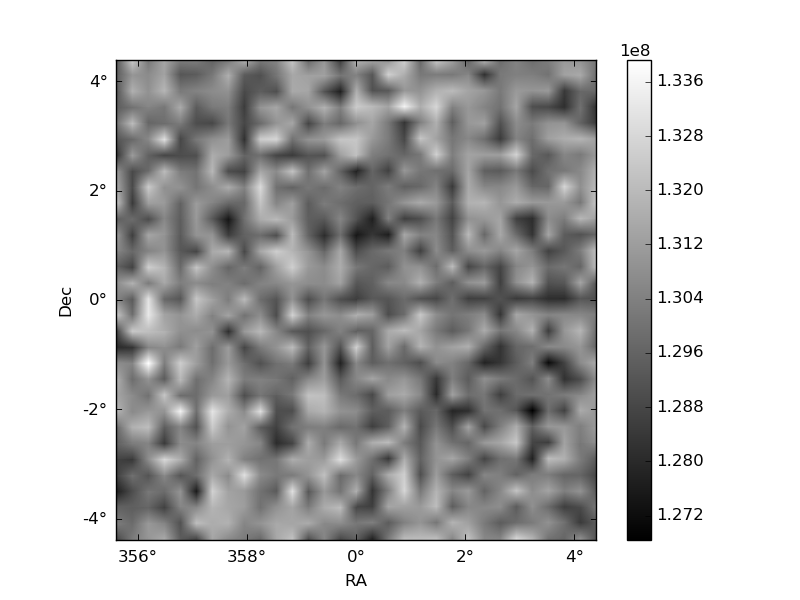
Histogram calculated using DETX and DETY for each event in the final _common_clean file
| Quadrant A | 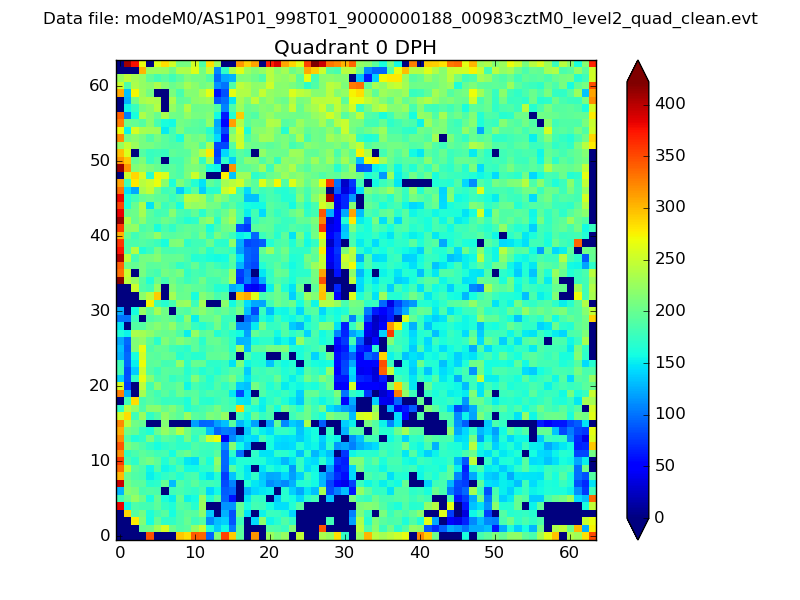 |
 |
Quadrant B |
|---|---|---|---|
| Quadrant D | 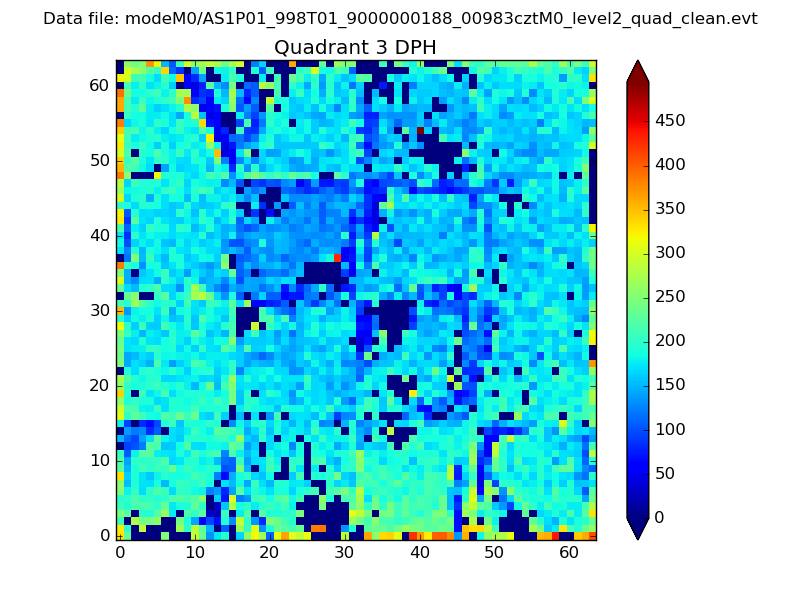 |
 |
Quadrant C |
| Plot type | Count rate plots | Images |
|---|---|---|
| Comparison with Poisson distribution Blue bars denote a histogram of data divided into 1 sec bins. Red curve is a Poisson curve with rate = median count rate of data. |
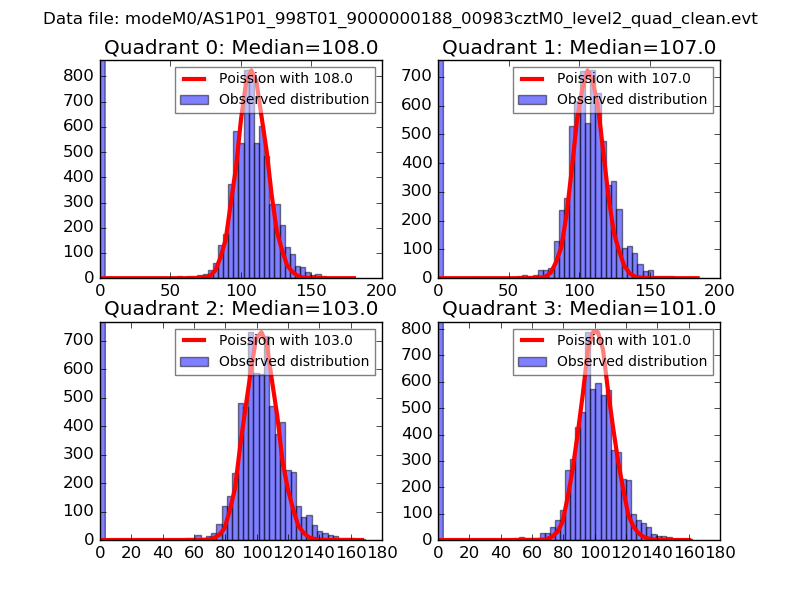 |
 |
| Quadrant-wise count rates Data is divided into 100 sec bins |
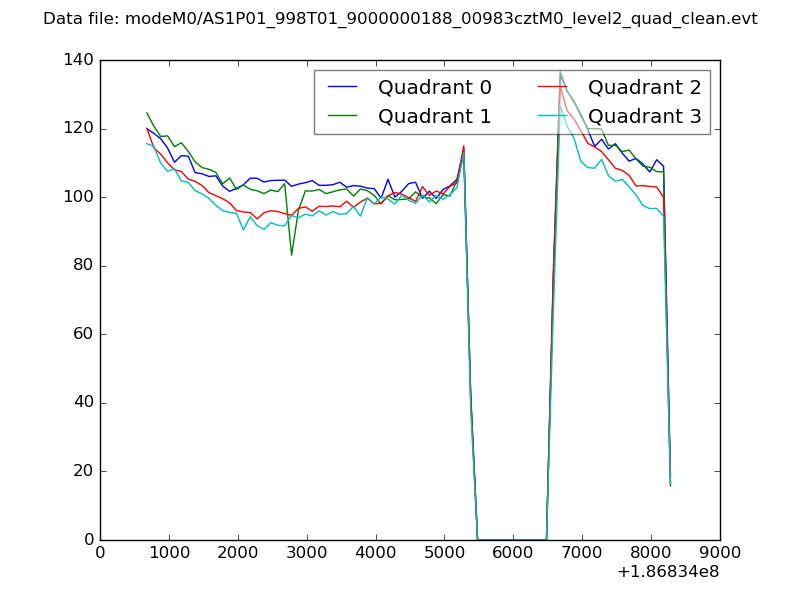 |
|
| Module-wise count rates for Quadrant A Data is divided into 100 sec bins |
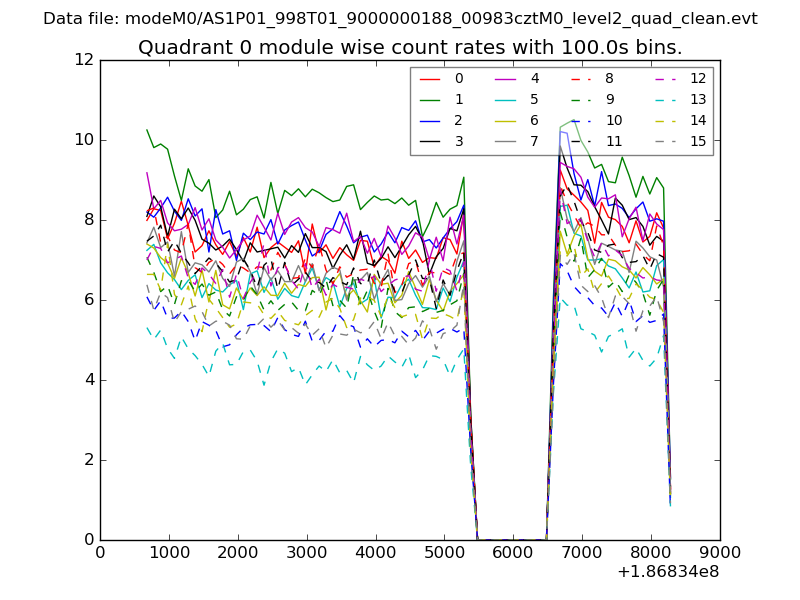 |
 |
| Module-wise count rates for Quadrant B Data is divided into 100 sec bins |
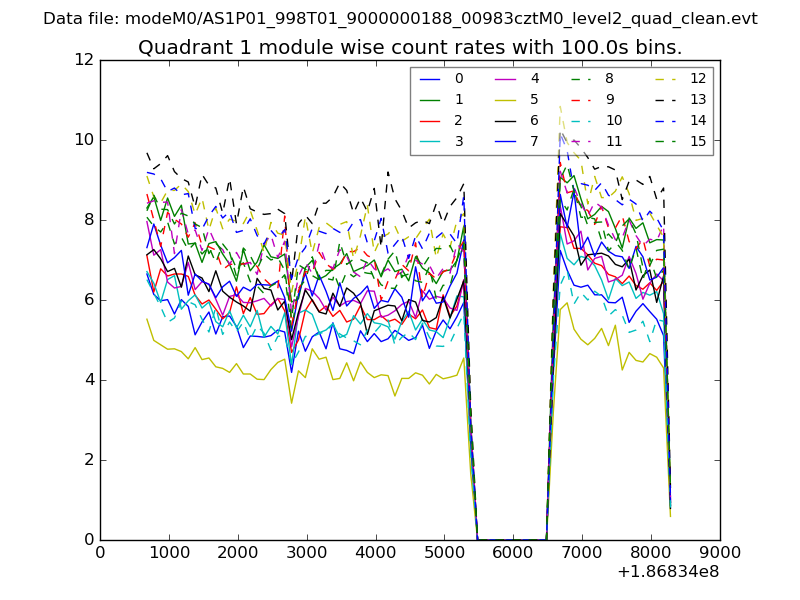 |
 |
| Module-wise count rates for Quadrant C Data is divided into 100 sec bins |
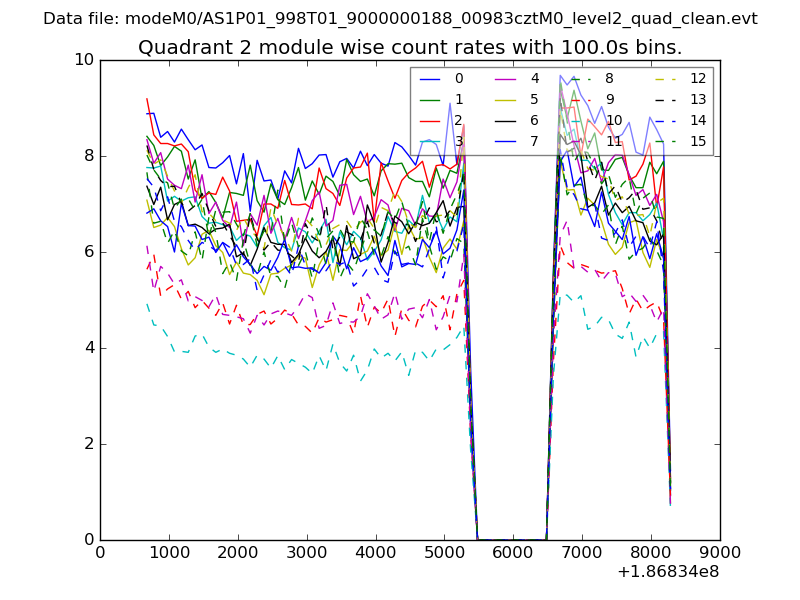 |
 |
| Module-wise count rates for Quadrant D Data is divided into 100 sec bins |
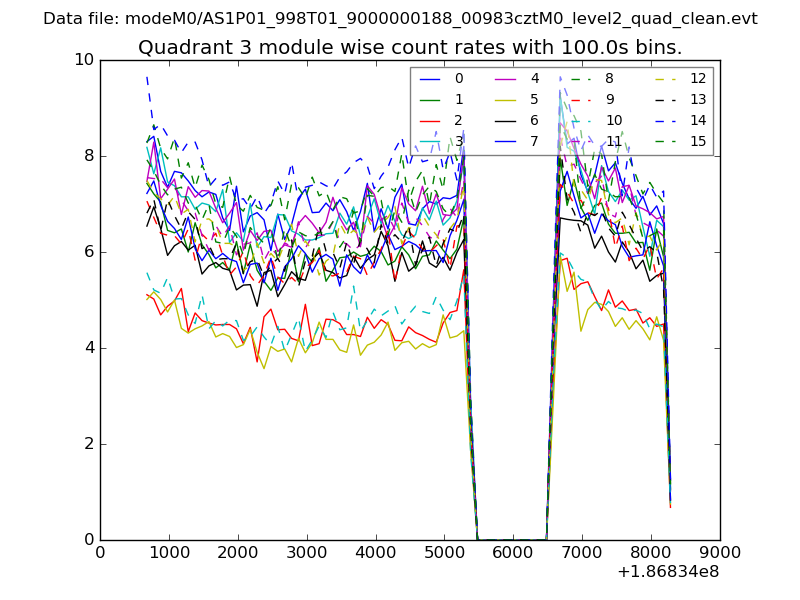 |
 |
| Parameter | Plot |
|---|---|
| CZT HV Monitor | 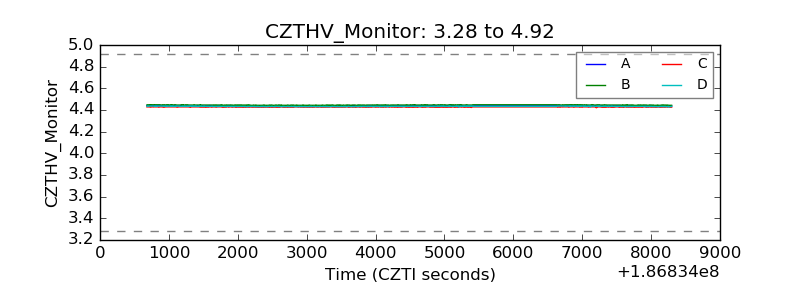 |
| D_VDD | 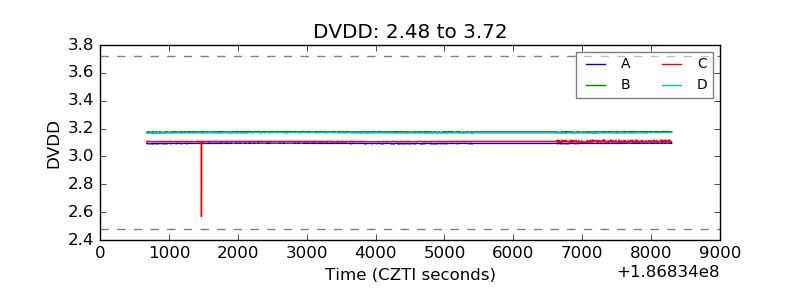 |
| Temperature 1 | 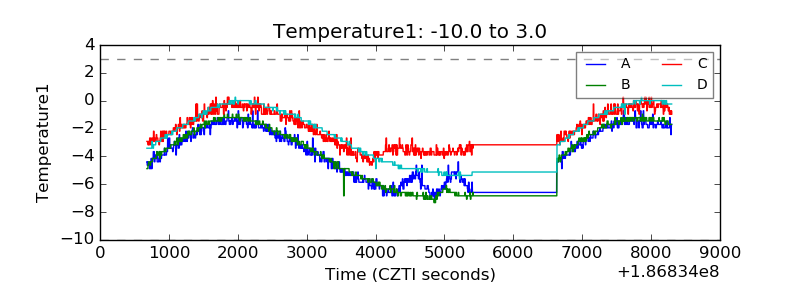 |
| Veto HV Monitor | 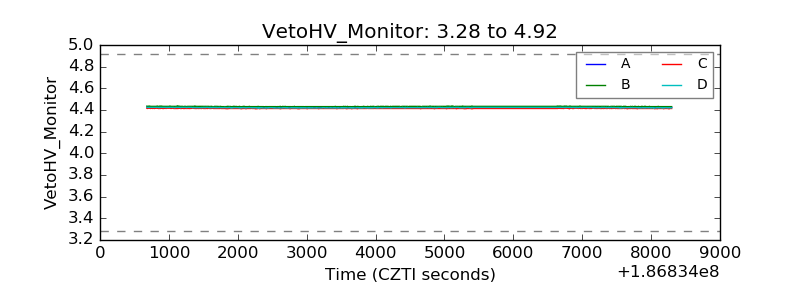 |
| Veto LLD | 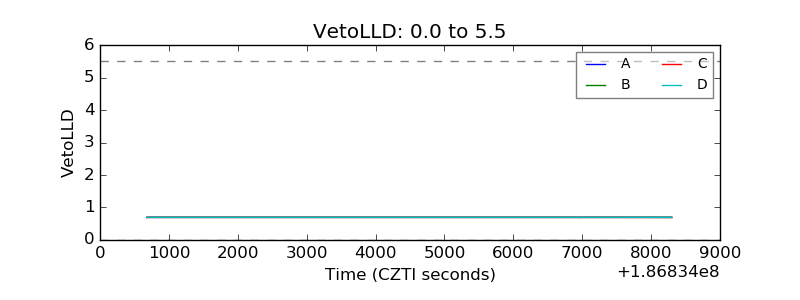 |
| Alpha Counter | 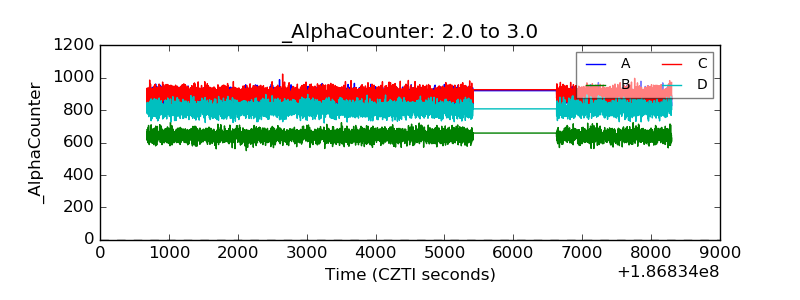 |
| _CPM_Rate | 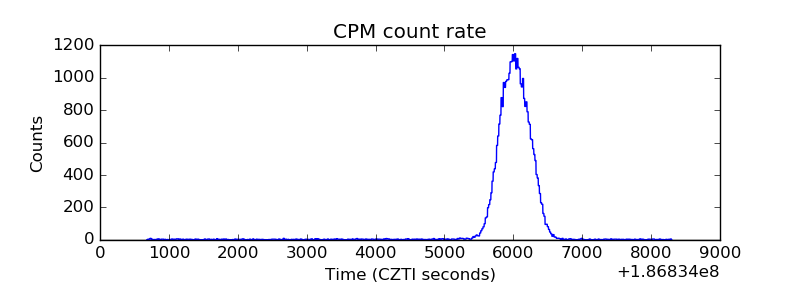 |
| CZT Counter | 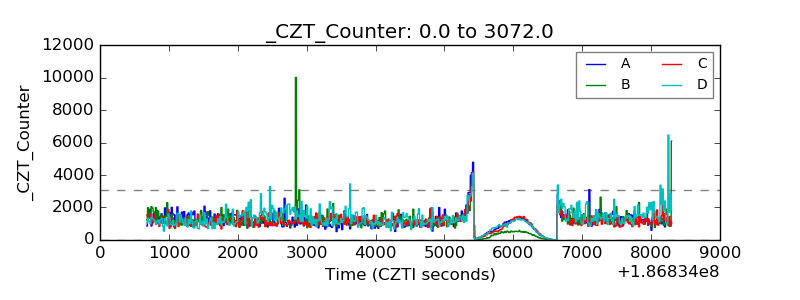 |
| +2.5 Volts monitor |  |
| +5 Volts monitor |  |
| _ROLL_ROT | 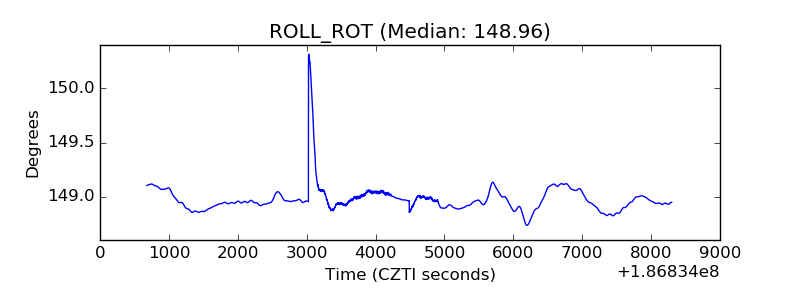 |
| _Roll_DEC | 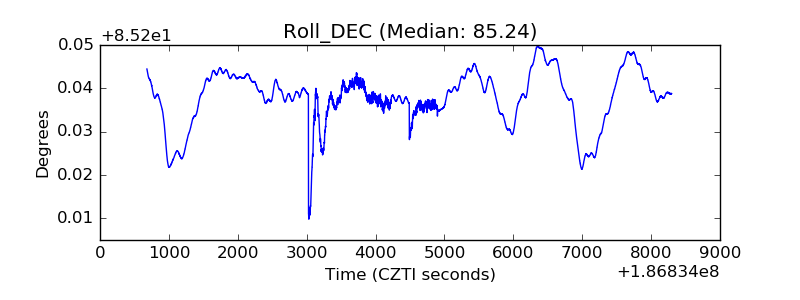 |
| _Roll_RA | 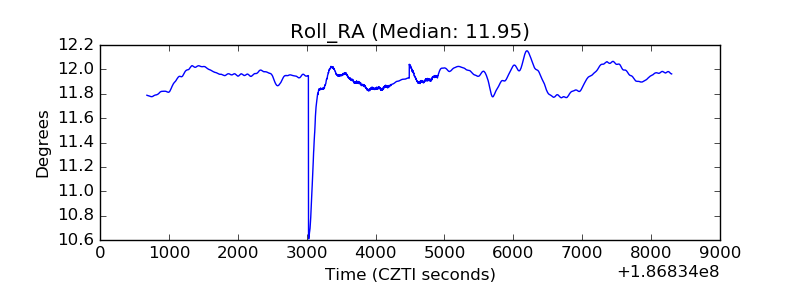 |
| Veto Counter | 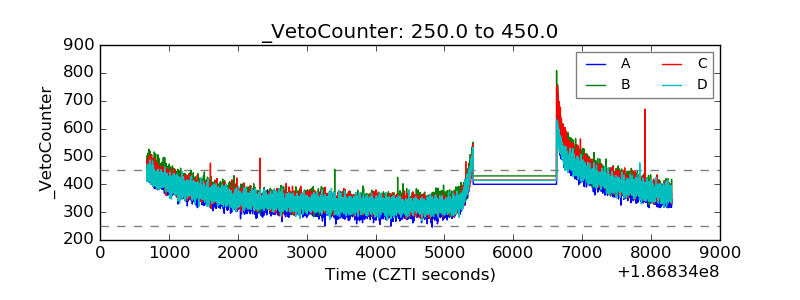 |