| Param | Original file | Final file |
|---|---|---|
| Filename | modeM0/AS1P01_998T01_9000000188_00984cztM0_level2.evt | modeM0/AS1P01_998T01_9000000188_00984cztM0_level2_quad_clean.evt |
| Size (bytes) | 998,815,680 | 94,544,640 |
| Size | 952.5 MB | 90.2 MB |
| Events in quadrant A | 6,986,921 | 631,811 |
| Events in quadrant B | 7,447,406 | 624,485 |
| Events in quadrant C | 7,210,135 | 608,467 |
| Events in quadrant D | 8,218,714 | 590,901 |
| Mode M0 | |||
|---|---|---|---|
| Quadrant | BADHDUFLAG | Total packets | Discarded packets |
| A | 0 | 24903 | 0 |
| B | 0 | 26303 | 0 |
| C | 0 | 25582 | 0 |
| D | 0 | 28551 | 0 |
| Mode M9 | |||
|---|---|---|---|
| Quadrant | BADHDUFLAG | Total packets | Discarded packets |
| A | 0 | 13 | 0 |
| B | 0 | 13 | 0 |
| C | 0 | 13 | 0 |
| D | 0 | 13 | 0 |
| Mode SS | |||
|---|---|---|---|
| Quadrant | BADHDUFLAG | Total packets | Discarded packets |
| A | 0 | 118 | 0 |
| B | 0 | 118 | 0 |
| C | 0 | 118 | 0 |
| D | 0 | 118 | 0 |
| Quadrant | Total seconds | Saturated seconds | Saturation percentage |
|---|---|---|---|
| A | 5834 | 34 | 0.582791% |
| B | 5834 | 61 | 1.045595% |
| C | 5835 | 23 | 0.394173% |
| D | 5835 | 109 | 1.868038% |
Noise dominated data is calculated using 1-second bins in cleaned event files. If a bin has >2000 counts, and if more than 50% of those come from <1% of pixels, then it is considered to be noise-dominated and hence unusable.
| Quadrant | # 1 sec bins | Bins with >0 counts | Bins with >2000 counts | High rate bins dominated by noise | Noise dominated (total time) | Noise dominated (detector-on time) | Marked lightcurve |
|---|---|---|---|---|---|---|---|
| A | 7079 | 5835 | 193 | 193 | 2.73% | 3.31% | 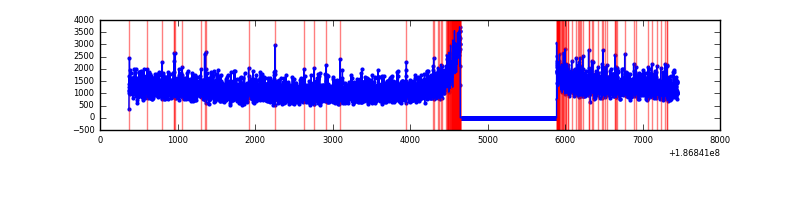 |
| B | 7079 | 5835 | 315 | 315 | 4.45% | 5.40% | 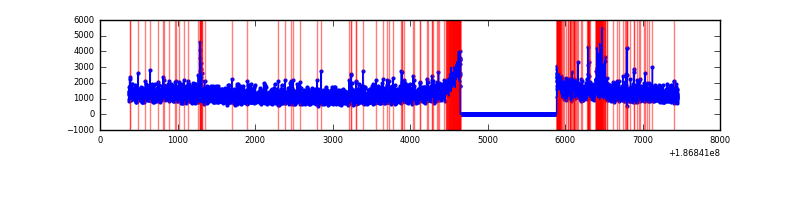 |
| C | 7080 | 5836 | 178 | 178 | 2.51% | 3.05% | 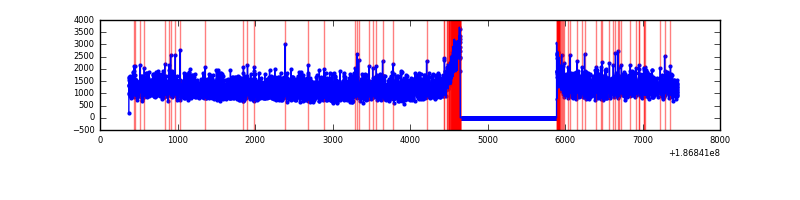 |
| D | 7080 | 5836 | 619 | 619 | 8.74% | 10.61% | 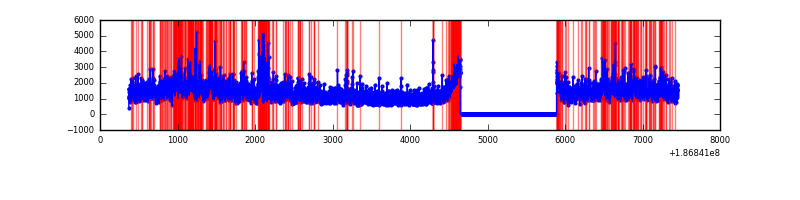 |
Top three noisy pixels from each quadrant. If the there are fewer than three noisy pixels in the level2.evt file, extra rows are filled as -1
| Pixel properties | Quadrant properties | ||||||
|---|---|---|---|---|---|---|---|
| Quadrant | DetID | PixID | Counts | Sigma | Mean | Median | Sigma |
| A | 10 | 133 | 17530 | 36.37 | 1808 | 1816 | 432.1 |
| A | 12 | 189 | 16621 | 34.26 | 1808 | 1816 | 432.1 |
| A | 11 | 79 | 7990 | 14.29 | 1808 | 1816 | 432.1 |
| B | 5 | 249 | 134327 | 307.51 | 1856 | 1863 | 430.8 |
| B | 7 | 221 | 89013 | 202.31 | 1856 | 1863 | 430.8 |
| B | 8 | 234 | 46965 | 104.7 | 1856 | 1863 | 430.8 |
| C | 15 | 241 | 319106 | 668.59 | 1723 | 1782 | 474.6 |
| C | 3 | 9 | 96609 | 199.8 | 1723 | 1782 | 474.6 |
| C | 3 | 79 | 37992 | 76.29 | 1723 | 1782 | 474.6 |
| D | 12 | 188 | 910775 | 1772.68 | 1682 | 1739 | 512.8 |
| D | 1 | 4 | 803727 | 1563.93 | 1682 | 1739 | 512.8 |
| D | 2 | 16 | 51816 | 97.65 | 1682 | 1739 | 512.8 |
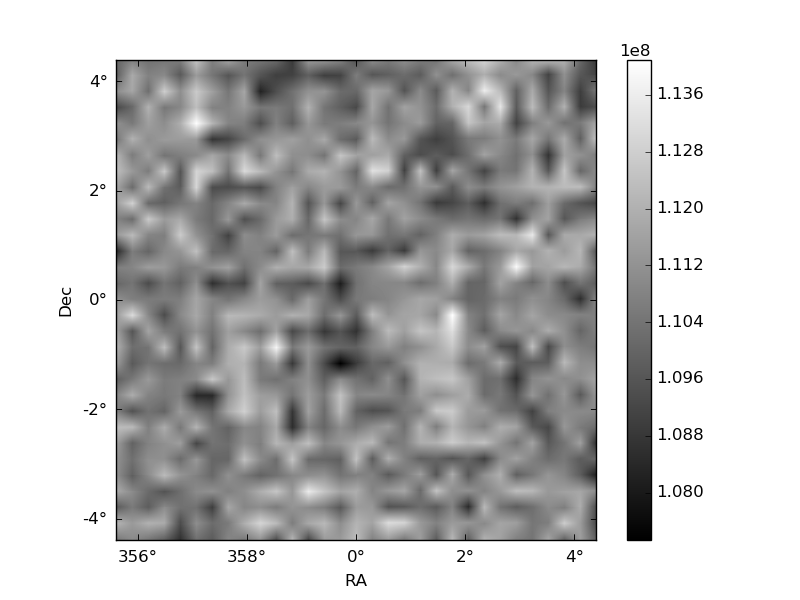
Histogram calculated using DETX and DETY for each event in the final _common_clean file
| Quadrant A | 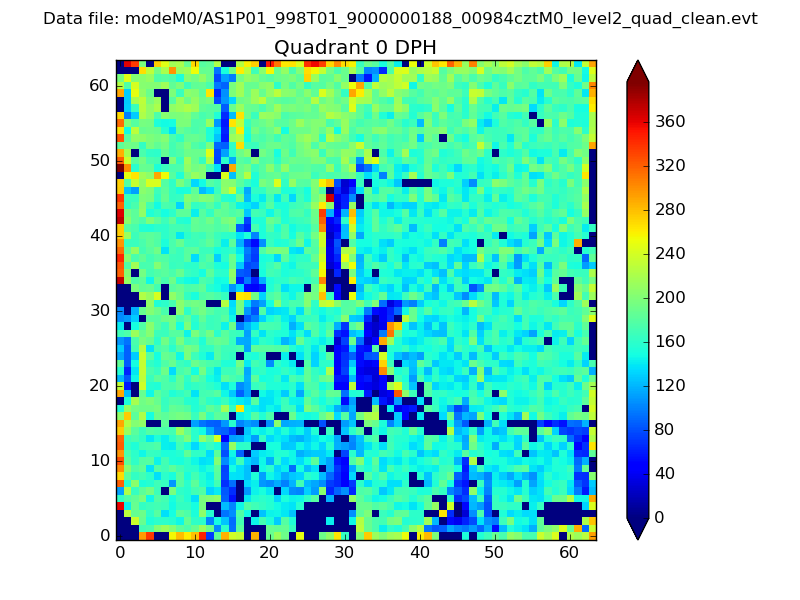 |
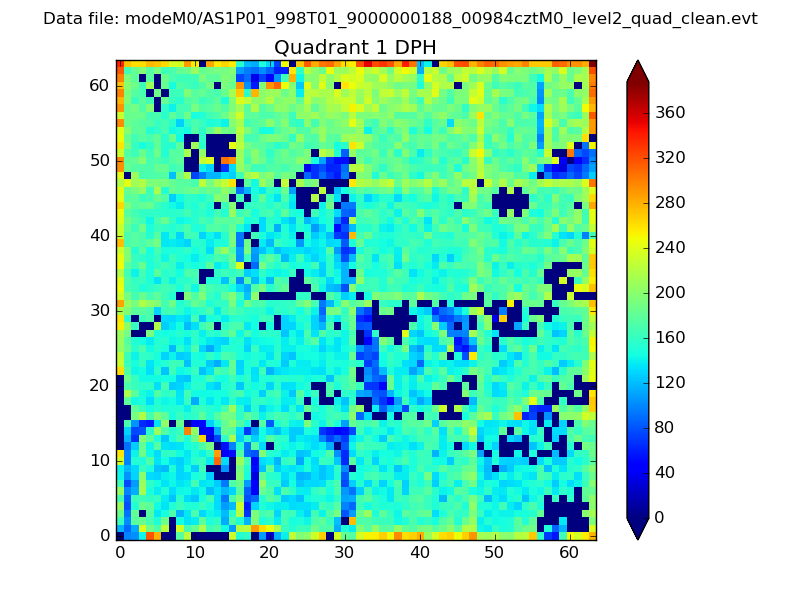 |
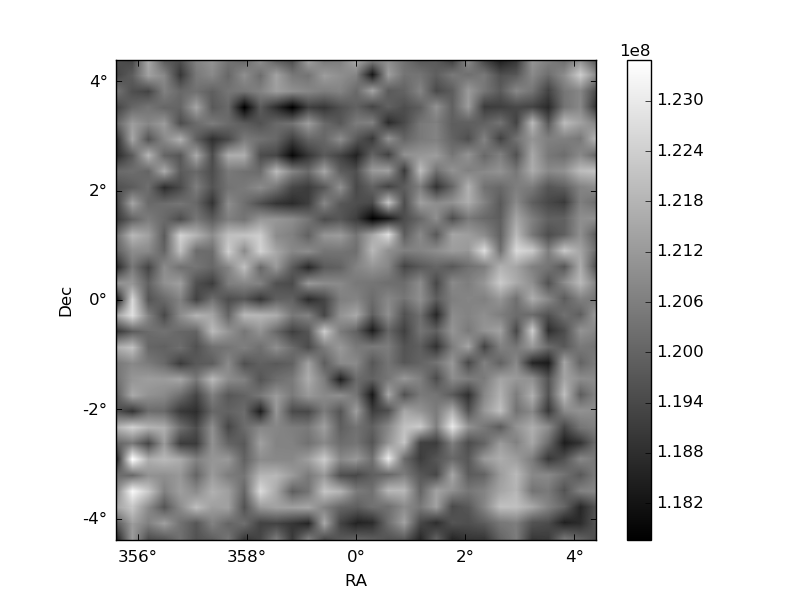
Quadrant B |
|---|---|---|---|
| Quadrant D | 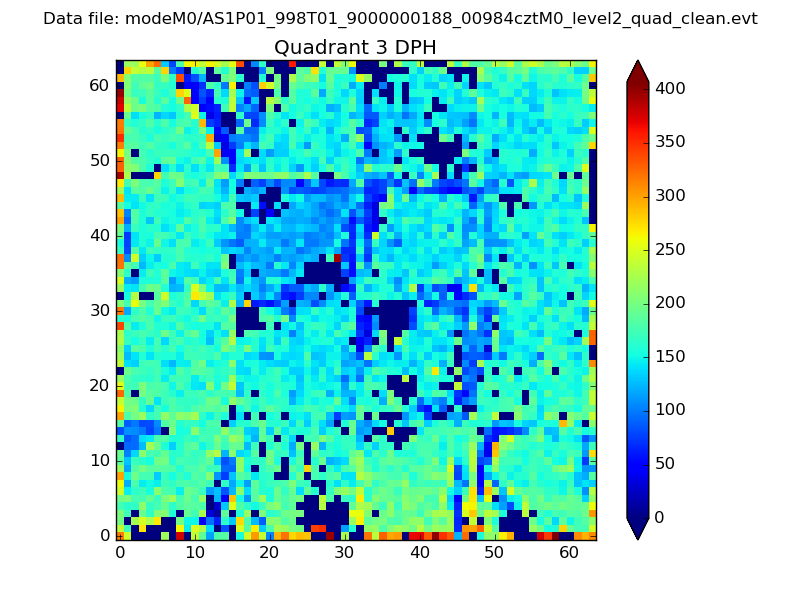 |
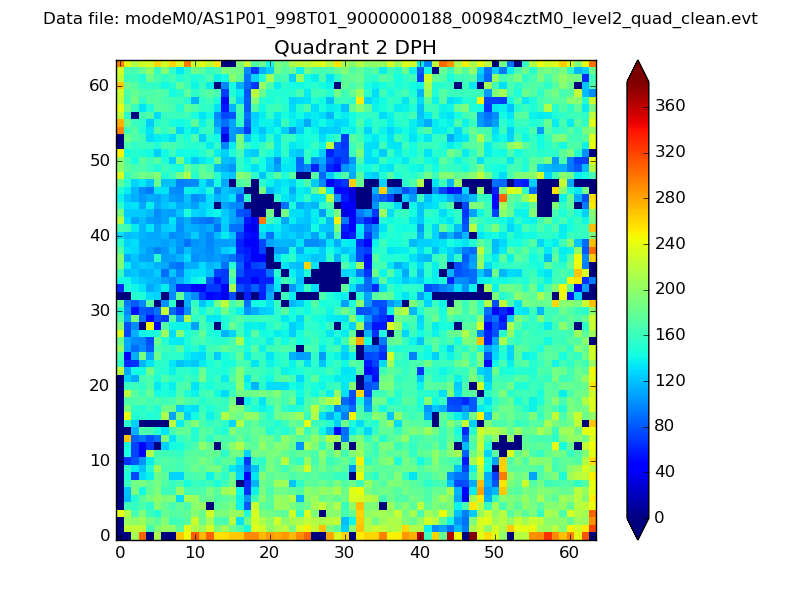 |
Quadrant C |
| Plot type | Count rate plots | Images |
|---|---|---|
| Comparison with Poisson distribution Blue bars denote a histogram of data divided into 1 sec bins. Red curve is a Poisson curve with rate = median count rate of data. |
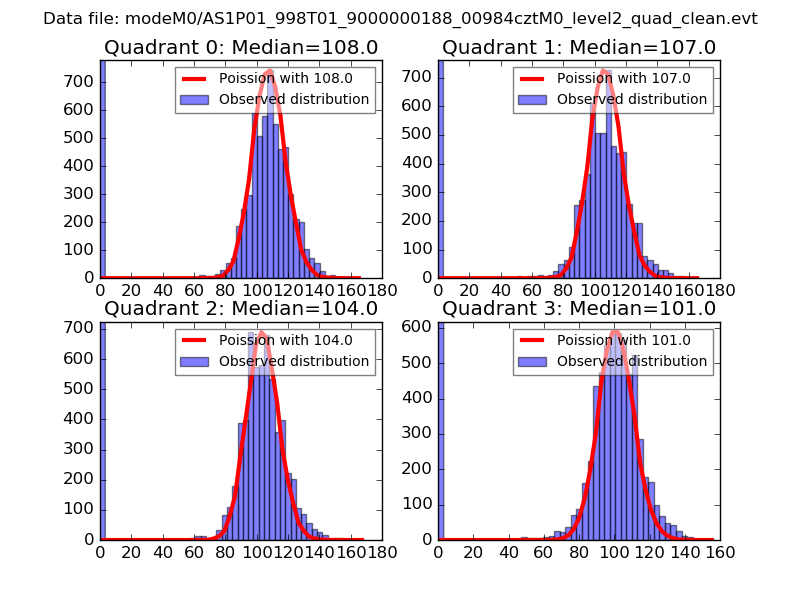 |
 |
| Quadrant-wise count rates Data is divided into 100 sec bins |
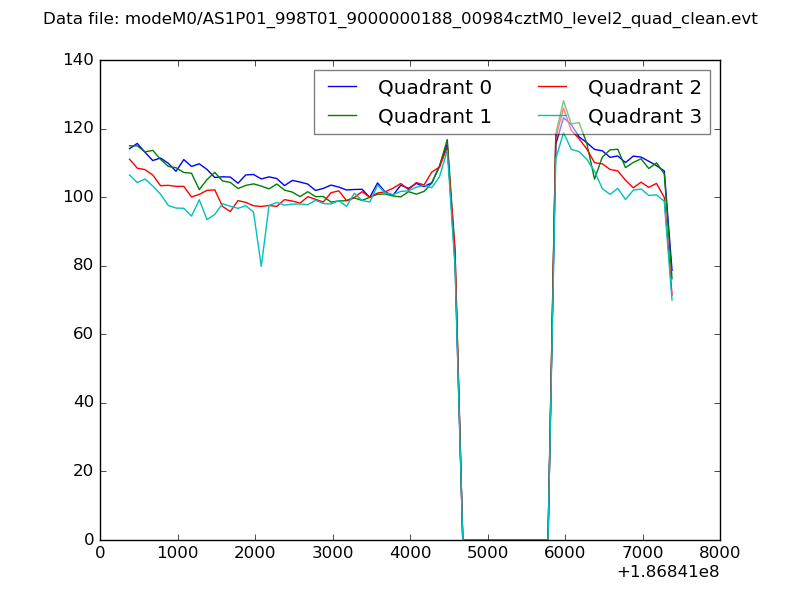 |
|
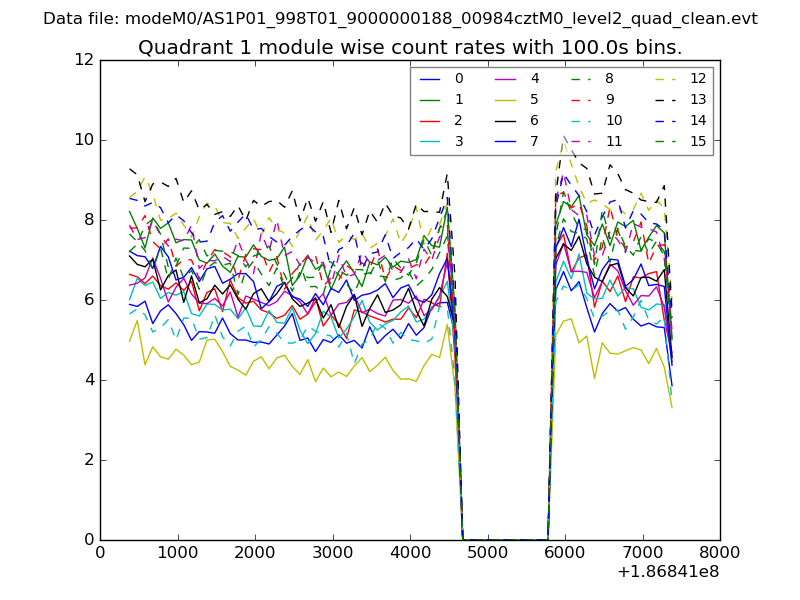
| Module-wise count rates for Quadrant A Data is divided into 100 sec bins |
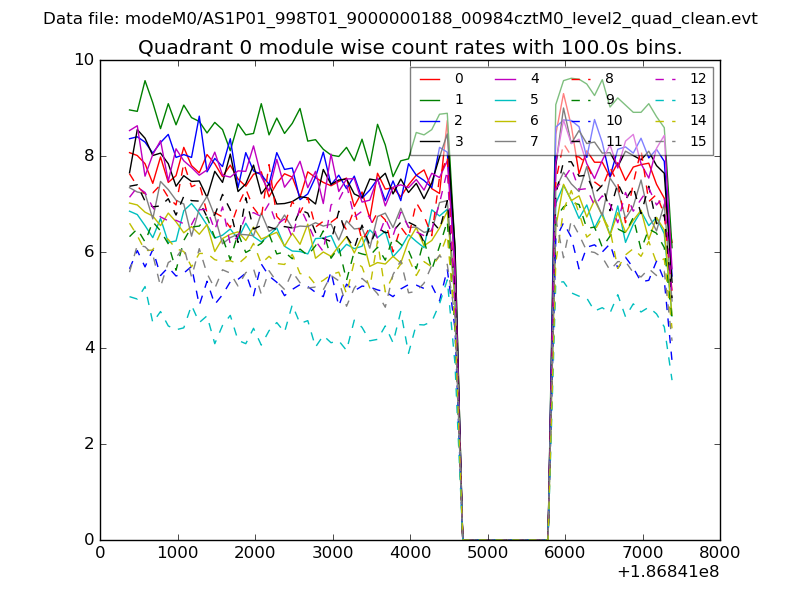 |
 |
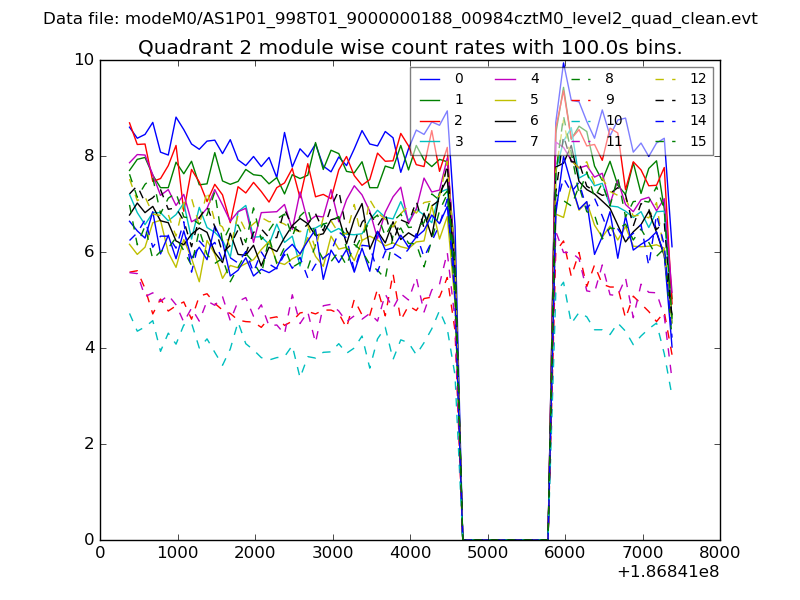
| Module-wise count rates for Quadrant B Data is divided into 100 sec bins |
 |
 |
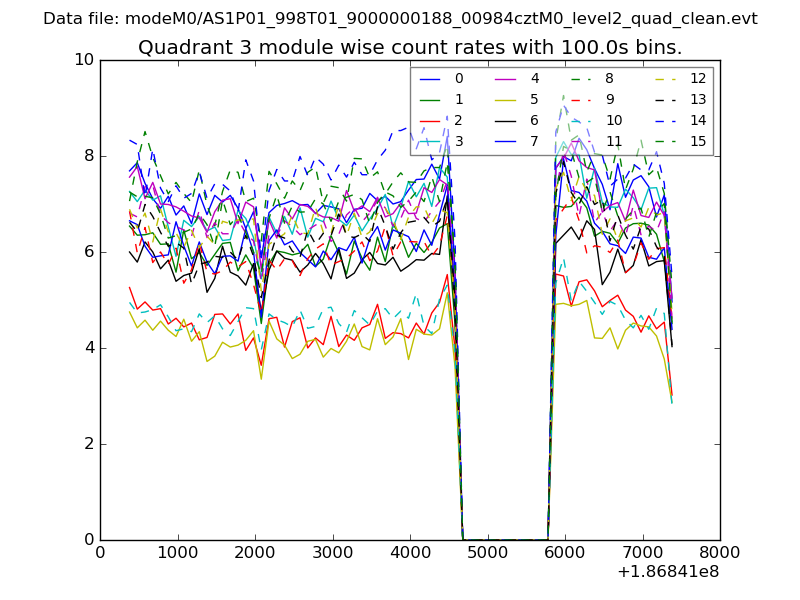
| Module-wise count rates for Quadrant C Data is divided into 100 sec bins |
 |
 |
| Module-wise count rates for Quadrant D Data is divided into 100 sec bins |
 |
 |
| Parameter | Plot |
|---|---|
| CZT HV Monitor | 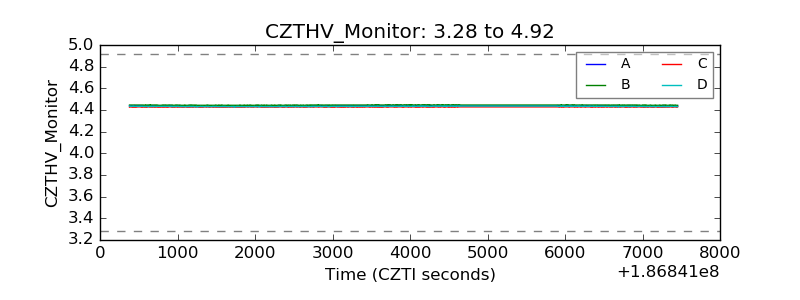 |
| D_VDD |  |
| Temperature 1 | 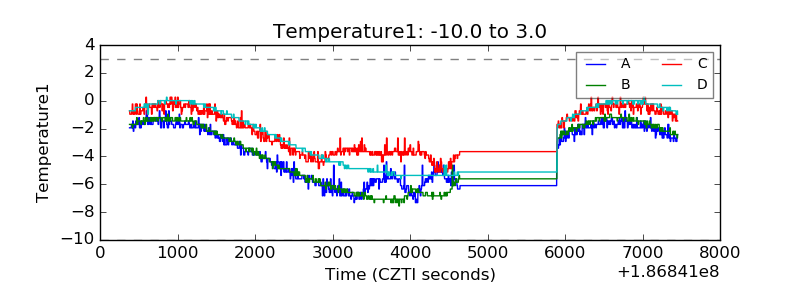 |
| Veto HV Monitor | 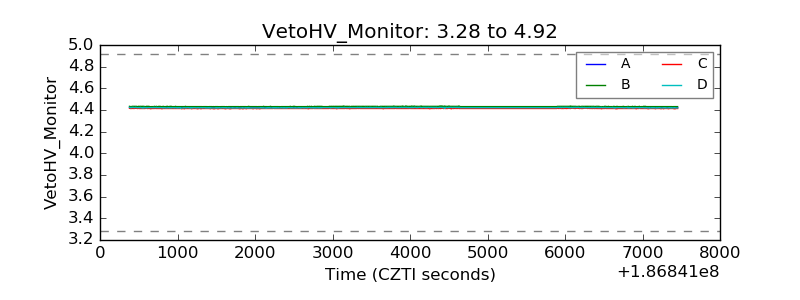 |
| Veto LLD | 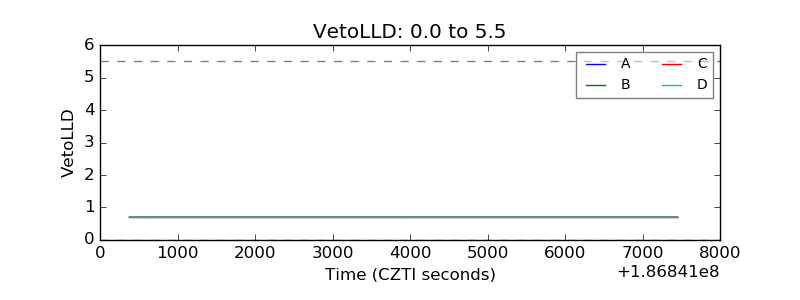 |
| Alpha Counter | 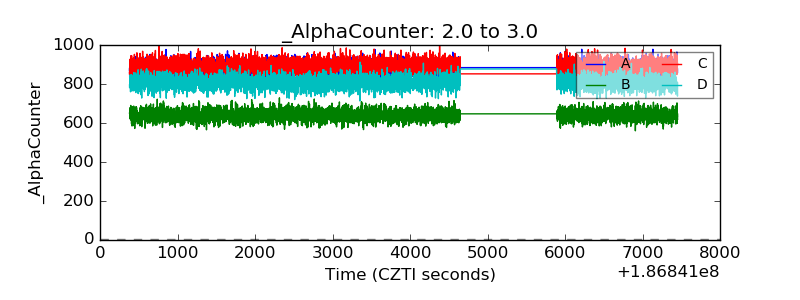 |
| _CPM_Rate | 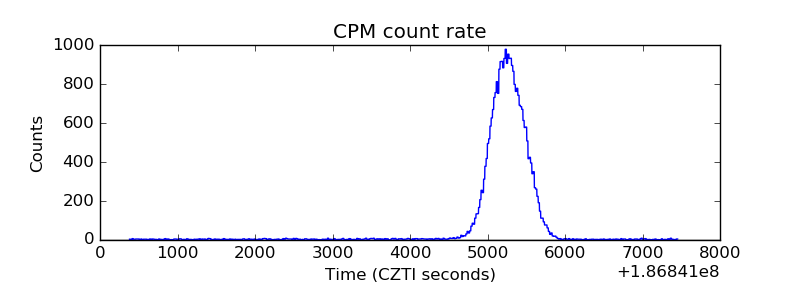 |
| CZT Counter | 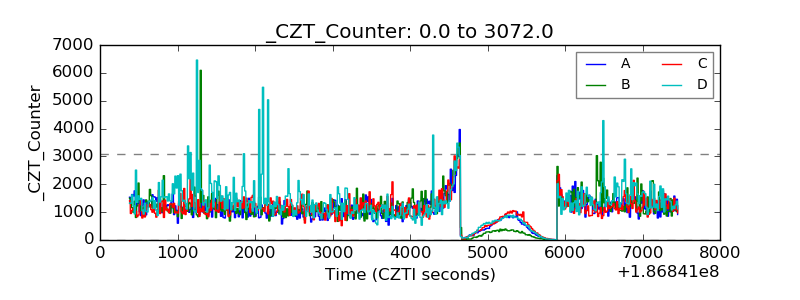 |
| +2.5 Volts monitor |  |
| +5 Volts monitor |  |
| _ROLL_ROT | 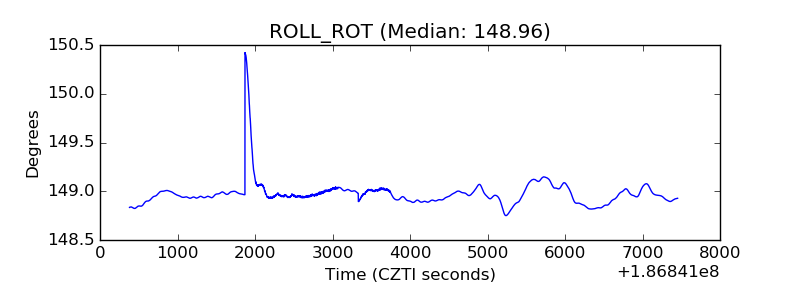 |
| _Roll_DEC | 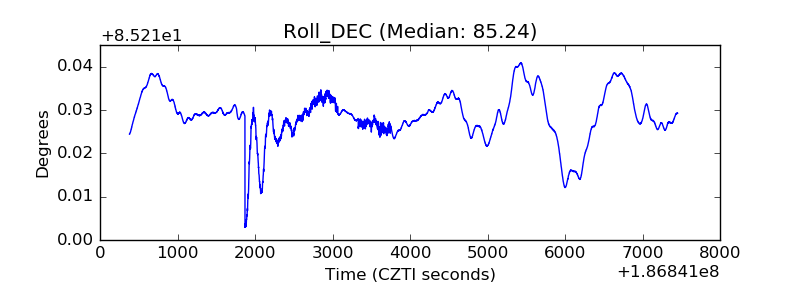 |
| _Roll_RA |  |
| Veto Counter | 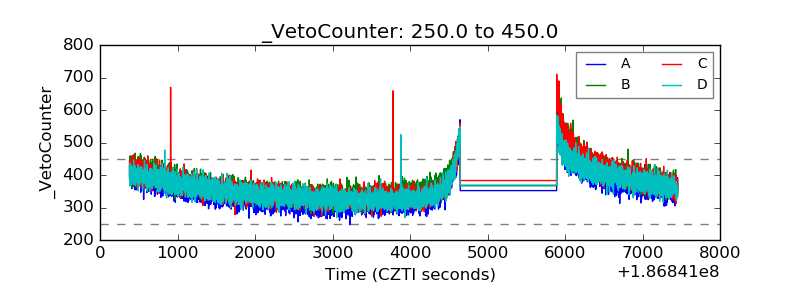 |