| Param | Original file | Final file |
|---|---|---|
| Filename | modeM0/AS1P01_998T01_9000000188_00985cztM0_level2.evt | modeM0/AS1P01_998T01_9000000188_00985cztM0_level2_quad_clean.evt |
| Size (bytes) | 1,036,477,440 | 96,877,440 |
| Size | 988.5 MB | 92.4 MB |
| Events in quadrant A | 7,253,523 | 643,271 |
| Events in quadrant B | 7,827,956 | 636,569 |
| Events in quadrant C | 7,573,871 | 621,749 |
| Events in quadrant D | 8,330,661 | 606,359 |
| Mode M0 | |||
|---|---|---|---|
| Quadrant | BADHDUFLAG | Total packets | Discarded packets |
| A | 0 | 25882 | 0 |
| B | 0 | 27583 | 0 |
| C | 0 | 26827 | 0 |
| D | 0 | 29090 | 0 |
| Mode M9 | |||
|---|---|---|---|
| Quadrant | BADHDUFLAG | Total packets | Discarded packets |
| A | 0 | 11 | 0 |
| B | 0 | 11 | 0 |
| C | 0 | 11 | 0 |
| D | 0 | 11 | 0 |
| Mode SS | |||
|---|---|---|---|
| Quadrant | BADHDUFLAG | Total packets | Discarded packets |
| A | 0 | 124 | 0 |
| B | 0 | 124 | 0 |
| C | 0 | 124 | 0 |
| D | 0 | 124 | 0 |
| Quadrant | Total seconds | Saturated seconds | Saturation percentage |
|---|---|---|---|
| A | 6101 | 30 | 0.491723% |
| B | 6101 | 66 | 1.081790% |
| C | 6102 | 36 | 0.589971% |
| D | 6102 | 102 | 1.671583% |
Noise dominated data is calculated using 1-second bins in cleaned event files. If a bin has >2000 counts, and if more than 50% of those come from <1% of pixels, then it is considered to be noise-dominated and hence unusable.
| Quadrant | # 1 sec bins | Bins with >0 counts | Bins with >2000 counts | High rate bins dominated by noise | Noise dominated (total time) | Noise dominated (detector-on time) | Marked lightcurve |
|---|---|---|---|---|---|---|---|
| A | 7266 | 6102 | 230 | 230 | 3.17% | 3.77% | 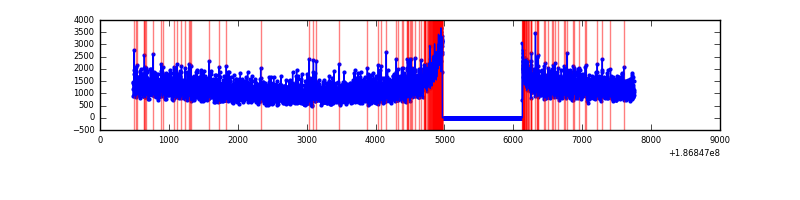 |
| B | 7266 | 6102 | 350 | 350 | 4.82% | 5.74% | 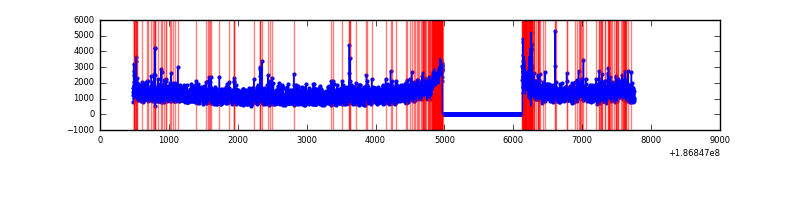 |
| C | 7267 | 6103 | 215 | 215 | 2.96% | 3.52% | 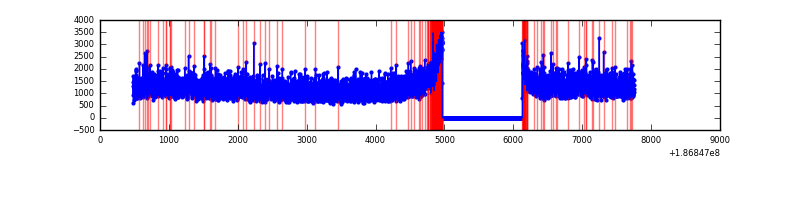 |
| D | 7267 | 6103 | 662 | 662 | 9.11% | 10.85% |  |
Top three noisy pixels from each quadrant. If the there are fewer than three noisy pixels in the level2.evt file, extra rows are filled as -1
| Pixel properties | Quadrant properties | ||||||
|---|---|---|---|---|---|---|---|
| Quadrant | DetID | PixID | Counts | Sigma | Mean | Median | Sigma |
| A | 10 | 133 | 27386 | 56.9 | 1877 | 1889 | 448.1 |
| A | 12 | 189 | 15239 | 29.79 | 1877 | 1889 | 448.1 |
| A | 11 | 79 | 8683 | 15.16 | 1877 | 1889 | 448.1 |
| B | 5 | 249 | 113688 | 245.69 | 1944 | 1948 | 454.8 |
| B | 8 | 38 | 80555 | 172.84 | 1944 | 1948 | 454.8 |
| B | 0 | 220 | 56262 | 119.43 | 1944 | 1948 | 454.8 |
| C | 15 | 241 | 347106 | 691.42 | 1807 | 1870 | 499.3 |
| C | 3 | 9 | 59177 | 114.77 | 1807 | 1870 | 499.3 |
| C | 3 | 79 | 36085 | 68.52 | 1807 | 1870 | 499.3 |
| D | 1 | 4 | 1184055 | 2191.28 | 1758 | 1819 | 539.5 |
| D | 12 | 188 | 353860 | 652.51 | 1758 | 1819 | 539.5 |
| D | 13 | 170 | 45008 | 80.05 | 1758 | 1819 | 539.5 |
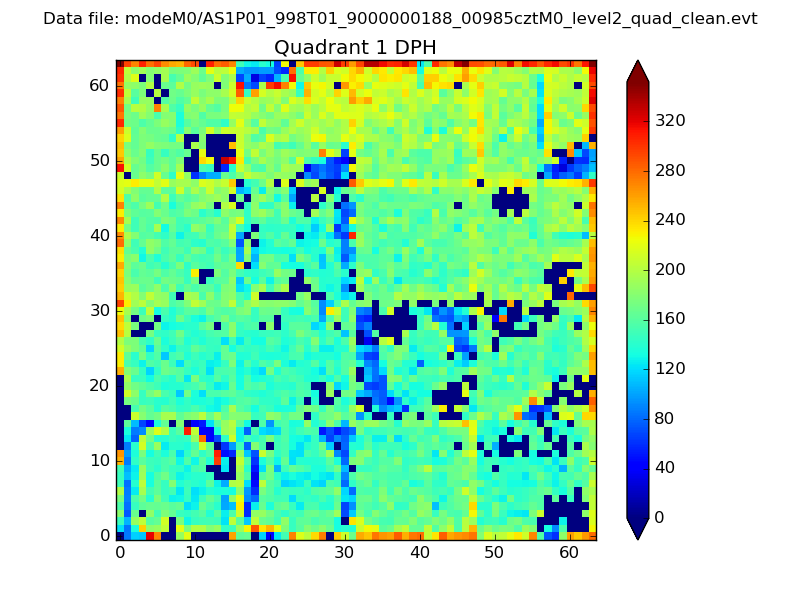
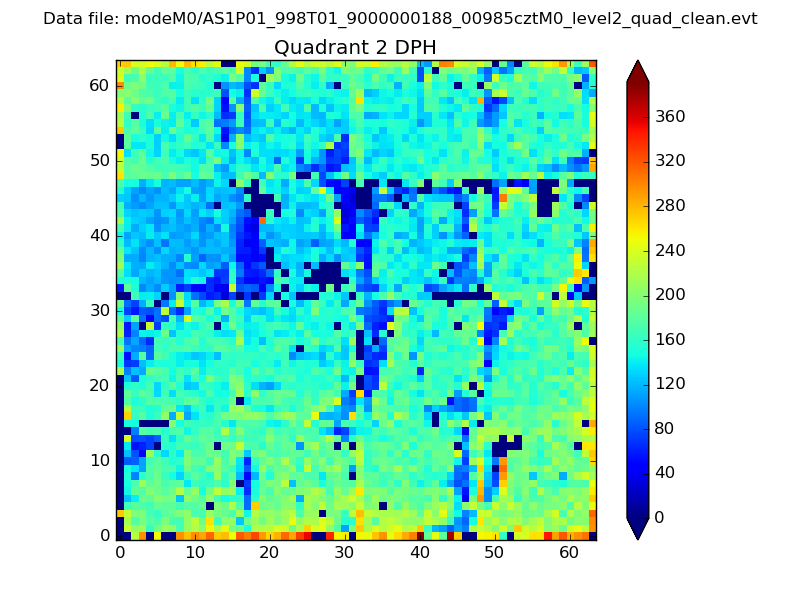
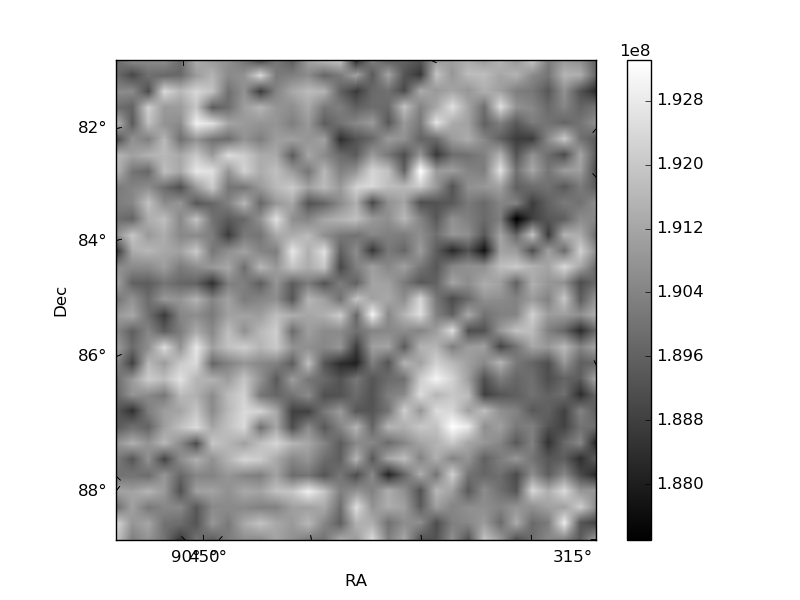
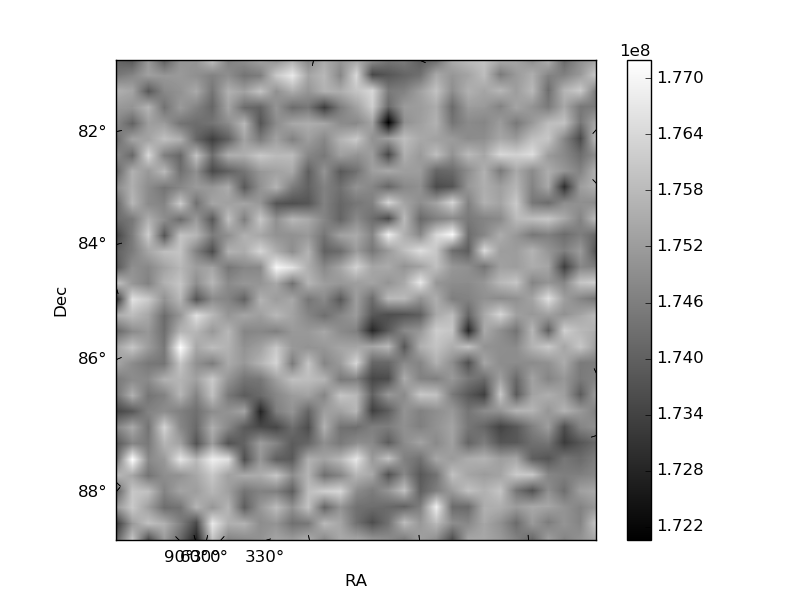
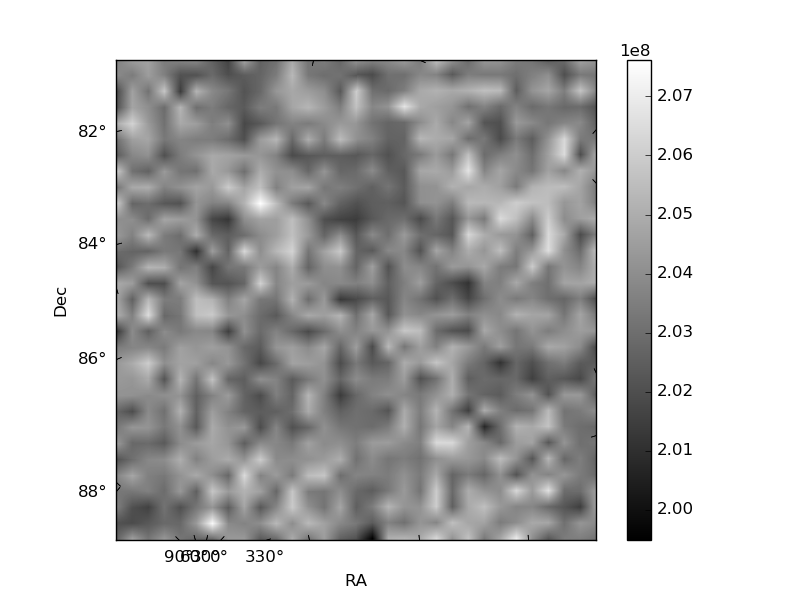
Histogram calculated using DETX and DETY for each event in the final _common_clean file
| Quadrant A | 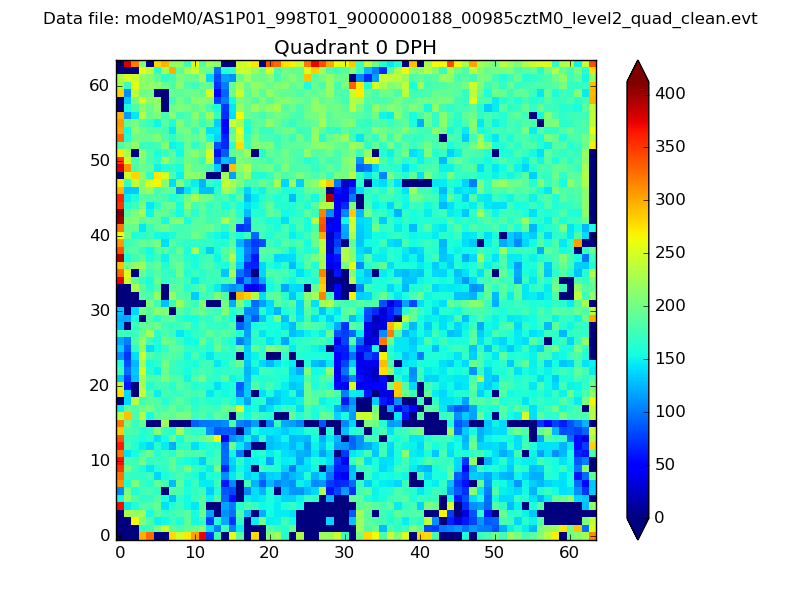 |
 |
Quadrant B |
|---|---|---|---|
| Quadrant D | 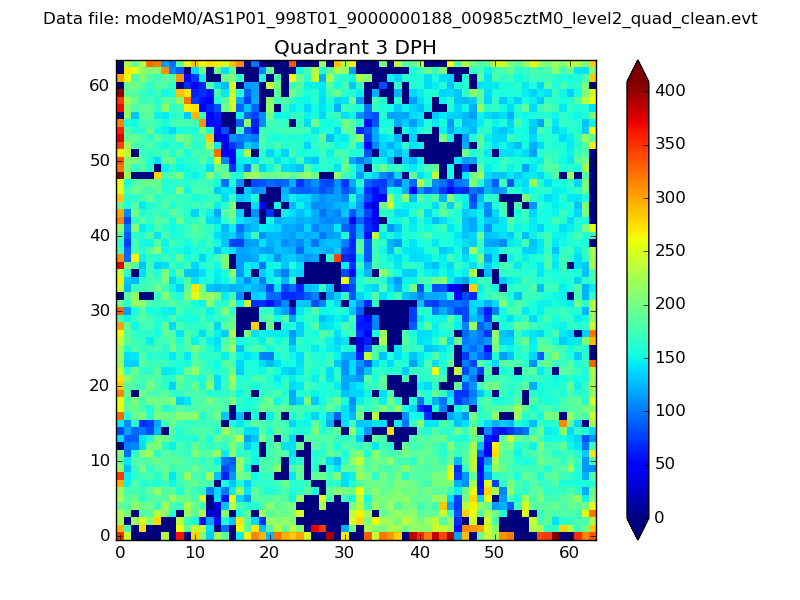 |
 |
Quadrant C |
| Plot type | Count rate plots | Images |
|---|---|---|
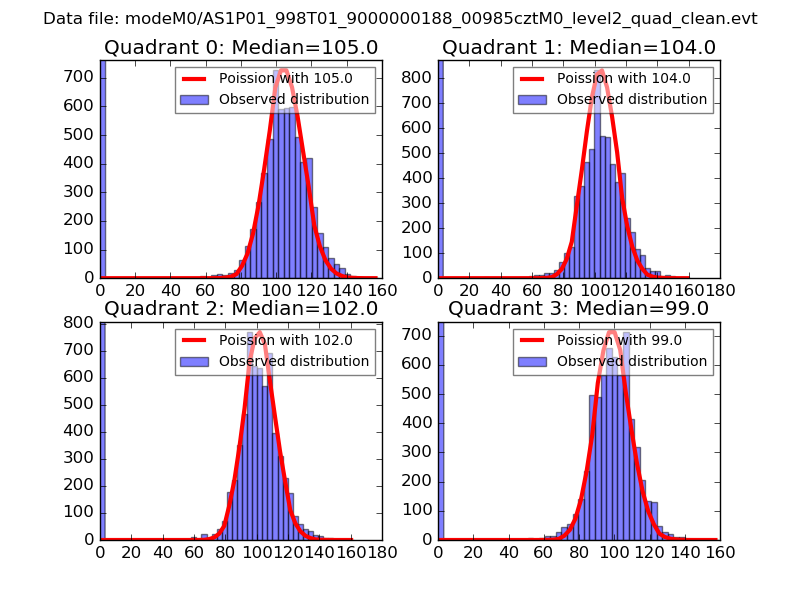
| Comparison with Poisson distribution Blue bars denote a histogram of data divided into 1 sec bins. Red curve is a Poisson curve with rate = median count rate of data. |
 |
 |
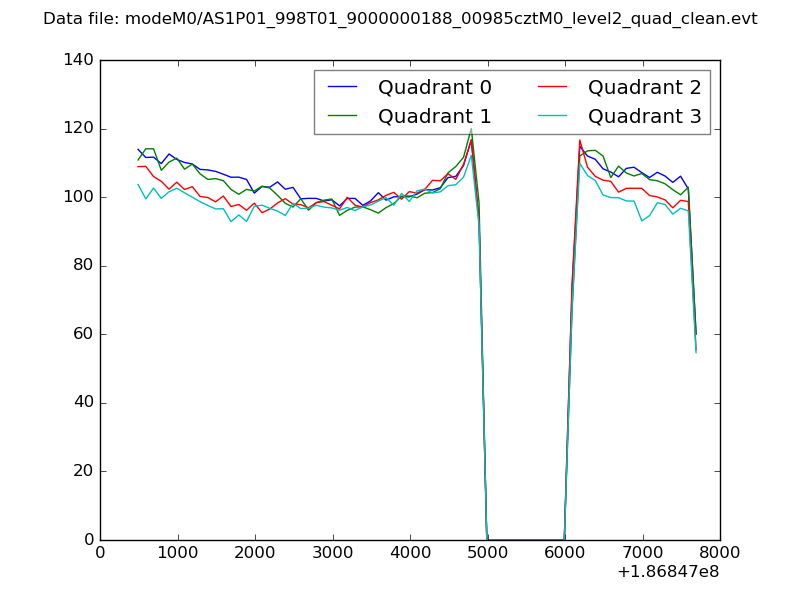
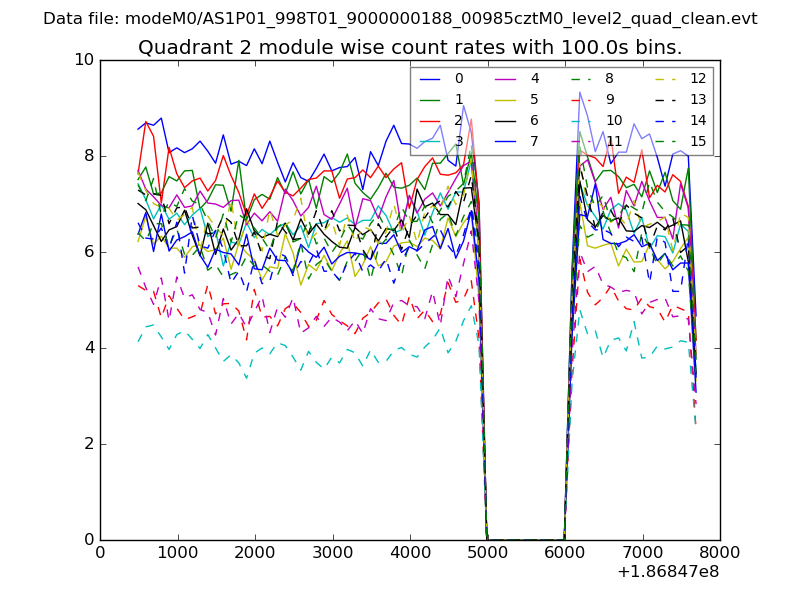
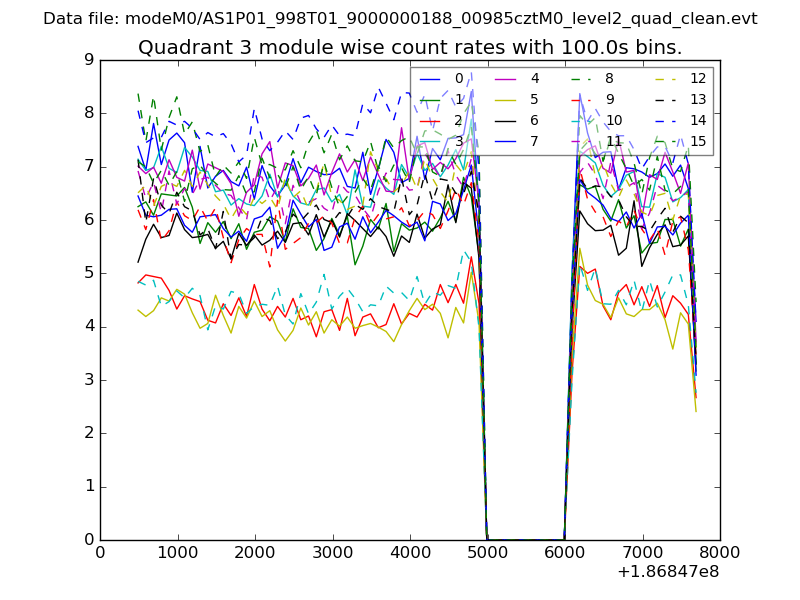
| Quadrant-wise count rates Data is divided into 100 sec bins |
 |
|
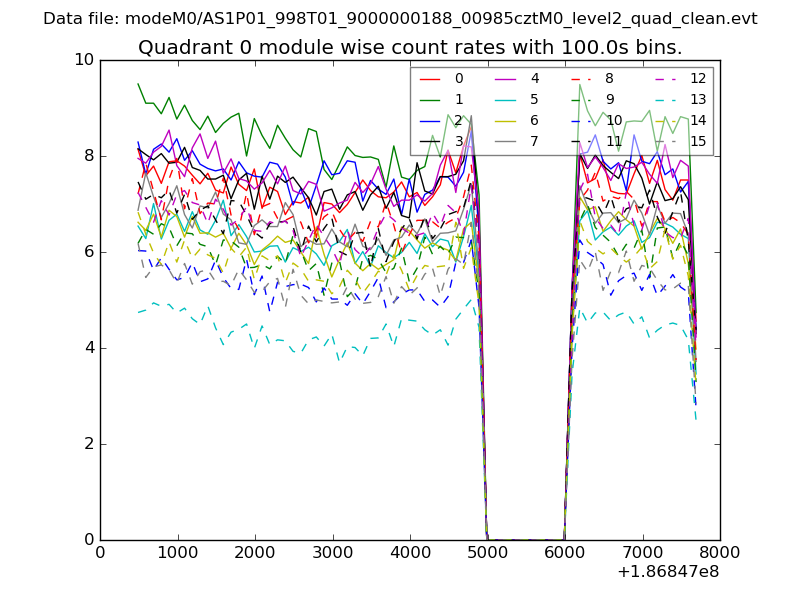
| Module-wise count rates for Quadrant A Data is divided into 100 sec bins |
 |
 |
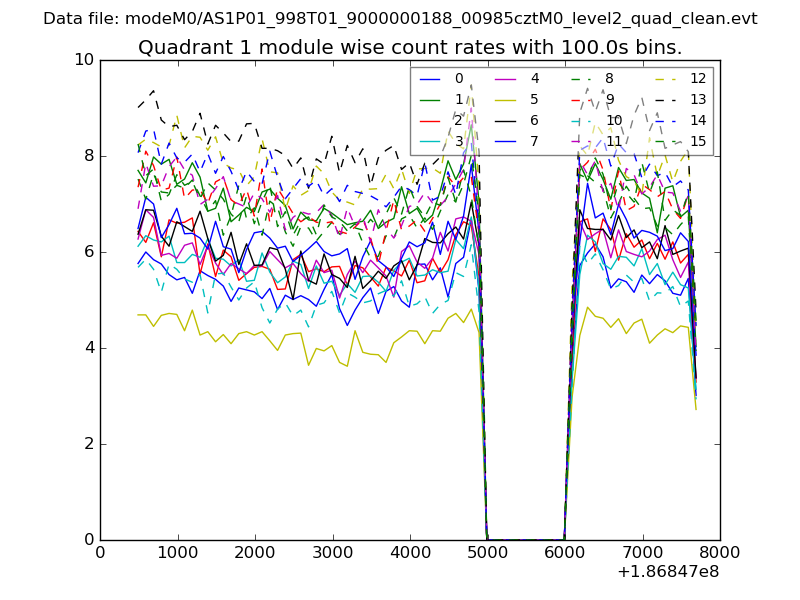
| Module-wise count rates for Quadrant B Data is divided into 100 sec bins |
 |
 |
| Module-wise count rates for Quadrant C Data is divided into 100 sec bins |
 |
 |
| Module-wise count rates for Quadrant D Data is divided into 100 sec bins |
 |
 |
| Parameter | Plot |
|---|---|
| CZT HV Monitor | 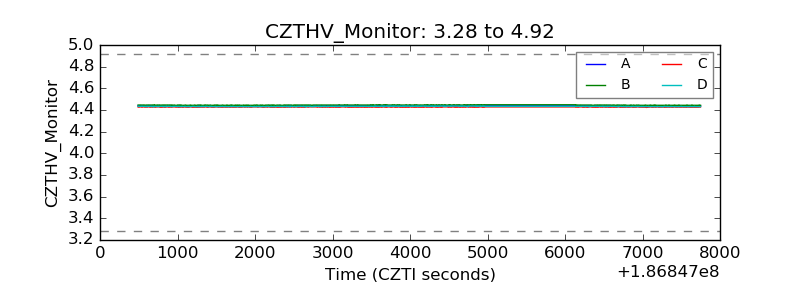 |
| D_VDD | 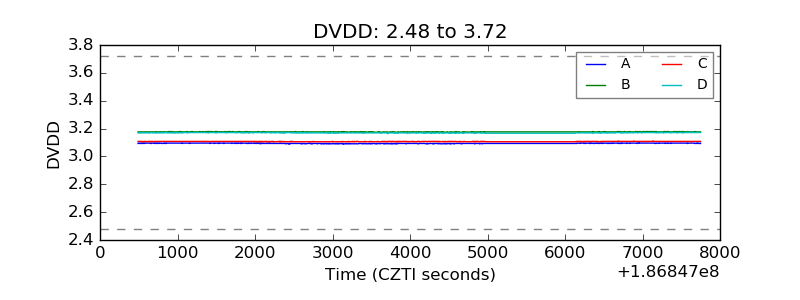 |
| Temperature 1 | 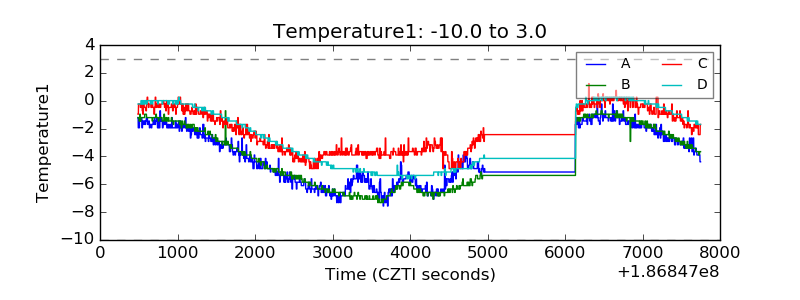 |
| Veto HV Monitor | 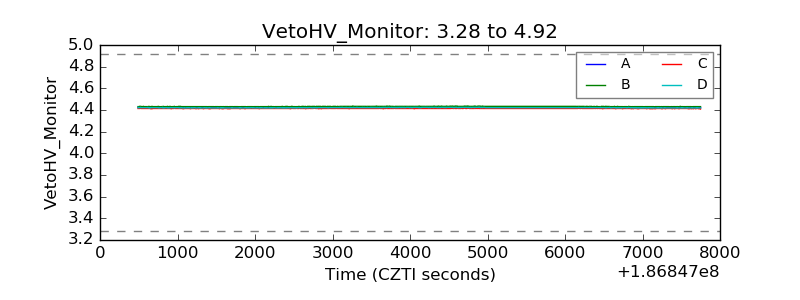 |
| Veto LLD | 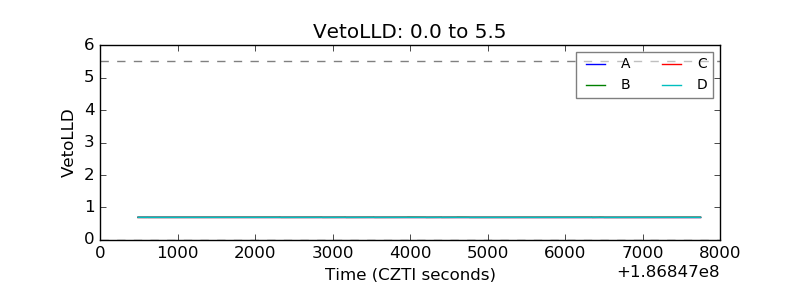 |
| Alpha Counter | 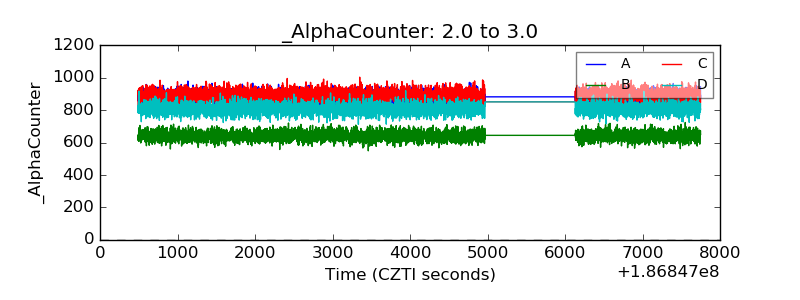 |
| _CPM_Rate | 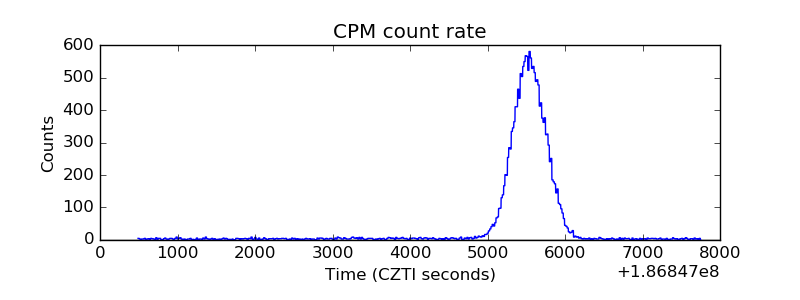 |
| CZT Counter | 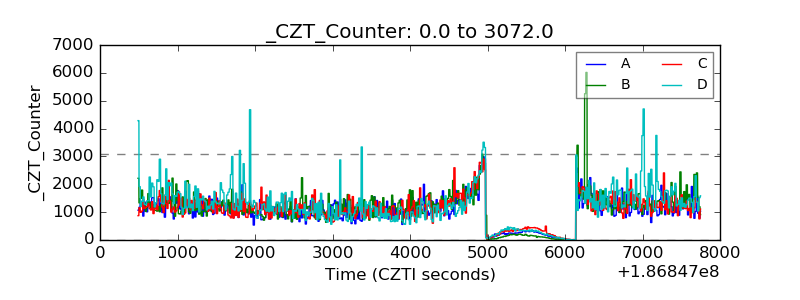 |
| +2.5 Volts monitor |  |
| +5 Volts monitor |  |
| _ROLL_ROT | 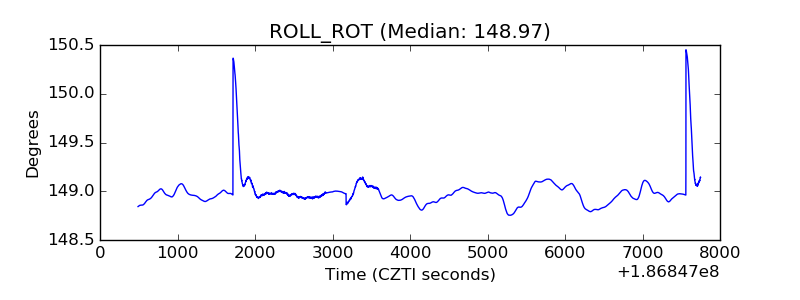 |
| _Roll_DEC | 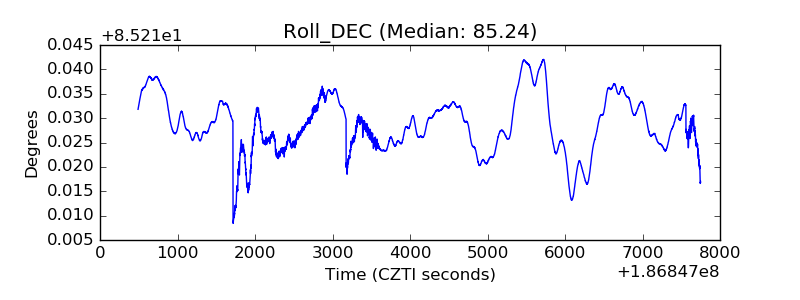 |
| _Roll_RA |  |
| Veto Counter | 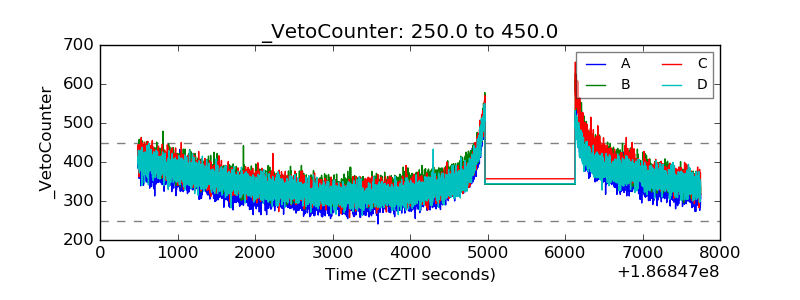 |