| Param | Original file | Final file |
|---|---|---|
| Filename | modeM0/AS1P01_998T01_9000000188_00986cztM0_level2.evt | modeM0/AS1P01_998T01_9000000188_00986cztM0_level2_quad_clean.evt |
| Size (bytes) | 1,026,910,080 | 93,484,800 |
| Size | 979.3 MB | 89.2 MB |
| Events in quadrant A | 6,982,979 | 621,567 |
| Events in quadrant B | 7,576,794 | 615,761 |
| Events in quadrant C | 7,296,320 | 601,024 |
| Events in quadrant D | 8,839,999 | 566,905 |
| Mode M0 | |||
|---|---|---|---|
| Quadrant | BADHDUFLAG | Total packets | Discarded packets |
| A | 0 | 25064 | 0 |
| B | 0 | 26856 | 0 |
| C | 0 | 25992 | 0 |
| D | 0 | 30674 | 0 |
| Mode M9 | |||
|---|---|---|---|
| Quadrant | BADHDUFLAG | Total packets | Discarded packets |
| A | 0 | 11 | 0 |
| B | 0 | 11 | 0 |
| C | 0 | 11 | 0 |
| D | 0 | 11 | 0 |
| Mode SS | |||
|---|---|---|---|
| Quadrant | BADHDUFLAG | Total packets | Discarded packets |
| A | 0 | 122 | 0 |
| B | 0 | 122 | 0 |
| C | 0 | 122 | 0 |
| D | 0 | 122 | 0 |
| Quadrant | Total seconds | Saturated seconds | Saturation percentage |
|---|---|---|---|
| A | 6104 | 2 | 0.032765% |
| B | 6104 | 16 | 0.262123% |
| C | 6103 | 7 | 0.114698% |
| D | 6103 | 341 | 5.587416% |
Noise dominated data is calculated using 1-second bins in cleaned event files. If a bin has >2000 counts, and if more than 50% of those come from <1% of pixels, then it is considered to be noise-dominated and hence unusable.
| Quadrant | # 1 sec bins | Bins with >0 counts | Bins with >2000 counts | High rate bins dominated by noise | Noise dominated (total time) | Noise dominated (detector-on time) | Marked lightcurve |
|---|---|---|---|---|---|---|---|
| A | 7159 | 6105 | 102 | 102 | 1.42% | 1.67% | 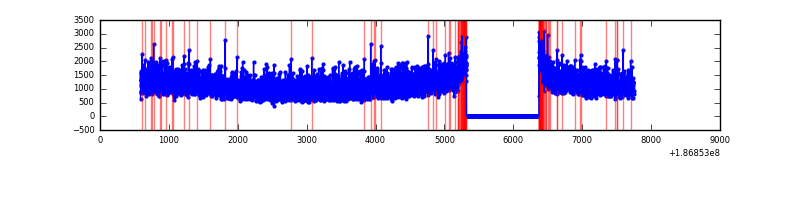 |
| B | 7159 | 6105 | 225 | 225 | 3.14% | 3.69% | 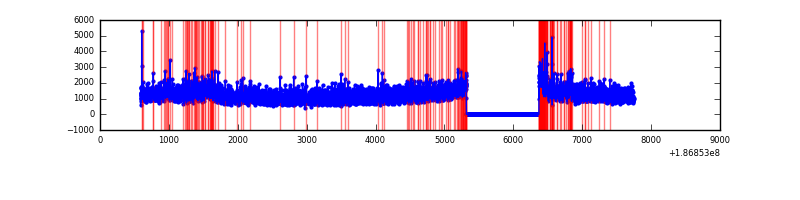 |
| C | 7158 | 6104 | 136 | 136 | 1.90% | 2.23% | 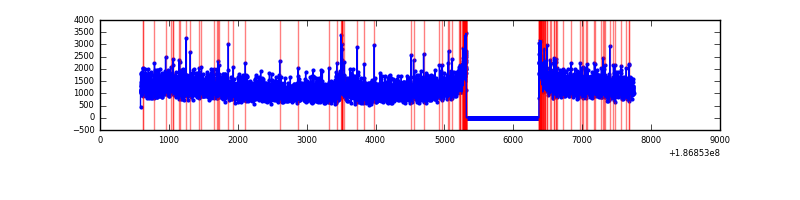 |
| D | 7157 | 6103 | 1043 | 1043 | 14.57% | 17.09% | 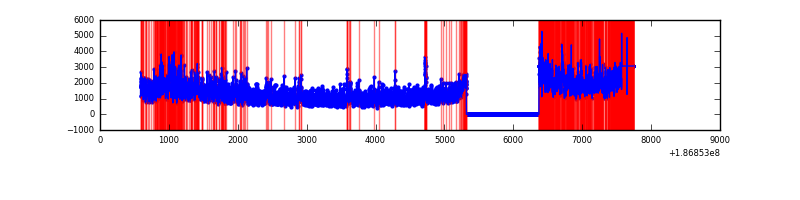 |
Top three noisy pixels from each quadrant. If the there are fewer than three noisy pixels in the level2.evt file, extra rows are filled as -1
| Pixel properties | Quadrant properties | ||||||
|---|---|---|---|---|---|---|---|
| Quadrant | DetID | PixID | Counts | Sigma | Mean | Median | Sigma |
| A | 11 | 242 | 9797 | 18.37 | 1813 | 1821 | 434.1 |
| A | 12 | 189 | 8778 | 16.02 | 1813 | 1821 | 434.1 |
| A | 11 | 79 | 7988 | 14.2 | 1813 | 1821 | 434.1 |
| B | 8 | 234 | 85909 | 189.18 | 1904 | 1911 | 444.0 |
| B | 8 | 38 | 81654 | 179.59 | 1904 | 1911 | 444.0 |
| B | 7 | 221 | 61669 | 134.58 | 1904 | 1911 | 444.0 |
| C | 15 | 241 | 260682 | 532.22 | 1761 | 1821 | 486.4 |
| C | 9 | 52 | 90734 | 182.8 | 1761 | 1821 | 486.4 |
| C | 3 | 79 | 39165 | 76.78 | 1761 | 1821 | 486.4 |
| D | 1 | 4 | 1297282 | 2567.9 | 1643 | 1707 | 504.5 |
| D | 12 | 188 | 1168092 | 2311.84 | 1643 | 1707 | 504.5 |
| D | 13 | 85 | 35090 | 66.17 | 1643 | 1707 | 504.5 |
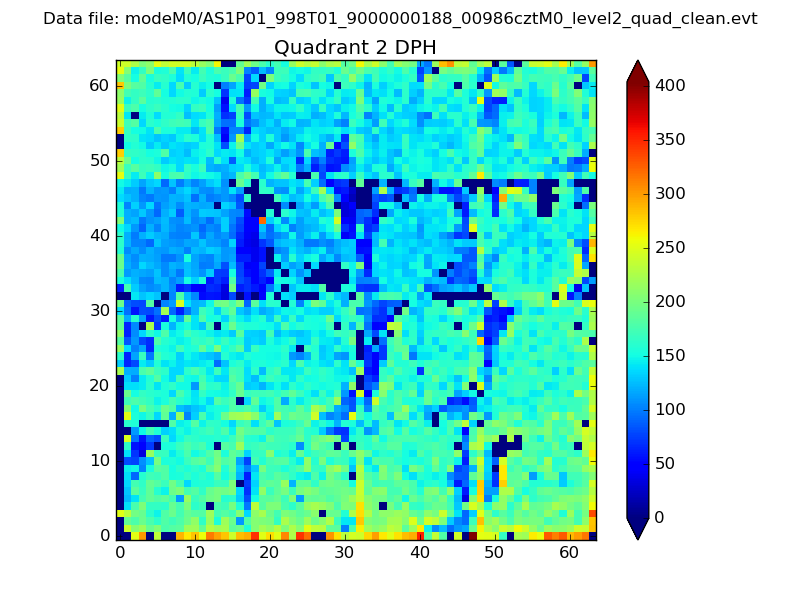
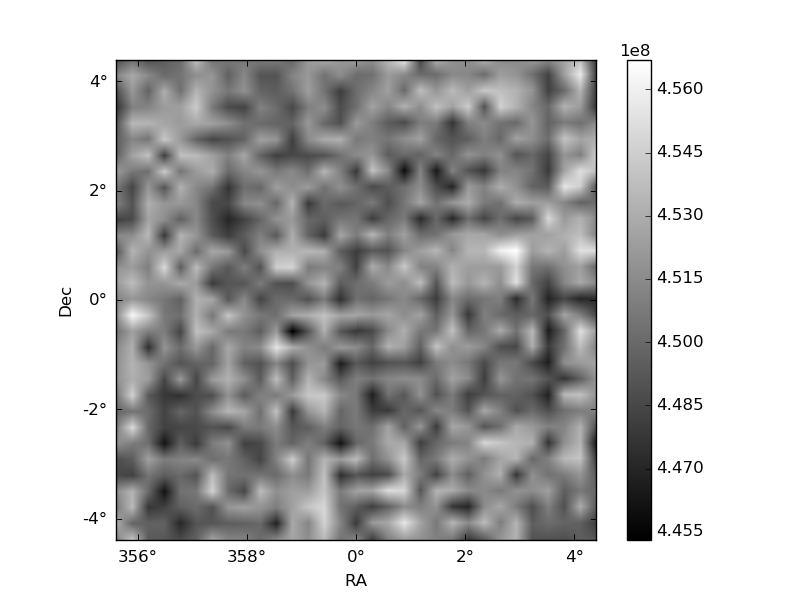
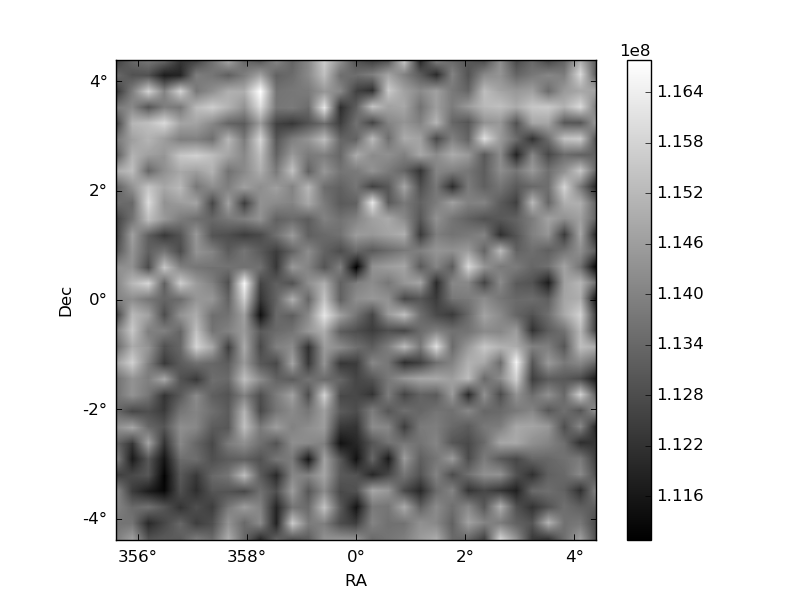
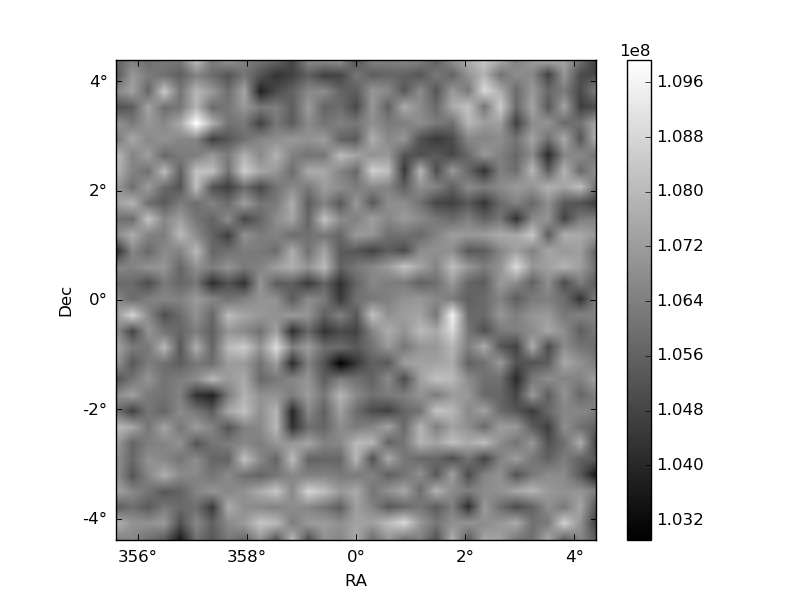
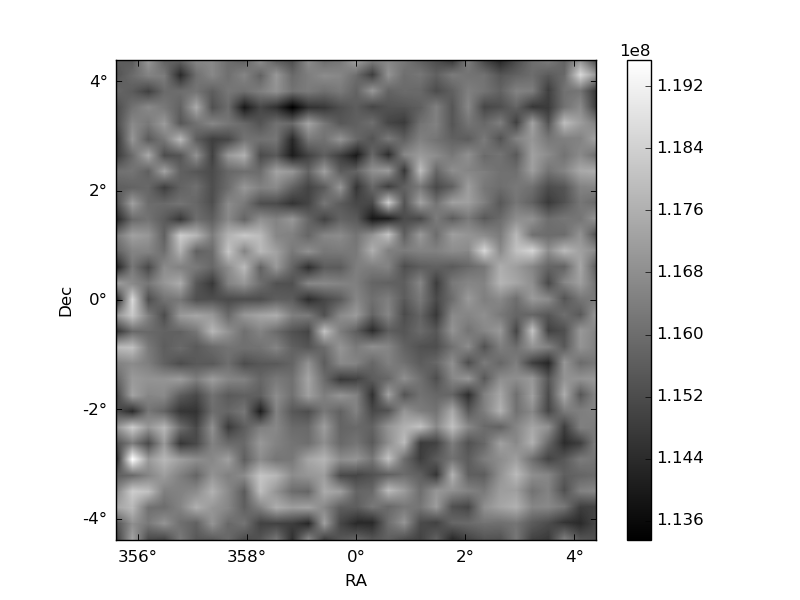
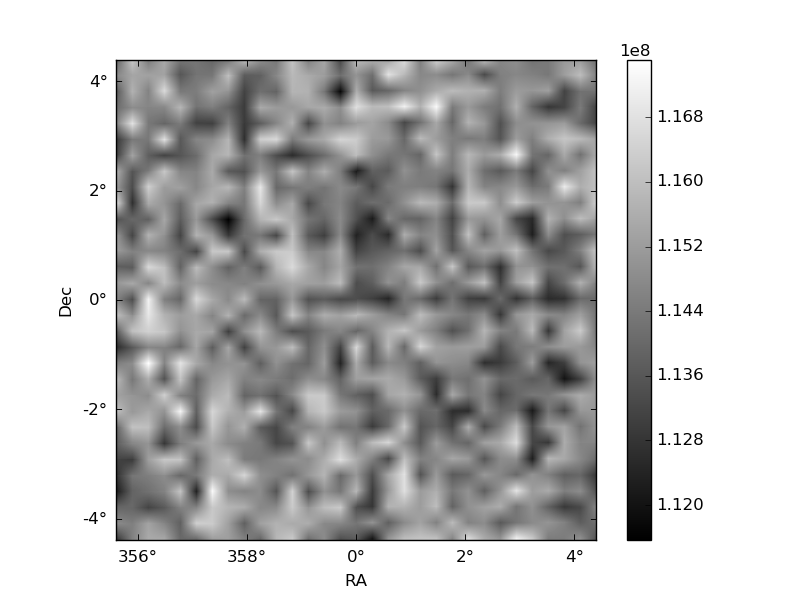
Histogram calculated using DETX and DETY for each event in the final _common_clean file
| Quadrant A | 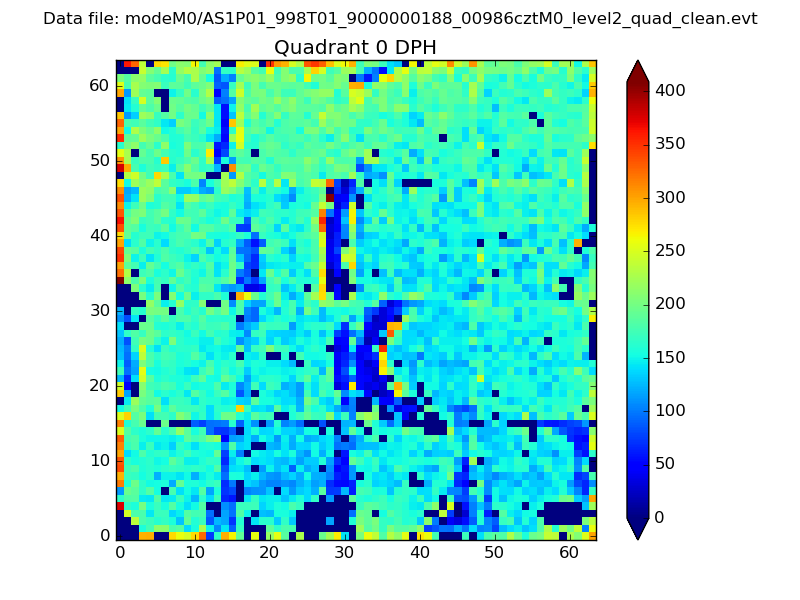 |
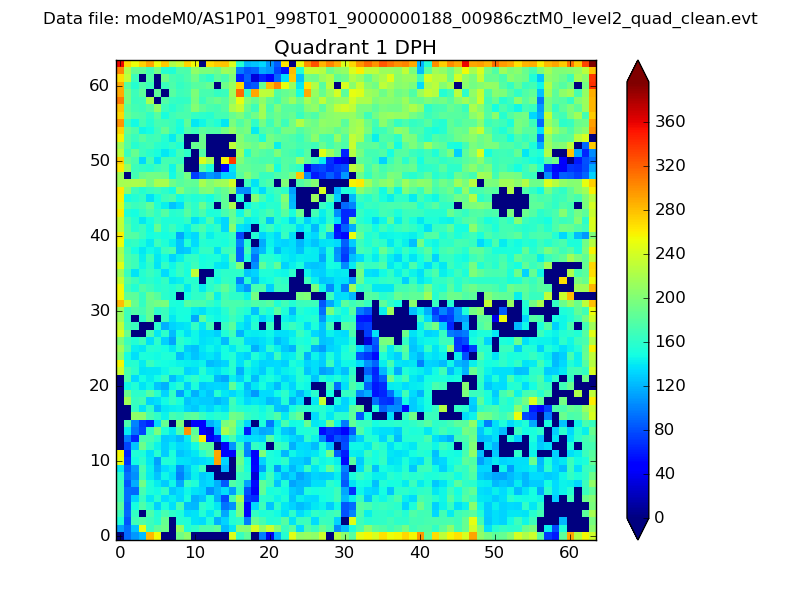 |
Quadrant B |
|---|---|---|---|
| Quadrant D | 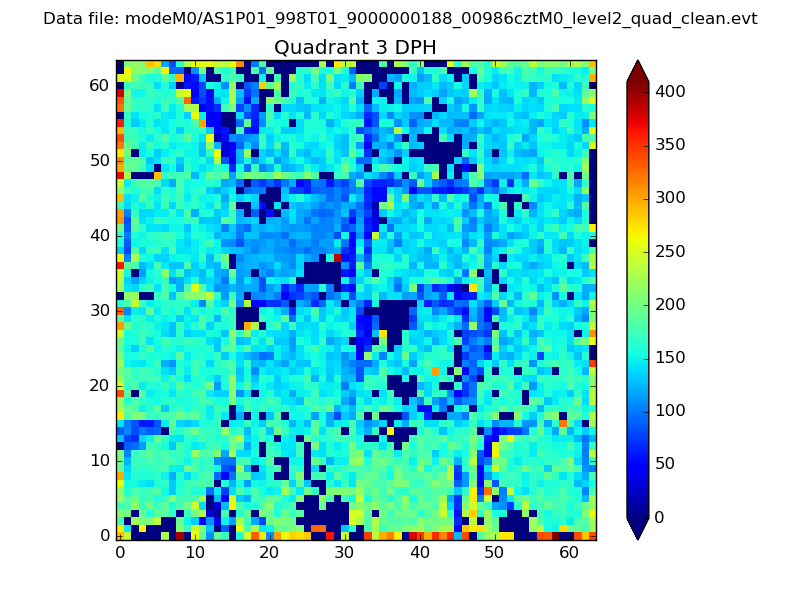 |
 |
Quadrant C |
| Plot type | Count rate plots | Images |
|---|---|---|
| Comparison with Poisson distribution Blue bars denote a histogram of data divided into 1 sec bins. Red curve is a Poisson curve with rate = median count rate of data. |
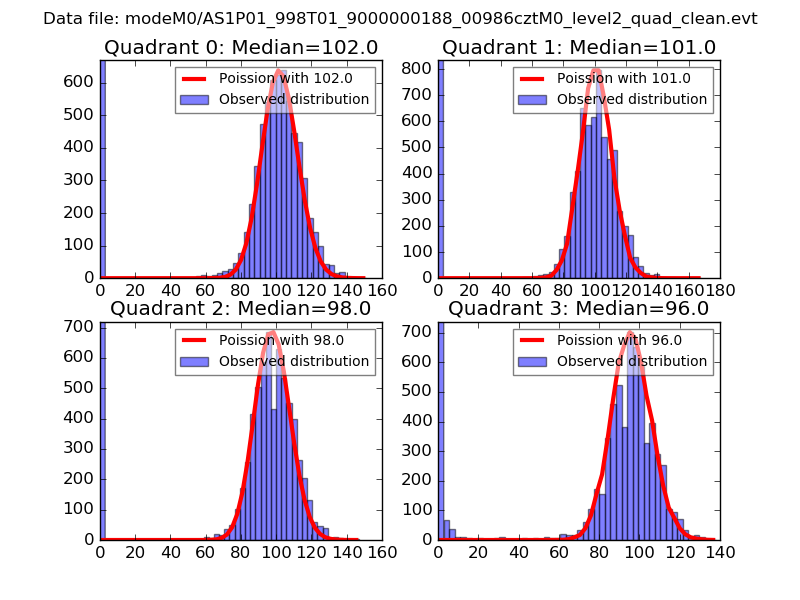 |
 |
| Quadrant-wise count rates Data is divided into 100 sec bins |
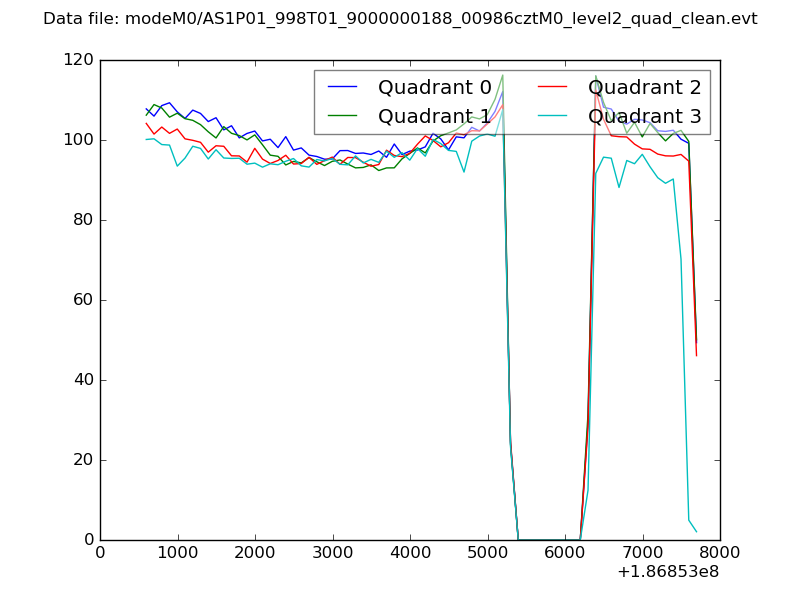 |
|
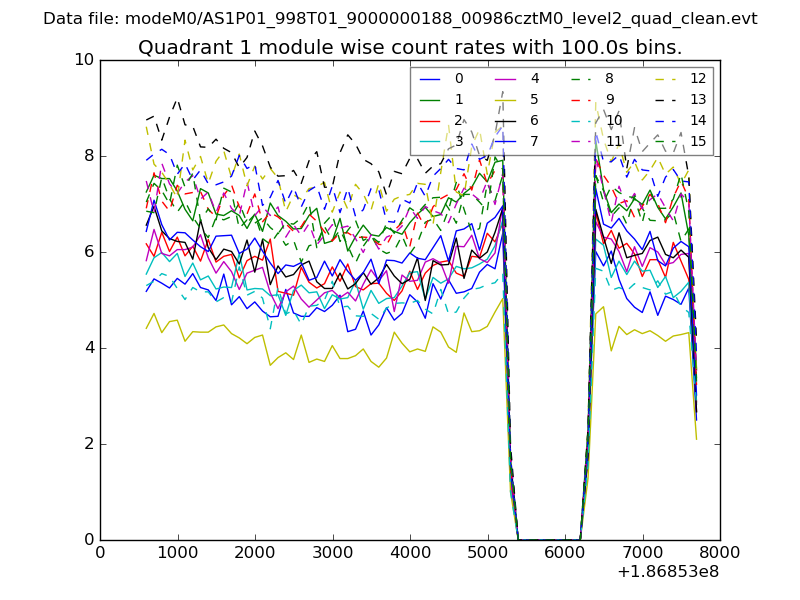
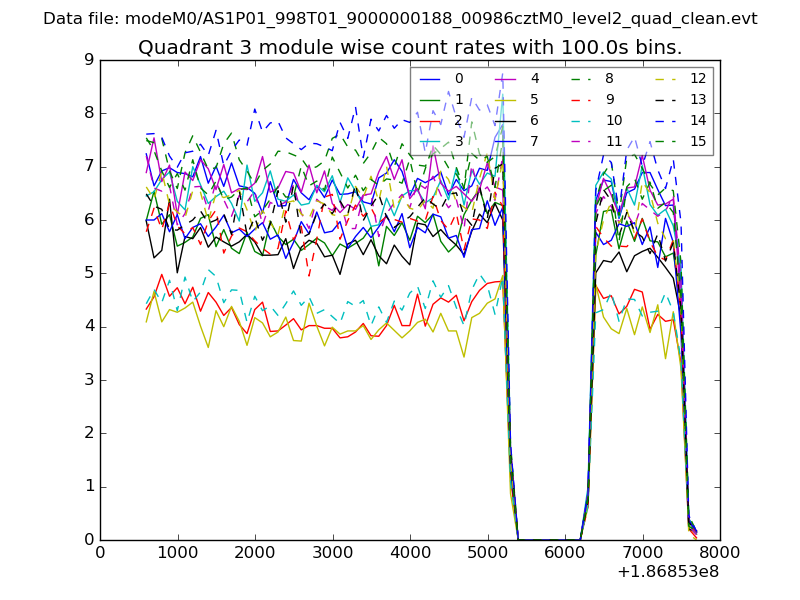
| Module-wise count rates for Quadrant A Data is divided into 100 sec bins |
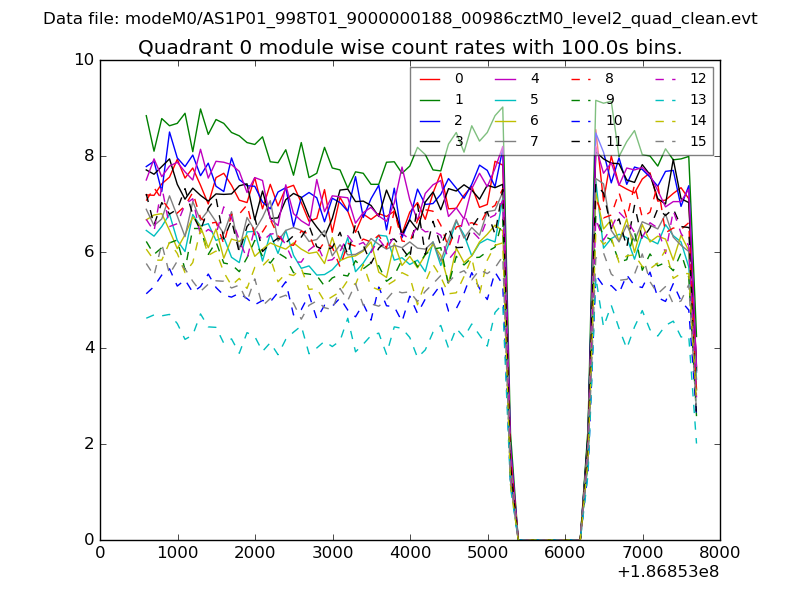 |
 |
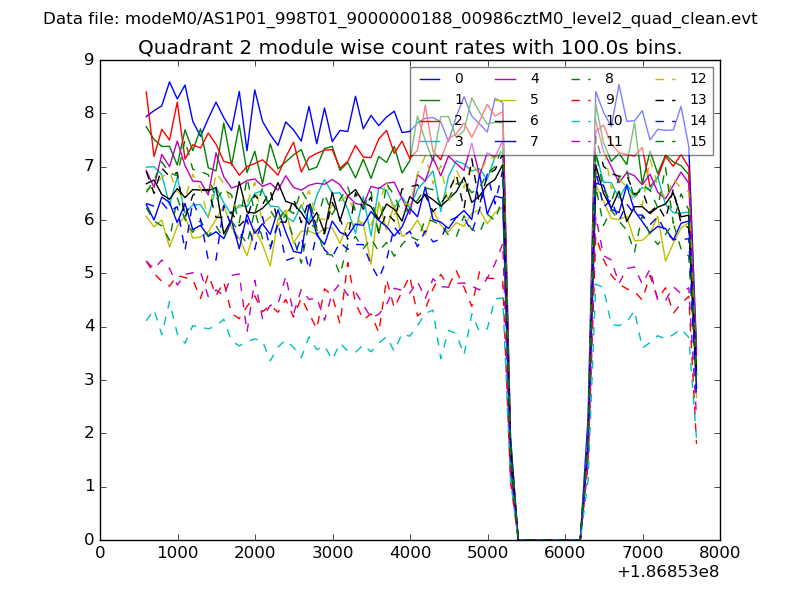
| Module-wise count rates for Quadrant B Data is divided into 100 sec bins |
 |
 |
| Module-wise count rates for Quadrant C Data is divided into 100 sec bins |
 |
 |
| Module-wise count rates for Quadrant D Data is divided into 100 sec bins |
 |
 |
| Parameter | Plot |
|---|---|
| CZT HV Monitor | 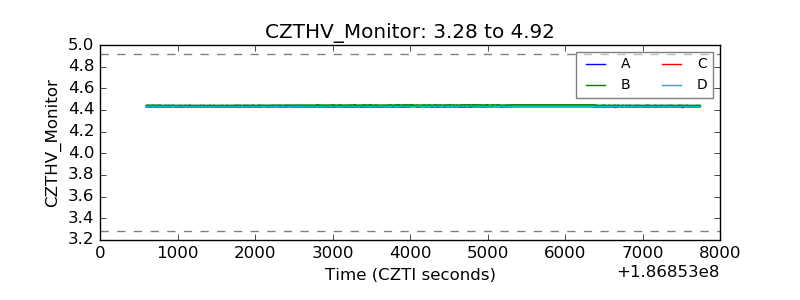 |
| D_VDD | 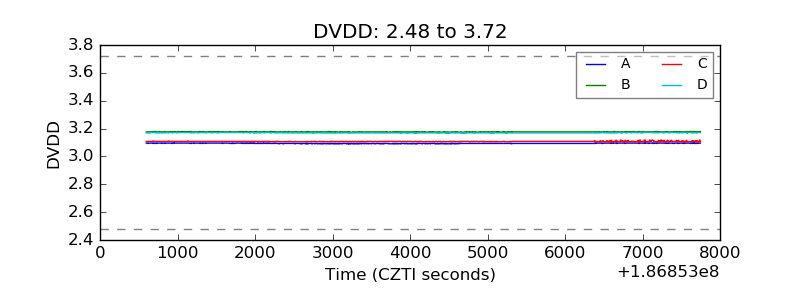 |
| Temperature 1 | 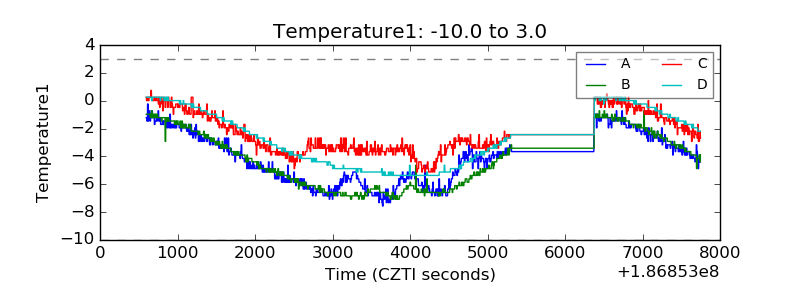 |
| Veto HV Monitor | 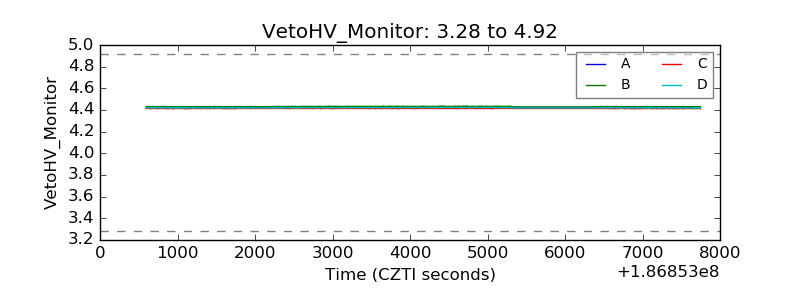 |
| Veto LLD | 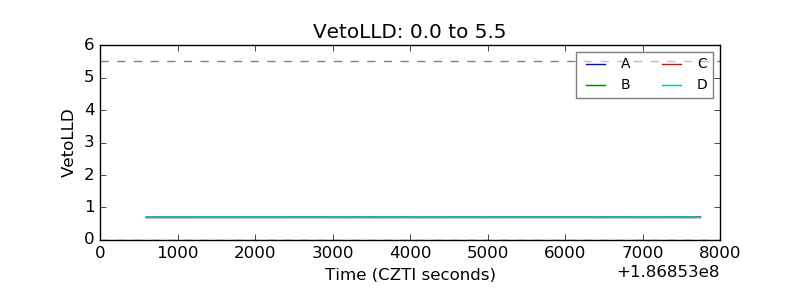 |
| Alpha Counter | 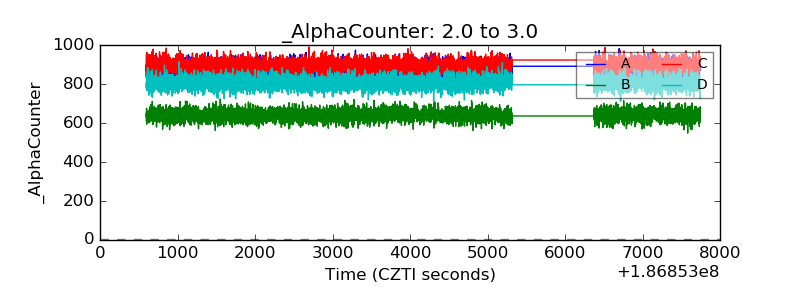 |
| _CPM_Rate | 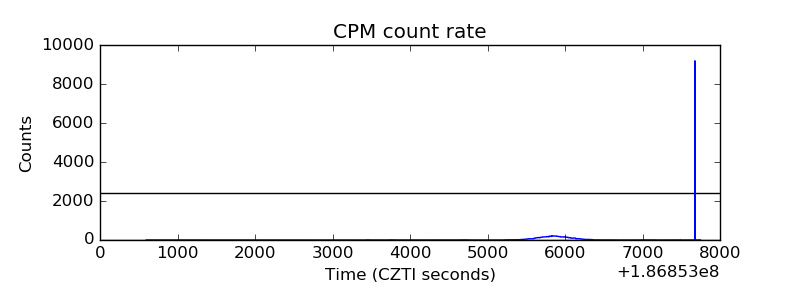 |
| CZT Counter | 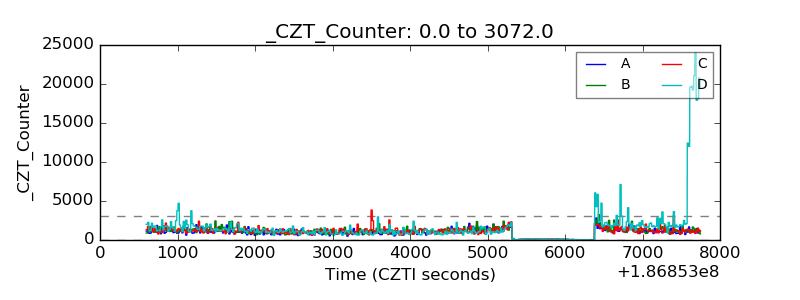 |
| +2.5 Volts monitor |  |
| +5 Volts monitor |  |
| _ROLL_ROT | 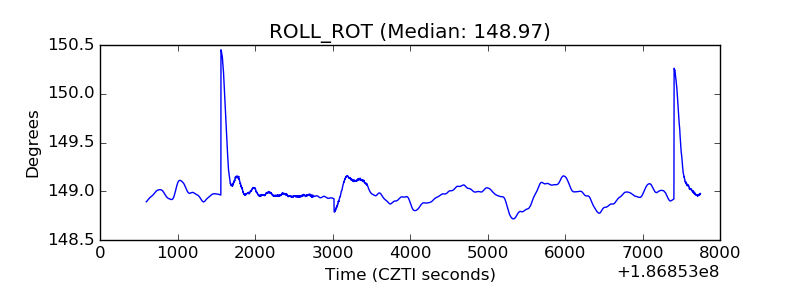 |
| _Roll_DEC | 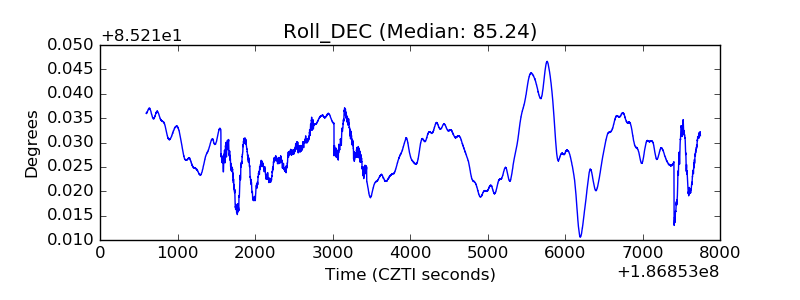 |
| _Roll_RA | 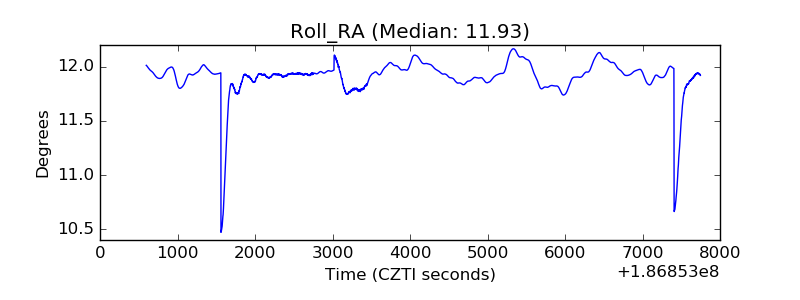 |
| Veto Counter | 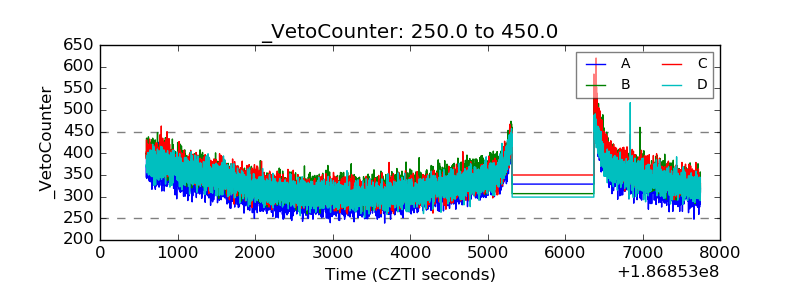 |