| Param | Original file | Final file |
|---|---|---|
| Filename | modeM0/AS1P01_998T01_9000000188_00990cztM0_level2.evt | modeM0/AS1P01_998T01_9000000188_00990cztM0_level2_quad_clean.evt |
| Size (bytes) | 1,597,204,800 | 108,293,760 |
| Size | 1.5 GB | 103.3 MB |
| Events in quadrant A | 9,093,755 | 749,901 |
| Events in quadrant B | 9,911,865 | 750,036 |
| Events in quadrant C | 9,364,010 | 739,650 |
| Events in quadrant D | 19,493,501 | 501,504 |
| Mode M0 | |||
|---|---|---|---|
| Quadrant | BADHDUFLAG | Total packets | Discarded packets |
| A | 0 | 32428 | 0 |
| B | 0 | 34865 | 0 |
| C | 0 | 33249 | 0 |
| D | 0 | 64012 | 0 |
| Mode M9 | |||
|---|---|---|---|
| Quadrant | BADHDUFLAG | Total packets | Discarded packets |
| A | 0 | 5 | 0 |
| B | 0 | 5 | 0 |
| C | 0 | 5 | 0 |
| D | 0 | 5 | 0 |
| Mode SS | |||
|---|---|---|---|
| Quadrant | BADHDUFLAG | Total packets | Discarded packets |
| A | 0 | 158 | 0 |
| B | 0 | 158 | 0 |
| C | 0 | 158 | 0 |
| D | 0 | 158 | 0 |
| Quadrant | Total seconds | Saturated seconds | Saturation percentage |
|---|---|---|---|
| A | 7716 | 9 | 0.116641% |
| B | 7716 | 38 | 0.492483% |
| C | 7720 | 11 | 0.142487% |
| D | 7719 | 4042 | 52.364296% |
Noise dominated data is calculated using 1-second bins in cleaned event files. If a bin has >2000 counts, and if more than 50% of those come from <1% of pixels, then it is considered to be noise-dominated and hence unusable.
| Quadrant | # 1 sec bins | Bins with >0 counts | Bins with >2000 counts | High rate bins dominated by noise | Noise dominated (total time) | Noise dominated (detector-on time) | Marked lightcurve |
|---|---|---|---|---|---|---|---|
| A | 8187 | 7722 | 261 | 261 | 3.19% | 3.38% | 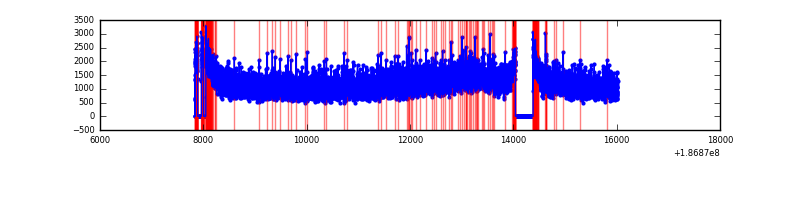 |
| B | 8186 | 7723 | 472 | 472 | 5.77% | 6.11% | 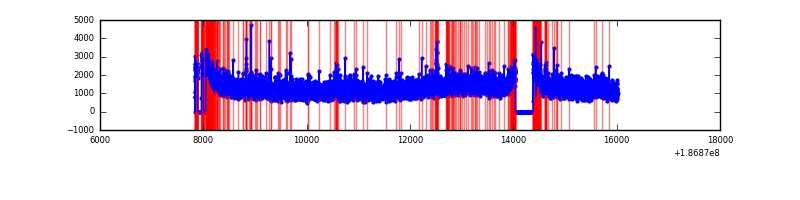 |
| C | 8187 | 7724 | 310 | 310 | 3.79% | 4.01% | 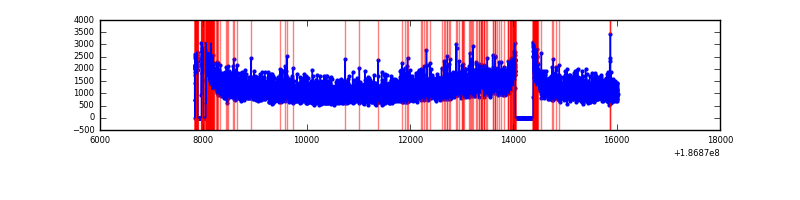 |
| D | 8188 | 7723 | 5407 | 5407 | 66.04% | 70.01% | 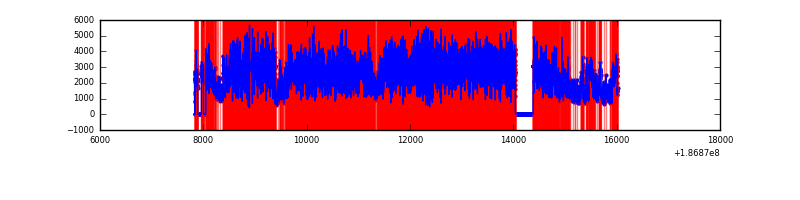 |
Top three noisy pixels from each quadrant. If the there are fewer than three noisy pixels in the level2.evt file, extra rows are filled as -1
| Pixel properties | Quadrant properties | ||||||
|---|---|---|---|---|---|---|---|
| Quadrant | DetID | PixID | Counts | Sigma | Mean | Median | Sigma |
| A | 0 | 253 | 57768 | 98.08 | 2353 | 2366 | 564.9 |
| A | 11 | 79 | 10697 | 14.75 | 2353 | 2366 | 564.9 |
| A | 3 | 111 | 7479 | 9.05 | 2353 | 2366 | 564.9 |
| B | 8 | 234 | 117946 | 196.81 | 2492 | 2498 | 586.6 |
| B | 7 | 221 | 102367 | 170.26 | 2492 | 2498 | 586.6 |
| B | 15 | 22 | 80898 | 133.66 | 2492 | 2498 | 586.6 |
| C | 15 | 241 | 359160 | 559.5 | 2287 | 2370 | 637.7 |
| C | 3 | 111 | 32818 | 47.75 | 2287 | 2370 | 637.7 |
| C | 3 | 79 | 28416 | 40.84 | 2287 | 2370 | 637.7 |
| D | 12 | 188 | 12892260 | 25139.66 | 1655 | 1710 | 512.8 |
| D | 1 | 4 | 239308 | 463.37 | 1655 | 1710 | 512.8 |
| D | 13 | 85 | 44845 | 84.12 | 1655 | 1710 | 512.8 |
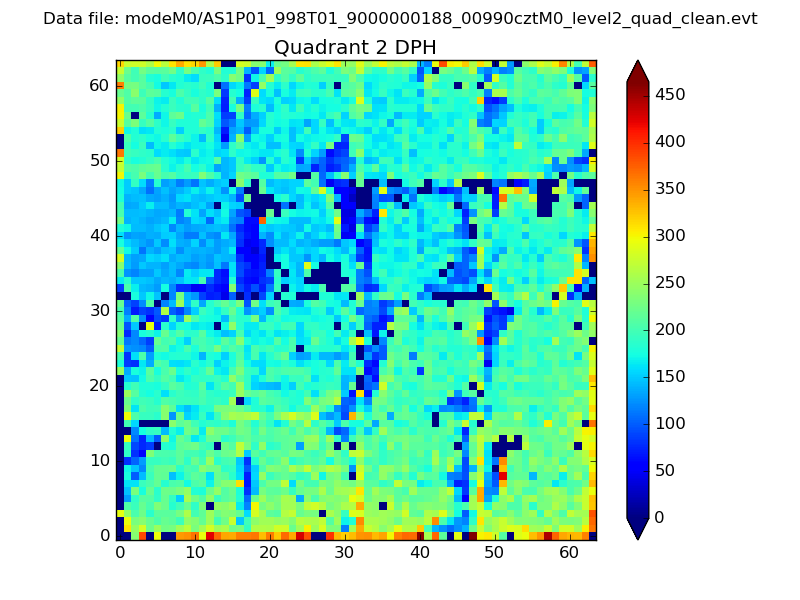
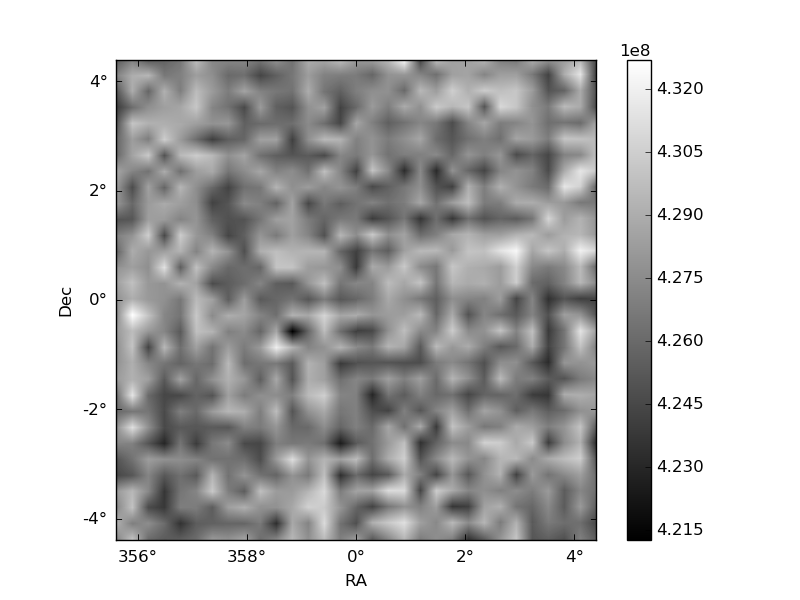
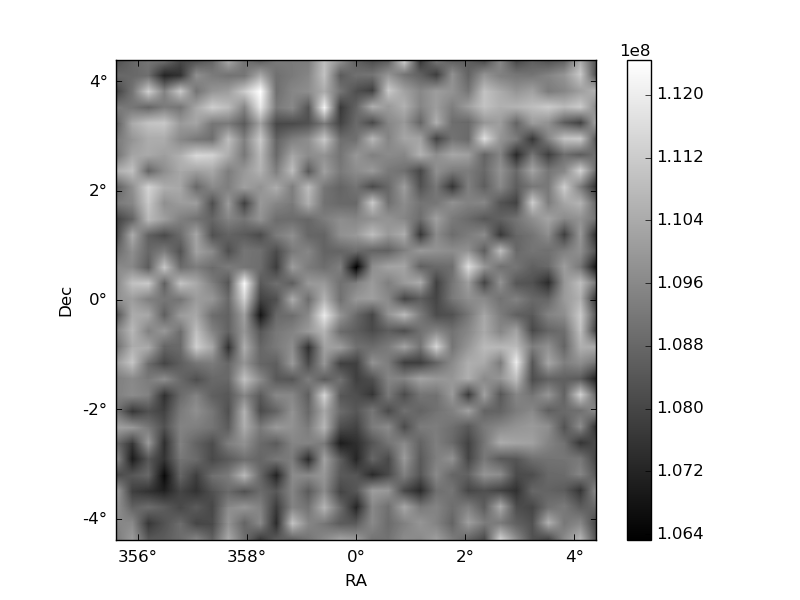
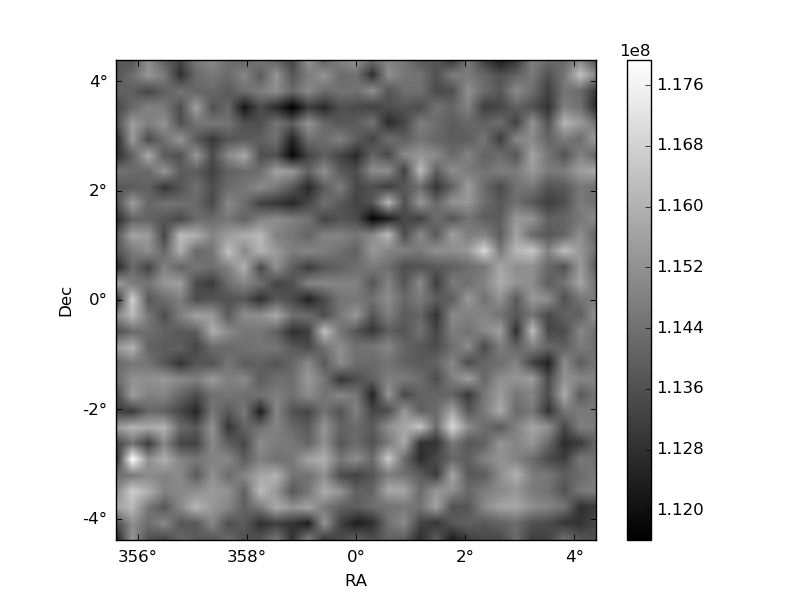
Histogram calculated using DETX and DETY for each event in the final _common_clean file
| Quadrant A | 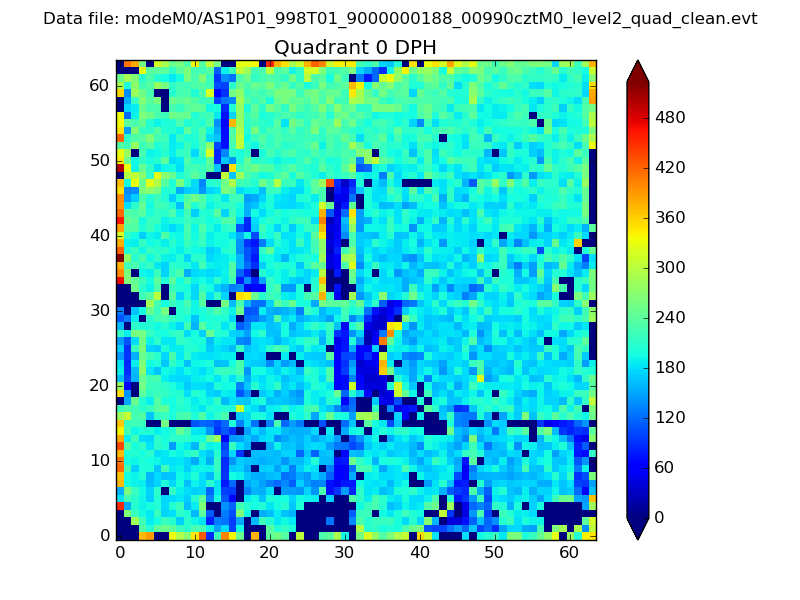 |
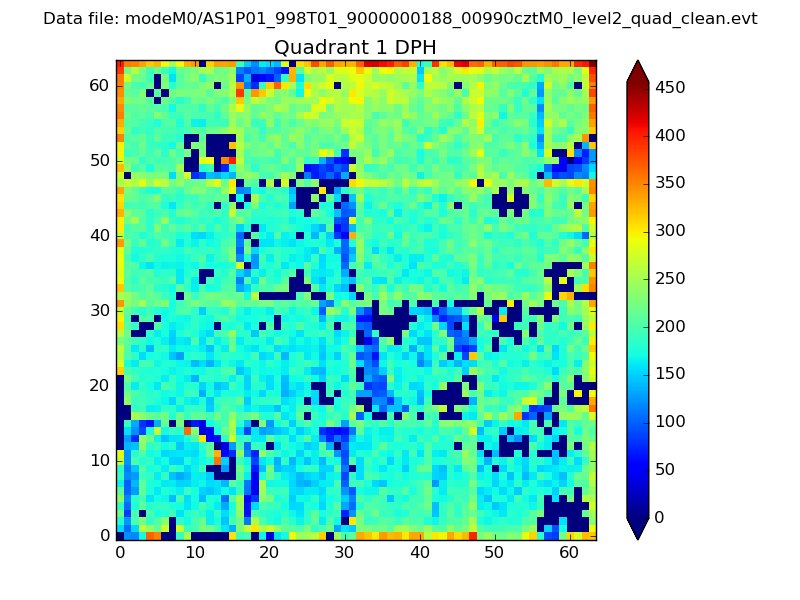 |
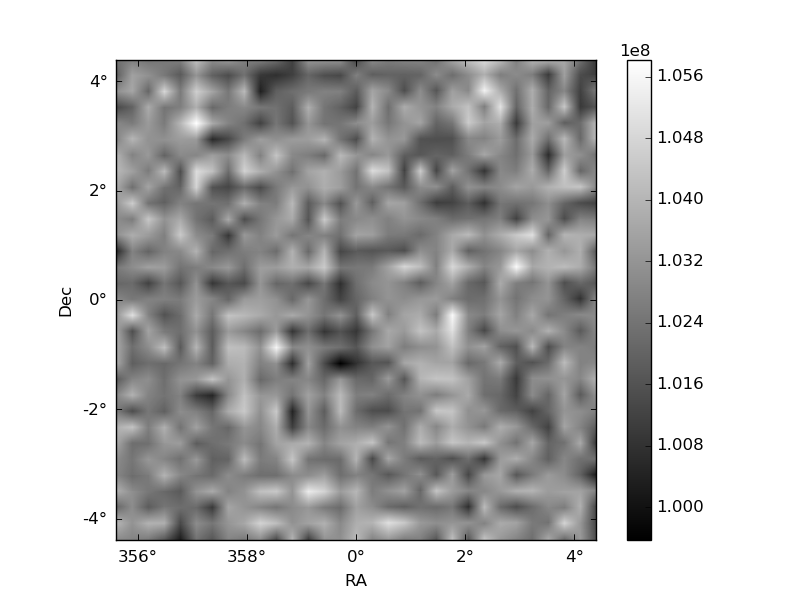
Quadrant B |
|---|---|---|---|
| Quadrant D | 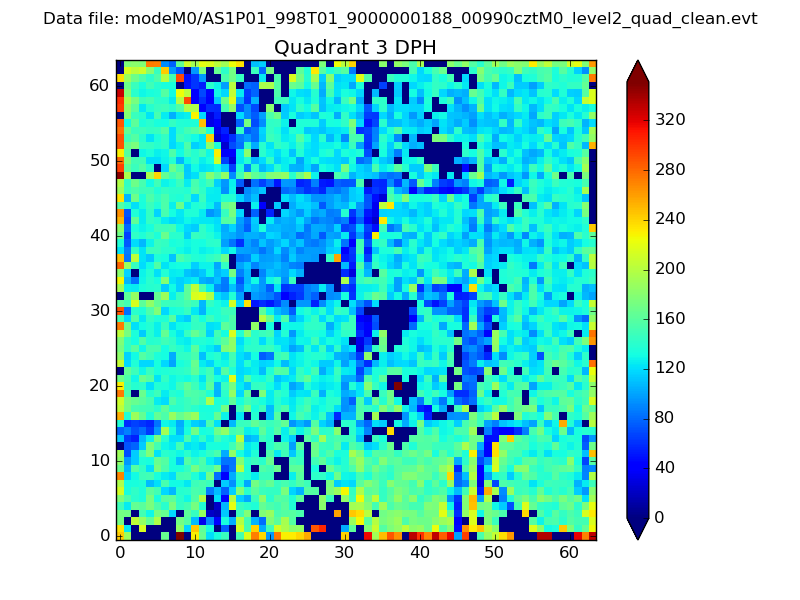 |
 |
Quadrant C |
| Plot type | Count rate plots | Images |
|---|---|---|
| Comparison with Poisson distribution Blue bars denote a histogram of data divided into 1 sec bins. Red curve is a Poisson curve with rate = median count rate of data. |
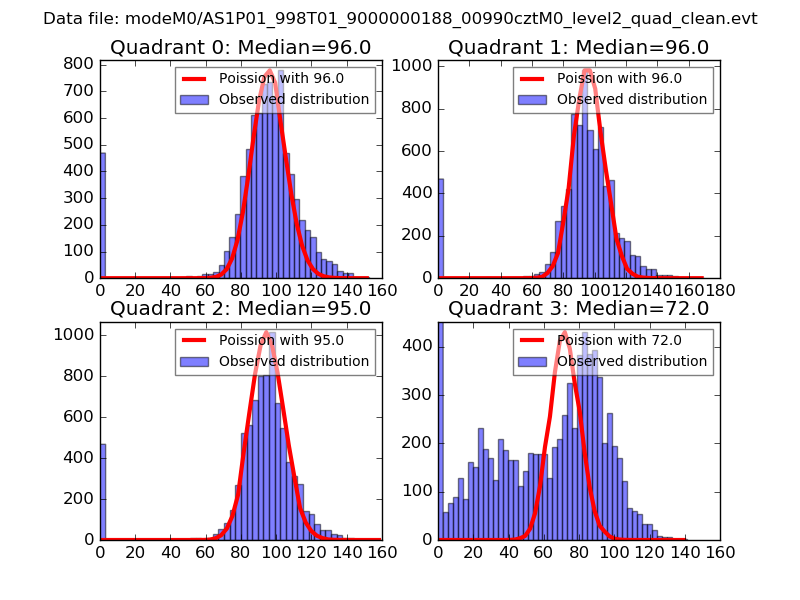 |
 |
| Quadrant-wise count rates Data is divided into 100 sec bins |
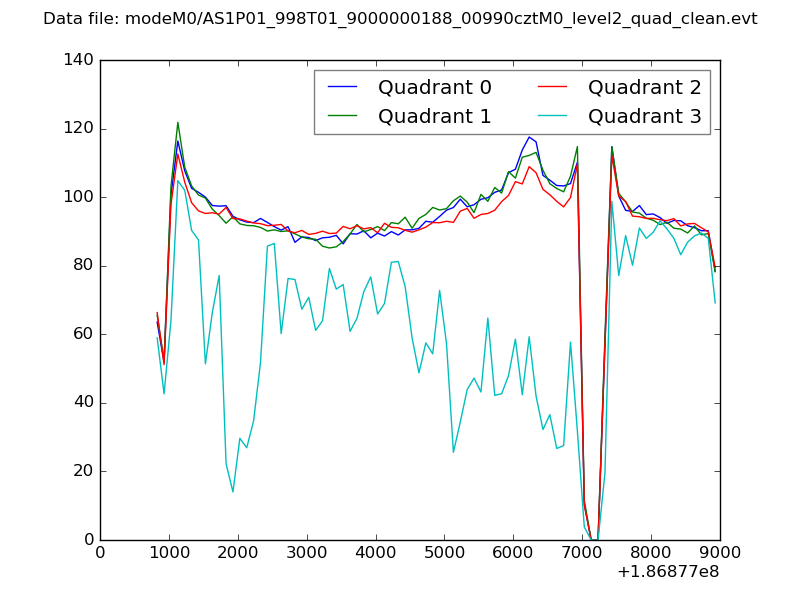 |
|
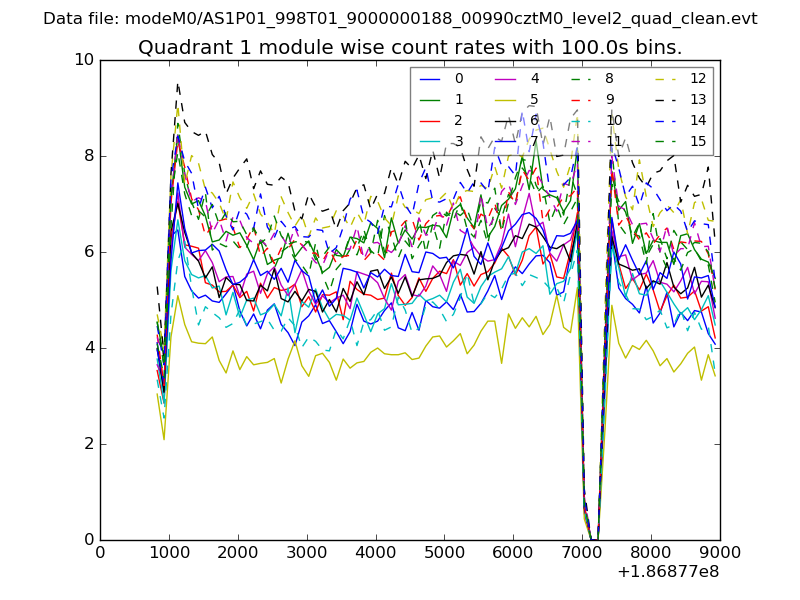
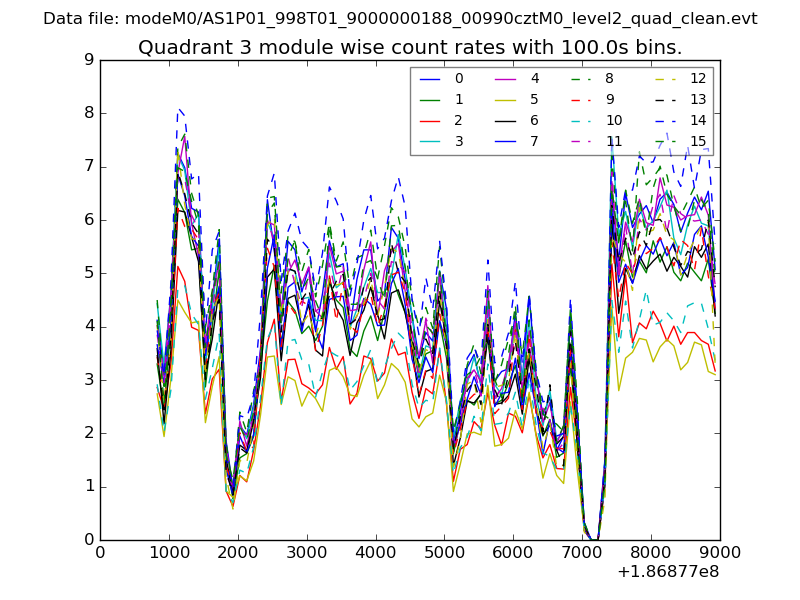
| Module-wise count rates for Quadrant A Data is divided into 100 sec bins |
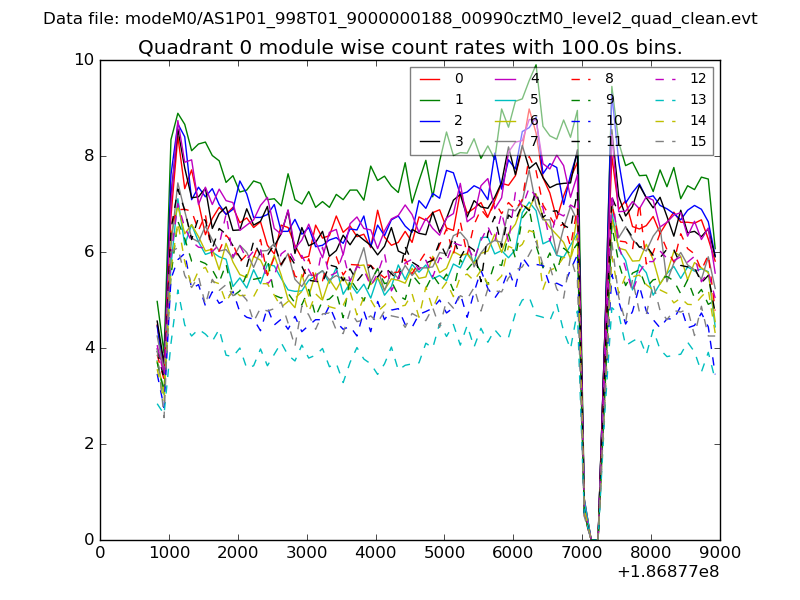 |
 |
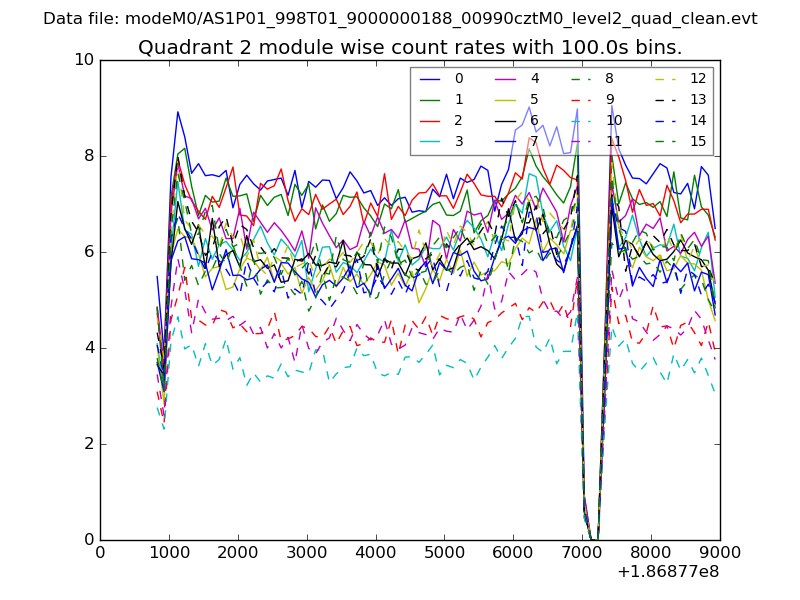
| Module-wise count rates for Quadrant B Data is divided into 100 sec bins |
 |
 |
| Module-wise count rates for Quadrant C Data is divided into 100 sec bins |
 |
 |
| Module-wise count rates for Quadrant D Data is divided into 100 sec bins |
 |
 |
| Parameter | Plot |
|---|---|
| CZT HV Monitor | 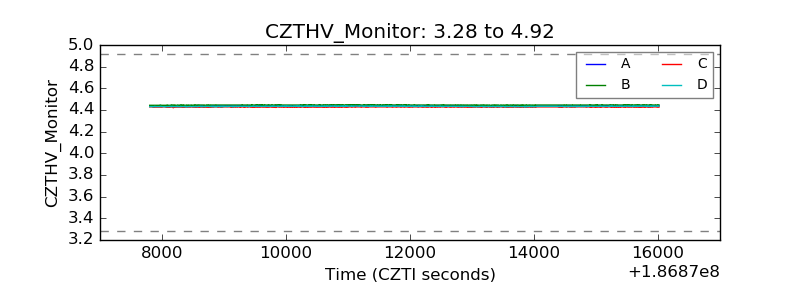 |
| D_VDD | 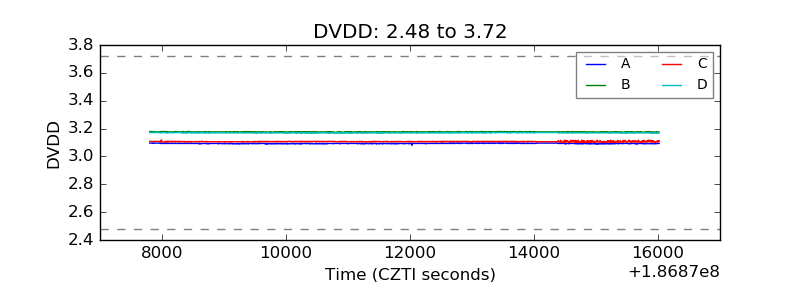 |
| Temperature 1 | 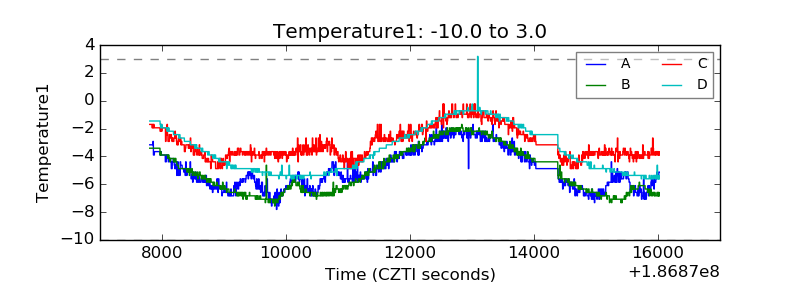 |
| Veto HV Monitor | 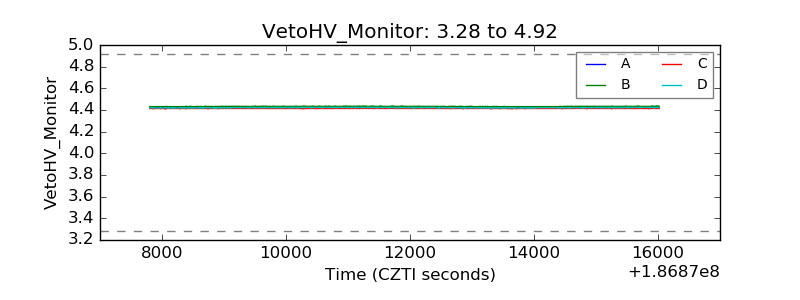 |
| Veto LLD | 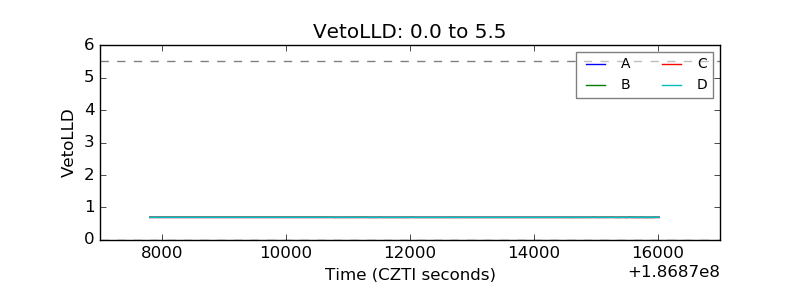 |
| Alpha Counter | 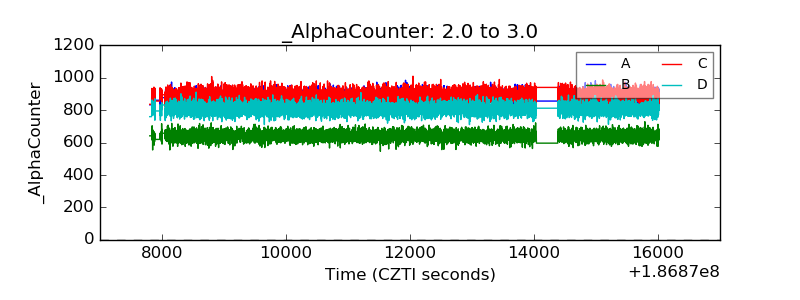 |
| _CPM_Rate | 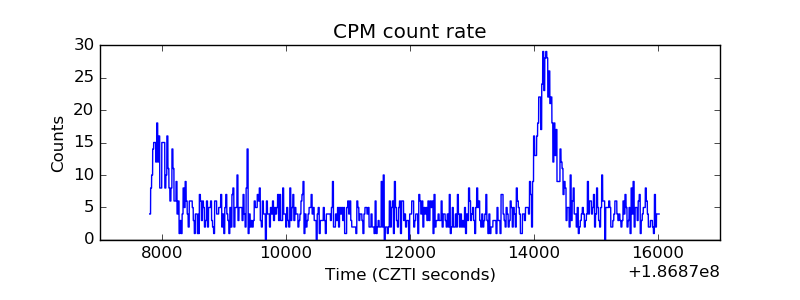 |
| CZT Counter | 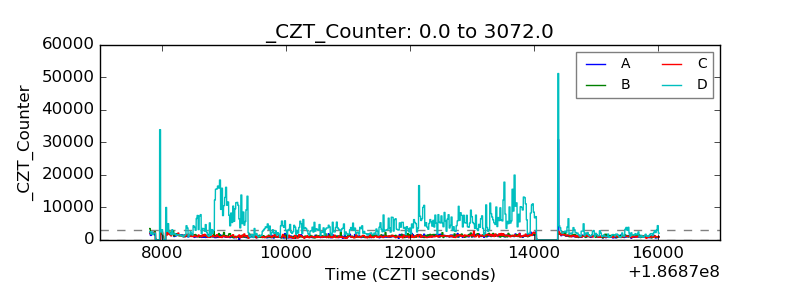 |
| +2.5 Volts monitor | 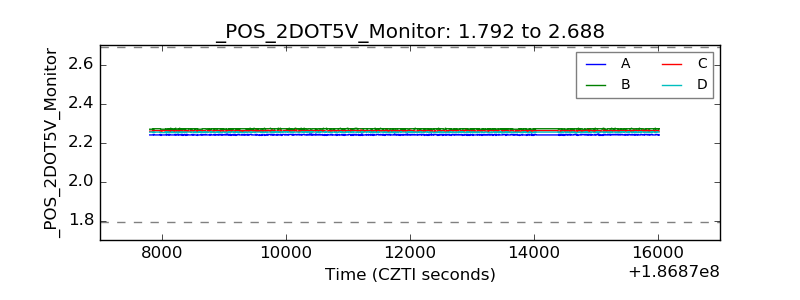 |
| +5 Volts monitor |  |
| _ROLL_ROT | 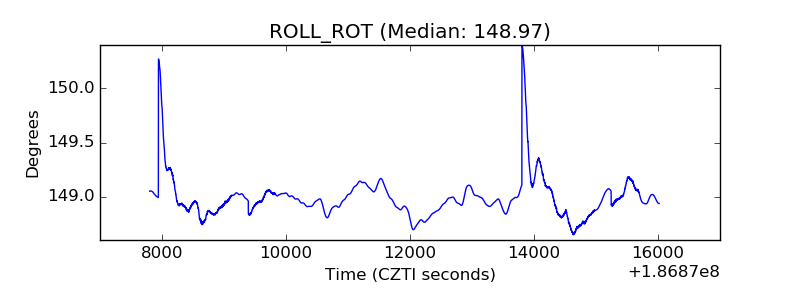 |
| _Roll_DEC | 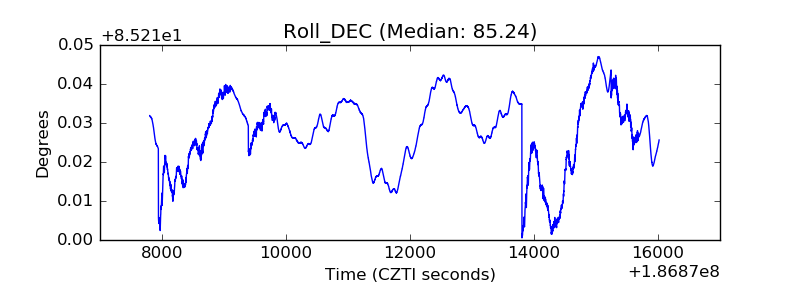 |
| _Roll_RA | 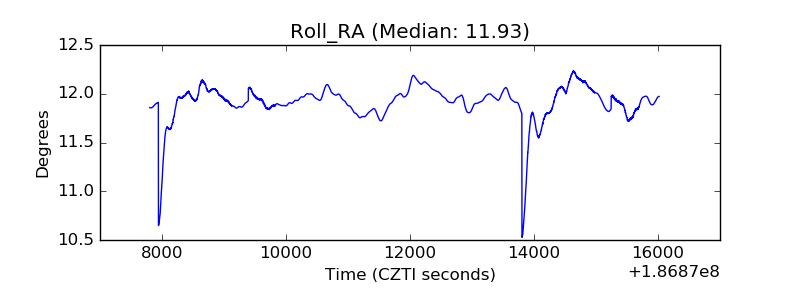 |
| Veto Counter | 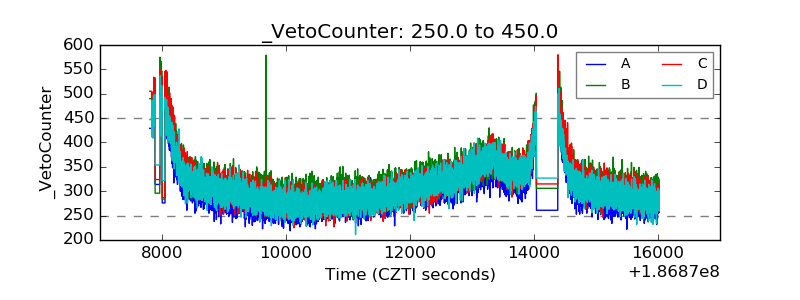 |