| Param | Original file | Final file |
|---|---|---|
| Filename | modeM0/AS1P01_998T01_9000000188_00993cztM0_level2.evt | modeM0/AS1P01_998T01_9000000188_00993cztM0_level2_quad_clean.evt |
| Size (bytes) | 2,012,906,880 | 111,415,680 |
| Size | 1.9 GB | 106.3 MB |
| Events in quadrant A | 13,819,282 | 657,343 |
| Events in quadrant B | 14,745,523 | 661,048 |
| Events in quadrant C | 13,737,659 | 647,772 |
| Events in quadrant D | 17,880,897 | 591,341 |
| Mode M0 | |||
|---|---|---|---|
| Quadrant | BADHDUFLAG | Total packets | Discarded packets |
| A | 0 | 49463 | 0 |
| B | 0 | 52094 | 0 |
| C | 0 | 49207 | 0 |
| D | 0 | 61647 | 0 |
| Mode M9 | |||
|---|---|---|---|
| Quadrant | BADHDUFLAG | Total packets | Discarded packets |
| A | 0 | 15 | 0 |
| B | 0 | 15 | 0 |
| C | 0 | 15 | 0 |
| D | 0 | 15 | 0 |
| Mode SS | |||
|---|---|---|---|
| Quadrant | BADHDUFLAG | Total packets | Discarded packets |
| A | 0 | 242 | 0 |
| B | 0 | 242 | 0 |
| C | 0 | 242 | 0 |
| D | 0 | 242 | 0 |
| Quadrant | Total seconds | Saturated seconds | Saturation percentage |
|---|---|---|---|
| A | 11788 | 22 | 0.186630% |
| B | 11788 | 28 | 0.237530% |
| C | 11788 | 10 | 0.084832% |
| D | 11788 | 927 | 7.863929% |
Noise dominated data is calculated using 1-second bins in cleaned event files. If a bin has >2000 counts, and if more than 50% of those come from <1% of pixels, then it is considered to be noise-dominated and hence unusable.
| Quadrant | # 1 sec bins | Bins with >0 counts | Bins with >2000 counts | High rate bins dominated by noise | Noise dominated (total time) | Noise dominated (detector-on time) | Marked lightcurve |
|---|---|---|---|---|---|---|---|
| A | 13338 | 11790 | 252 | 252 | 1.89% | 2.14% | 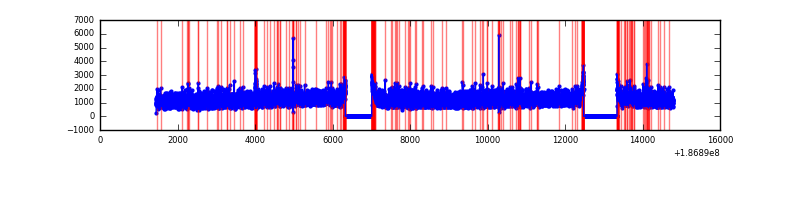 |
| B | 13338 | 11790 | 405 | 405 | 3.04% | 3.44% | 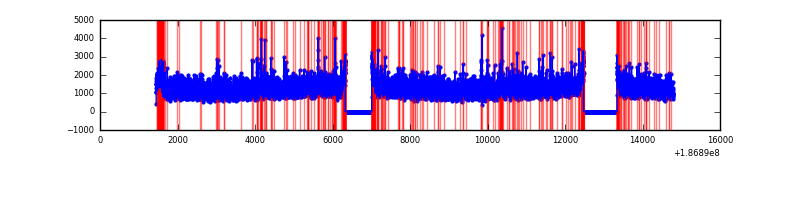 |
| C | 13338 | 11790 | 207 | 207 | 1.55% | 1.76% | 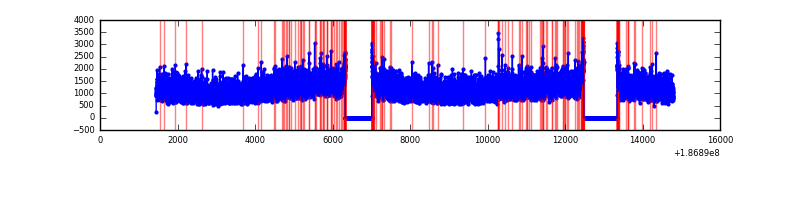 |
| D | 13338 | 11790 | 2392 | 2392 | 17.93% | 20.29% | 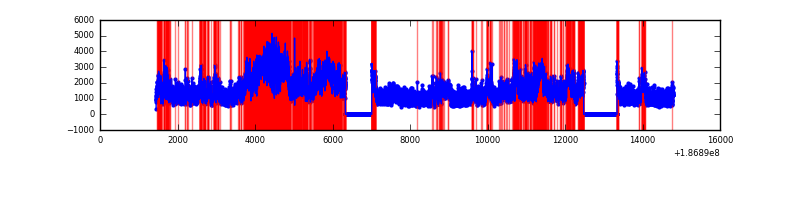 |
Top three noisy pixels from each quadrant. If the there are fewer than three noisy pixels in the level2.evt file, extra rows are filled as -1
| Pixel properties | Quadrant properties | ||||||
|---|---|---|---|---|---|---|---|
| Quadrant | DetID | PixID | Counts | Sigma | Mean | Median | Sigma |
| A | 15 | 233 | 62254 | 68.19 | 3578 | 3607 | 860.1 |
| A | 0 | 253 | 14188 | 12.3 | 3578 | 3607 | 860.1 |
| A | 11 | 79 | 13026 | 10.95 | 3578 | 3607 | 860.1 |
| B | 7 | 221 | 157981 | 174.65 | 3744 | 3762 | 883.0 |
| B | 15 | 220 | 132168 | 145.42 | 3744 | 3762 | 883.0 |
| B | 5 | 249 | 110813 | 121.24 | 3744 | 3762 | 883.0 |
| C | 15 | 241 | 543505 | 582.68 | 3345 | 3456 | 926.8 |
| C | 3 | 111 | 49159 | 49.31 | 3345 | 3456 | 926.8 |
| C | 3 | 79 | 46132 | 46.04 | 3345 | 3456 | 926.8 |
| D | 12 | 188 | 5250949 | 5359.85 | 3175 | 3289 | 979.1 |
| D | 1 | 4 | 250808 | 252.81 | 3175 | 3289 | 979.1 |
| D | 13 | 85 | 199242 | 200.14 | 3175 | 3289 | 979.1 |
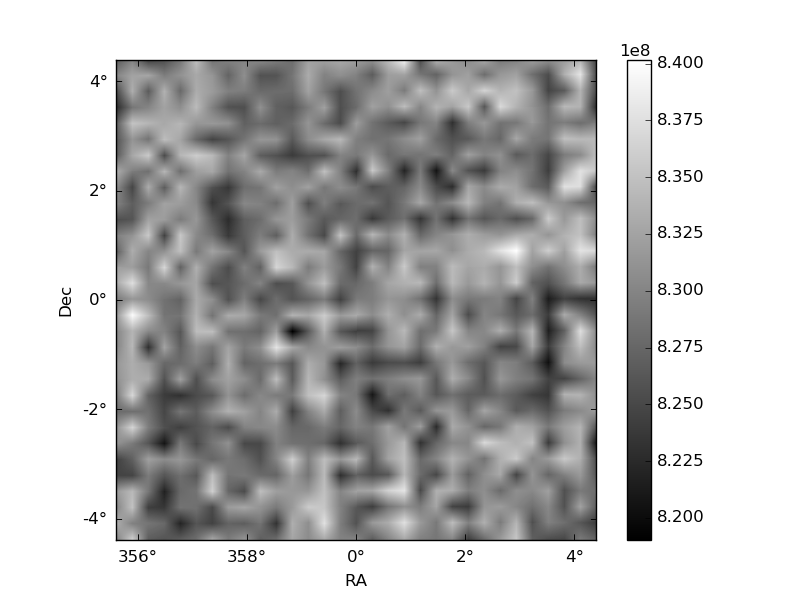
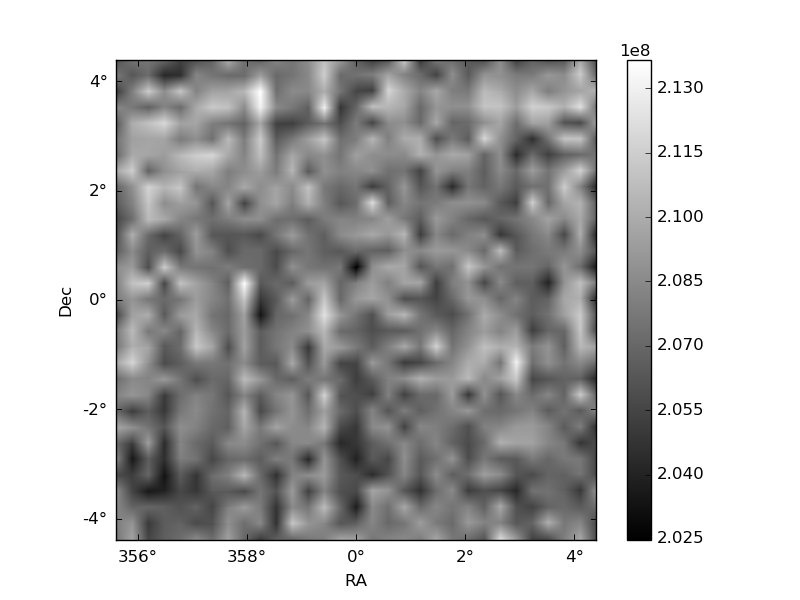
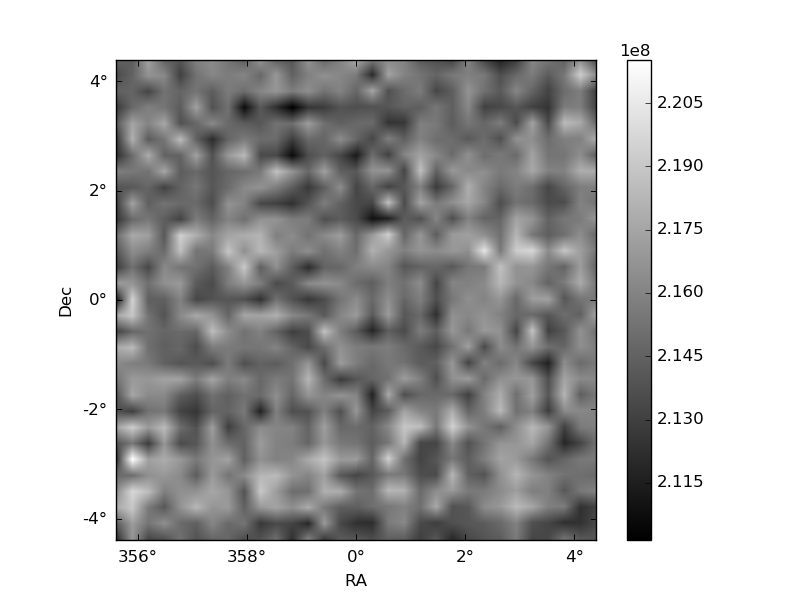
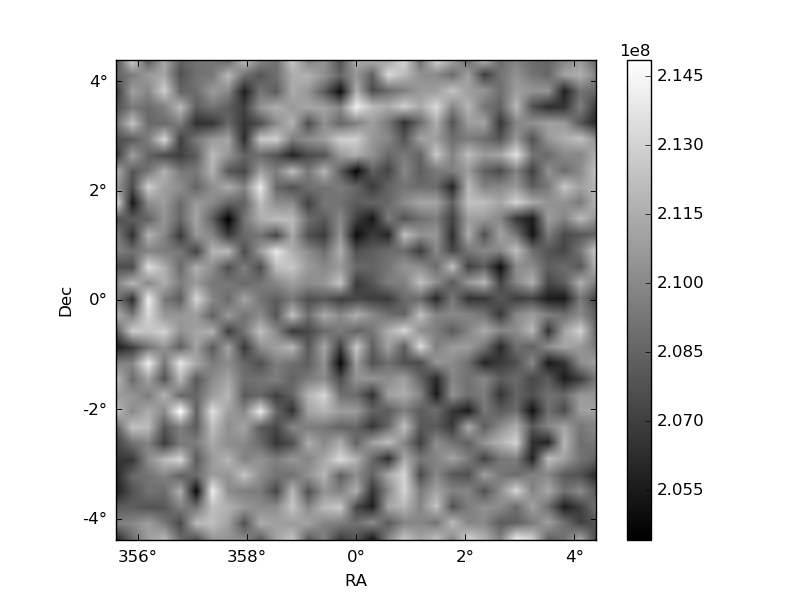
Histogram calculated using DETX and DETY for each event in the final _common_clean file
| Quadrant A | 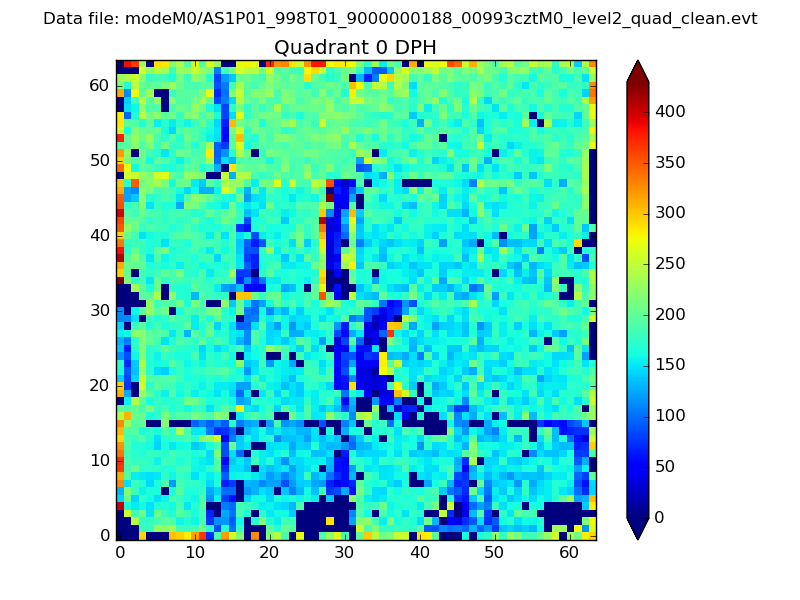 |
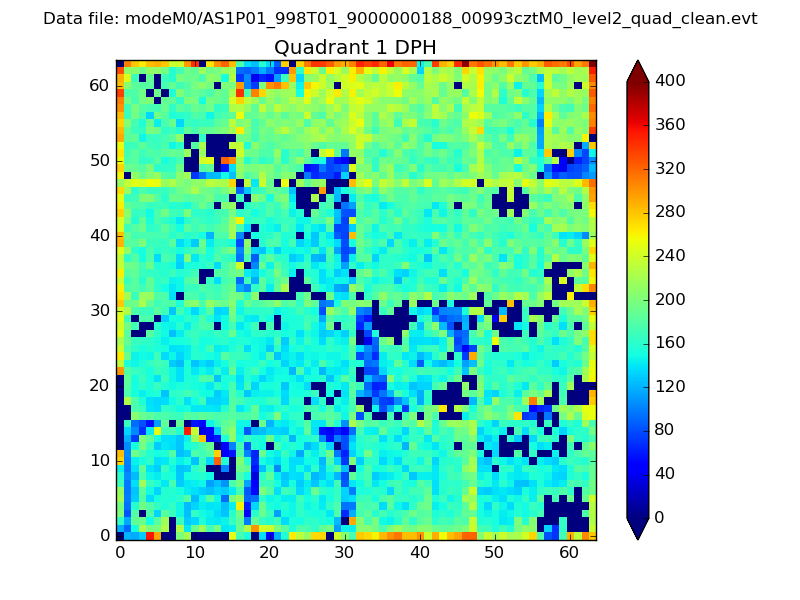 |
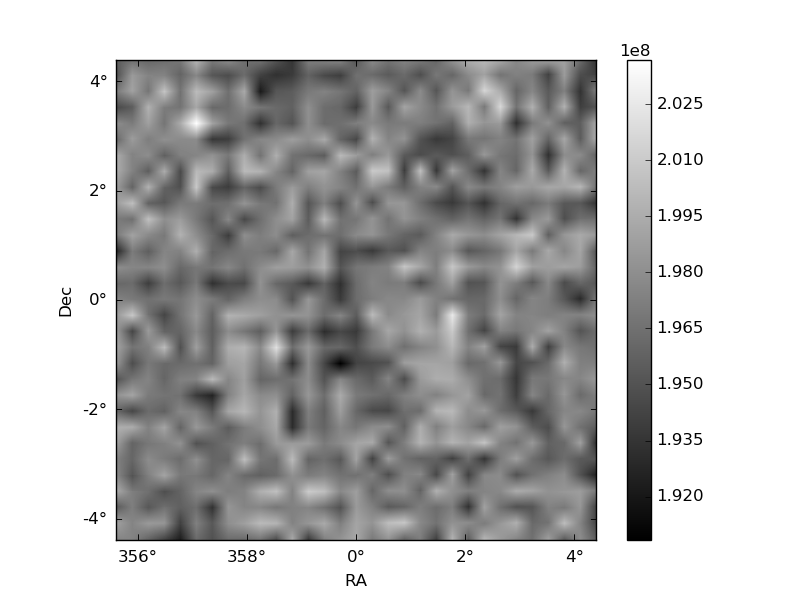
Quadrant B |
|---|---|---|---|
| Quadrant D | 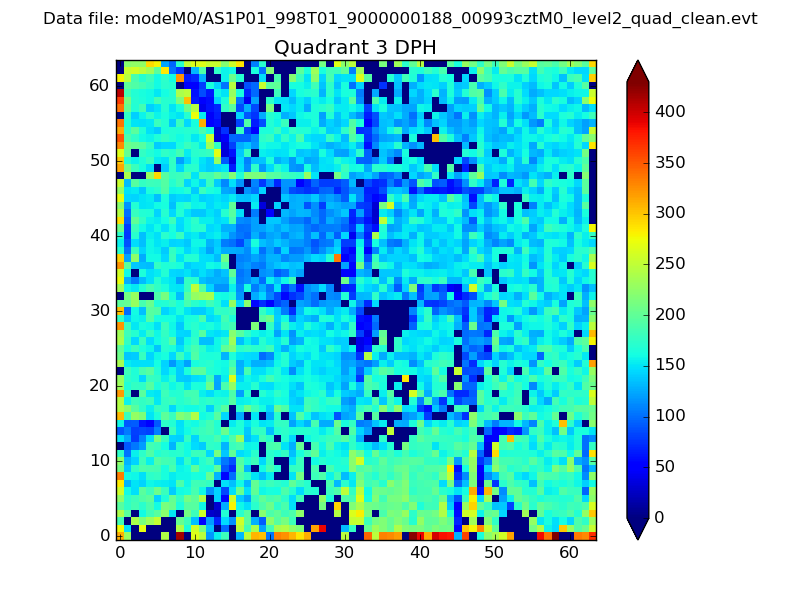 |
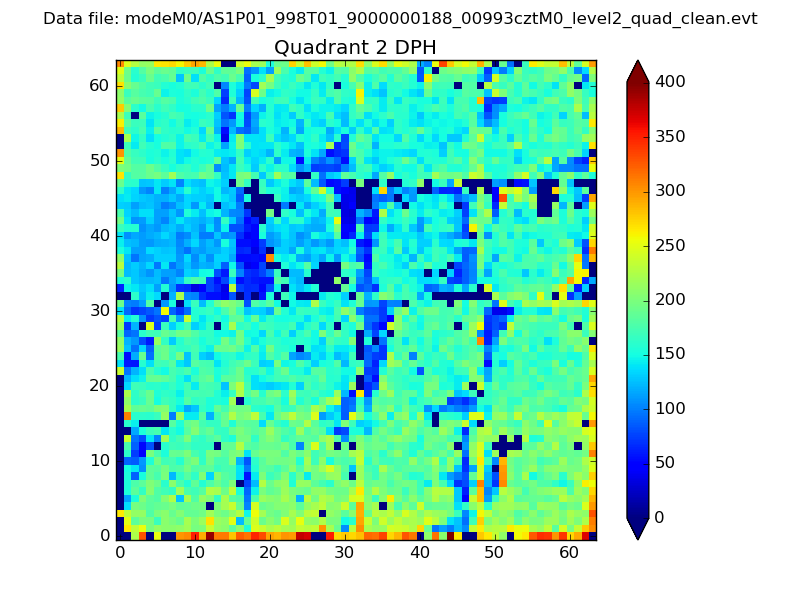 |
Quadrant C |
| Plot type | Count rate plots | Images |
|---|---|---|
| Comparison with Poisson distribution Blue bars denote a histogram of data divided into 1 sec bins. Red curve is a Poisson curve with rate = median count rate of data. |
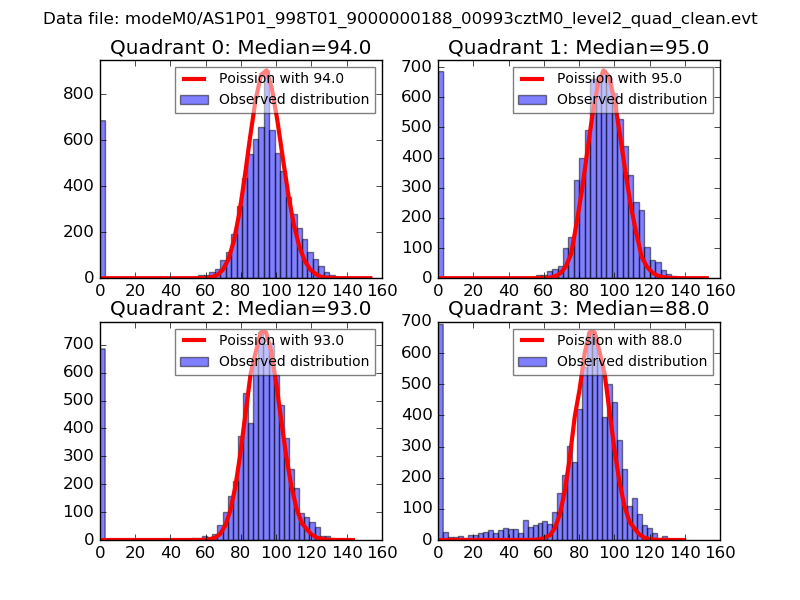 |
 |
| Quadrant-wise count rates Data is divided into 100 sec bins |
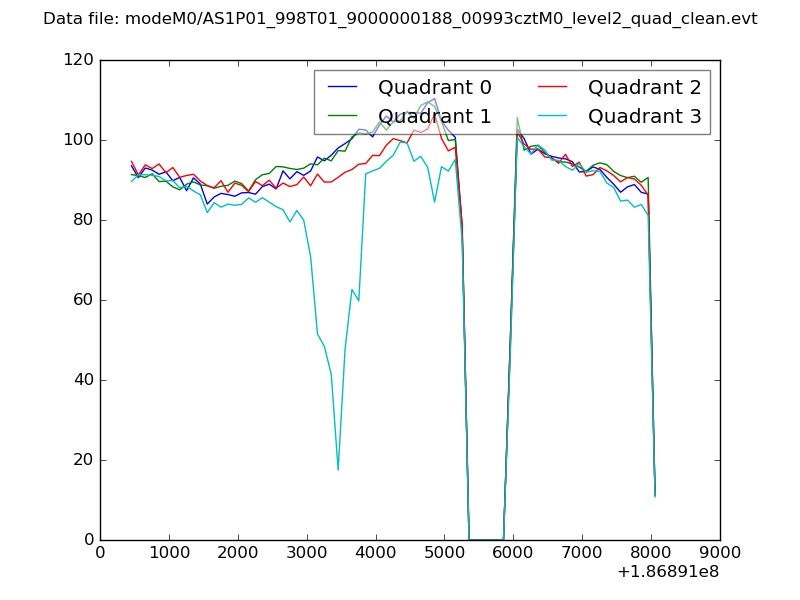 |
|
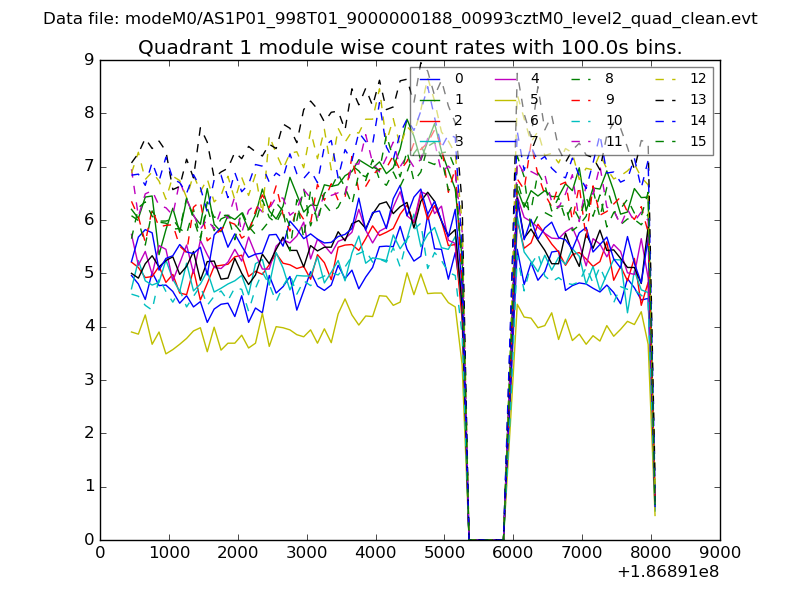
| Module-wise count rates for Quadrant A Data is divided into 100 sec bins |
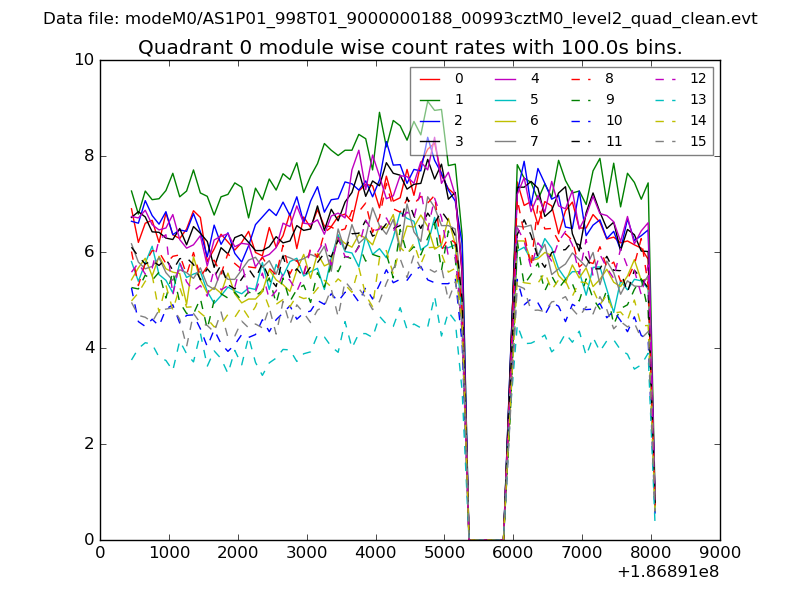 |
 |
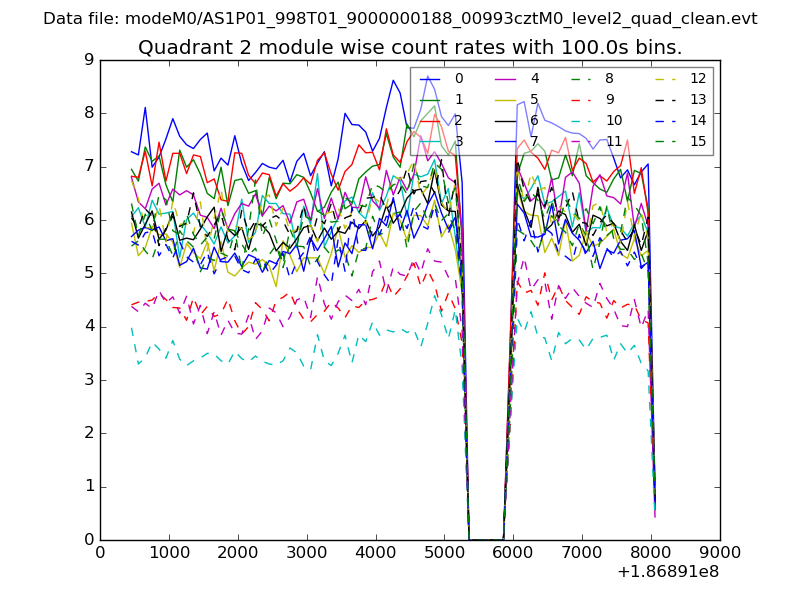
| Module-wise count rates for Quadrant B Data is divided into 100 sec bins |
 |
 |
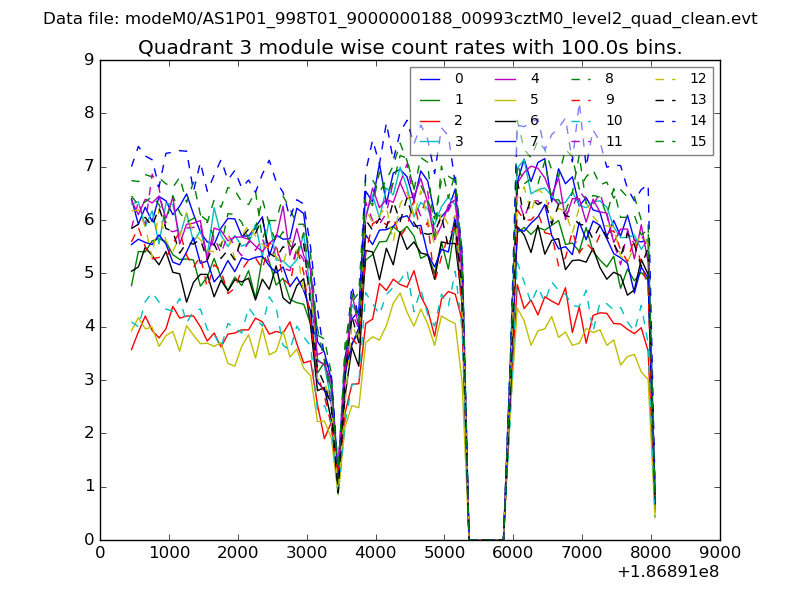
| Module-wise count rates for Quadrant C Data is divided into 100 sec bins |
 |
 |
| Module-wise count rates for Quadrant D Data is divided into 100 sec bins |
 |
 |
| Parameter | Plot |
|---|---|
| CZT HV Monitor | 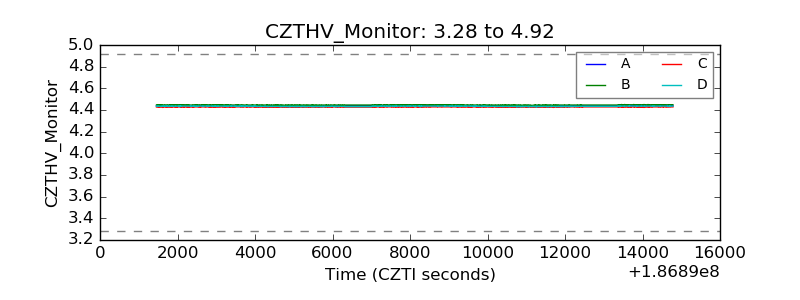 |
| D_VDD |  |
| Temperature 1 | 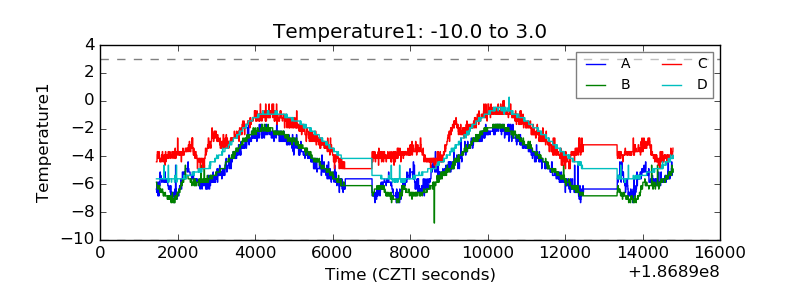 |
| Veto HV Monitor | 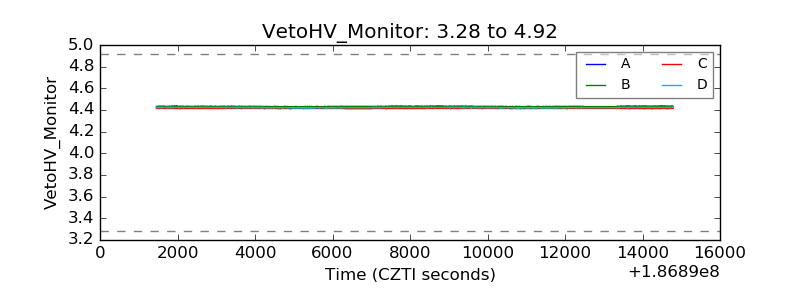 |
| Veto LLD | 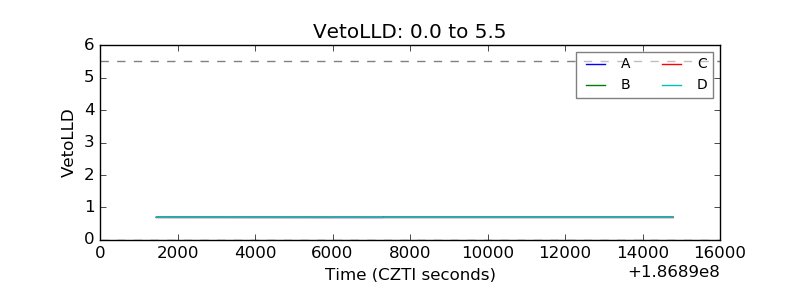 |
| Alpha Counter | 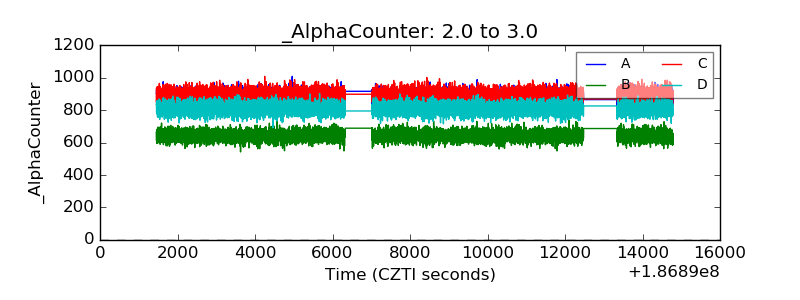 |
| _CPM_Rate | 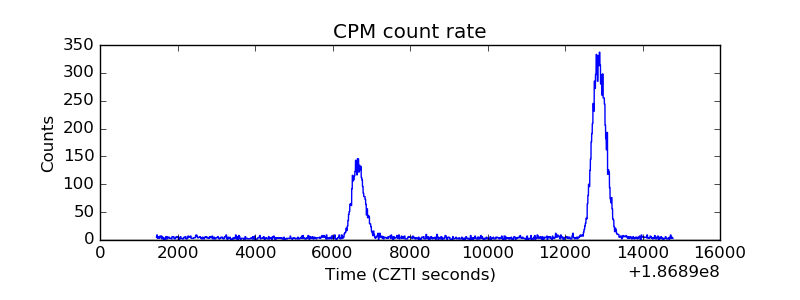 |
| CZT Counter | 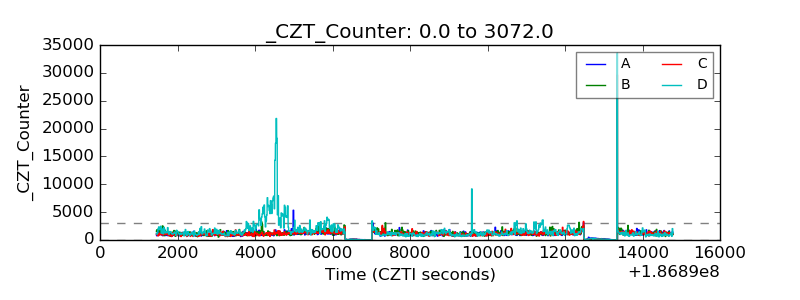 |
| +2.5 Volts monitor |  |
| +5 Volts monitor |  |
| _ROLL_ROT | 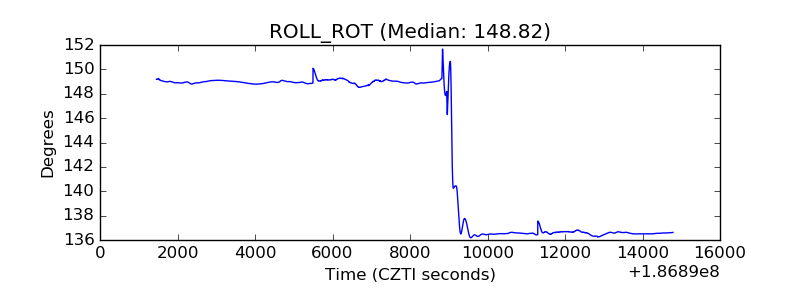 |
| _Roll_DEC | 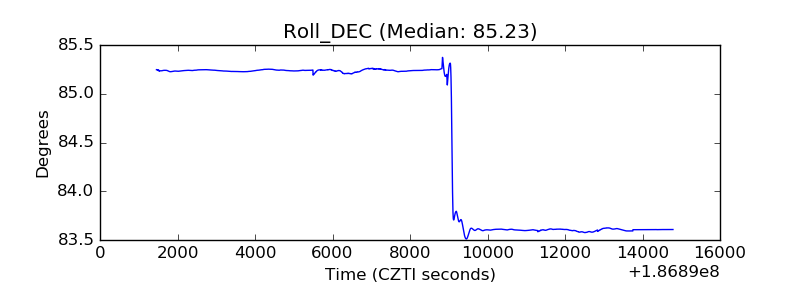 |
| _Roll_RA | 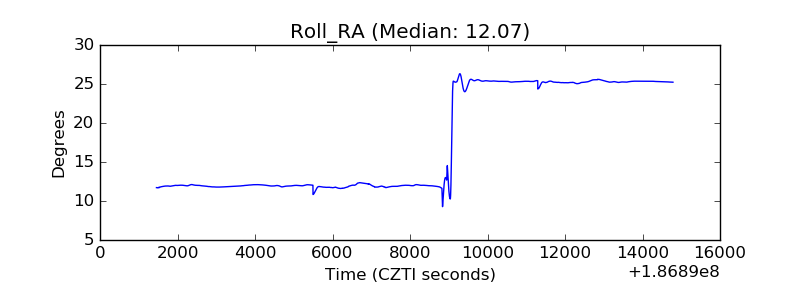 |
| Veto Counter | 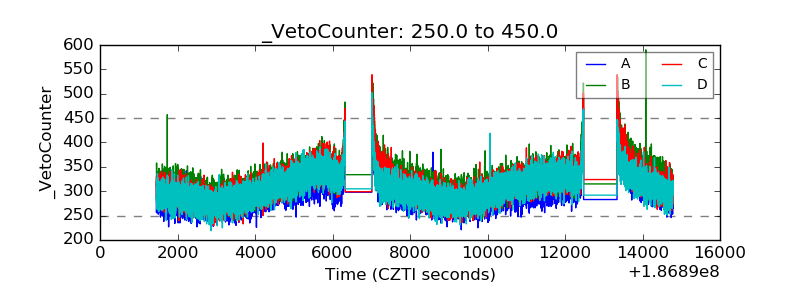 |