| Param | Original file | Final file |
|---|---|---|
| Filename | modeM0/AS1P01_998T01_9000000188_00994cztM0_level2.evt | modeM0/AS1P01_998T01_9000000188_00994cztM0_level2_quad_clean.evt |
| Size (bytes) | 503,904,960 | 45,771,840 |
| Size | 480.6 MB | 43.7 MB |
| Events in quadrant A | 3,606,564 | 296,490 |
| Events in quadrant B | 3,716,324 | 301,042 |
| Events in quadrant C | 3,456,054 | 287,277 |
| Events in quadrant D | 4,270,381 | 276,237 |
| Mode M0 | |||
|---|---|---|---|
| Quadrant | BADHDUFLAG | Total packets | Discarded packets |
| A | 0 | 12964 | 0 |
| B | 0 | 13285 | 0 |
| C | 0 | 12541 | 0 |
| D | 0 | 14942 | 0 |
| Mode SS | |||
|---|---|---|---|
| Quadrant | BADHDUFLAG | Total packets | Discarded packets |
| A | 0 | 62 | 0 |
| B | 0 | 62 | 0 |
| C | 0 | 62 | 0 |
| D | 0 | 62 | 0 |
| Quadrant | Total seconds | Saturated seconds | Saturation percentage |
|---|---|---|---|
| A | 3162 | 3 | 0.094877% |
| B | 3162 | 8 | 0.253004% |
| C | 3162 | 0 | 0.000000% |
| D | 3162 | 38 | 1.201771% |
Noise dominated data is calculated using 1-second bins in cleaned event files. If a bin has >2000 counts, and if more than 50% of those come from <1% of pixels, then it is considered to be noise-dominated and hence unusable.
| Quadrant | # 1 sec bins | Bins with >0 counts | Bins with >2000 counts | High rate bins dominated by noise | Noise dominated (total time) | Noise dominated (detector-on time) | Marked lightcurve |
|---|---|---|---|---|---|---|---|
| A | 3162 | 3162 | 36 | 36 | 1.14% | 1.14% | 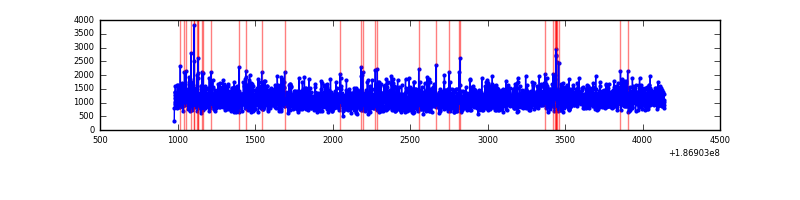 |
| B | 3162 | 3162 | 65 | 65 | 2.06% | 2.06% | 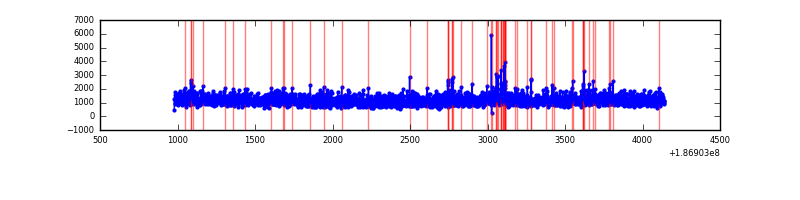 |
| C | 3162 | 3162 | 26 | 26 | 0.82% | 0.82% | 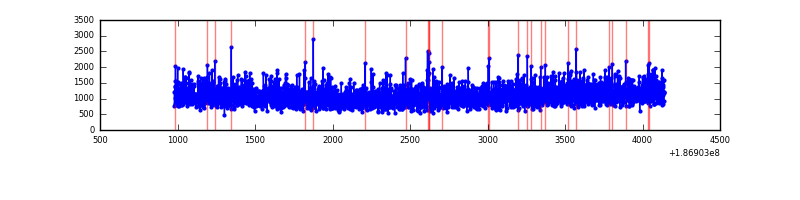 |
| D | 3162 | 3162 | 341 | 341 | 10.78% | 10.78% | 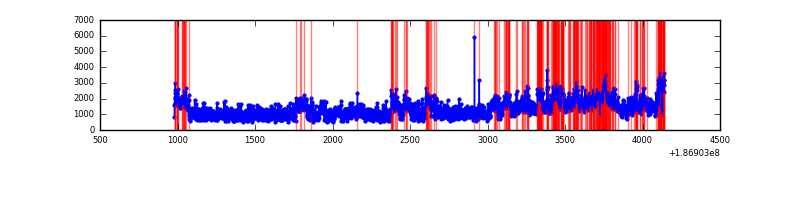 |
Top three noisy pixels from each quadrant. If the there are fewer than three noisy pixels in the level2.evt file, extra rows are filled as -1
| Pixel properties | Quadrant properties | ||||||
|---|---|---|---|---|---|---|---|
| Quadrant | DetID | PixID | Counts | Sigma | Mean | Median | Sigma |
| A | 15 | 127 | 12695 | 51.73 | 933 | 940 | 227.3 |
| A | 4 | 2 | 10744 | 43.14 | 933 | 940 | 227.3 |
| A | 11 | 242 | 3650 | 11.92 | 933 | 940 | 227.3 |
| B | 5 | 249 | 70761 | 312.45 | 939 | 945 | 223.4 |
| B | 15 | 22 | 22174 | 95.01 | 939 | 945 | 223.4 |
| B | 8 | 234 | 18015 | 76.39 | 939 | 945 | 223.4 |
| C | 15 | 241 | 153919 | 658.89 | 833 | 857 | 232.3 |
| C | 3 | 79 | 15121 | 61.4 | 833 | 857 | 232.3 |
| C | 3 | 111 | 15059 | 61.14 | 833 | 857 | 232.3 |
| D | 12 | 188 | 1037451 | 4084.37 | 835 | 862 | 253.8 |
| D | 1 | 4 | 77385 | 301.52 | 835 | 862 | 253.8 |
| D | 13 | 170 | 11977 | 43.8 | 835 | 862 | 253.8 |
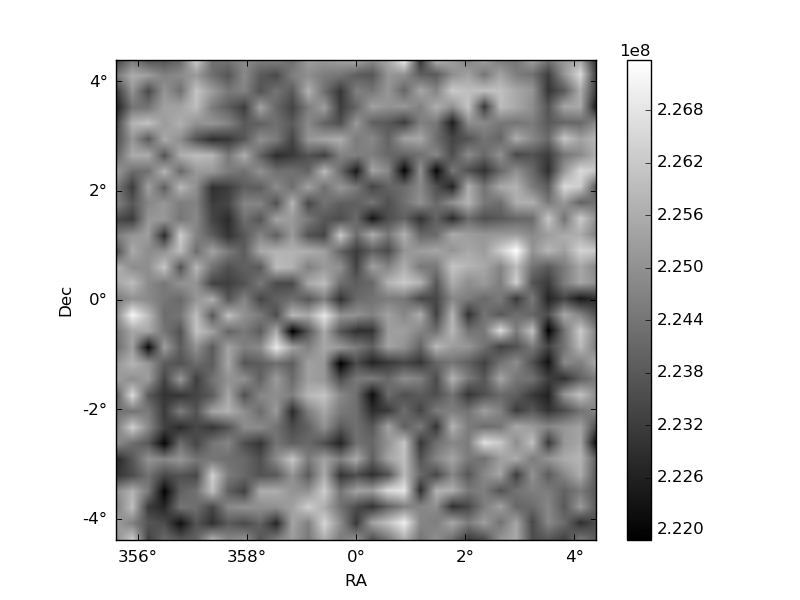
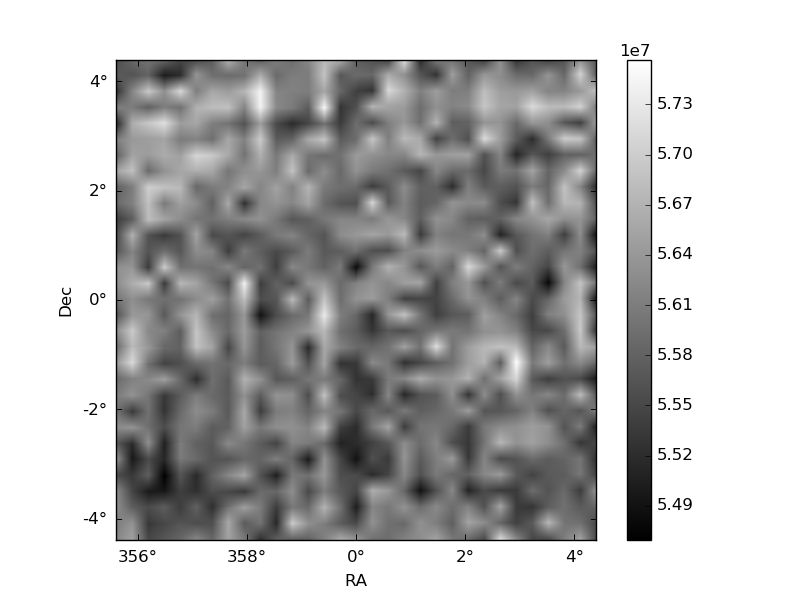
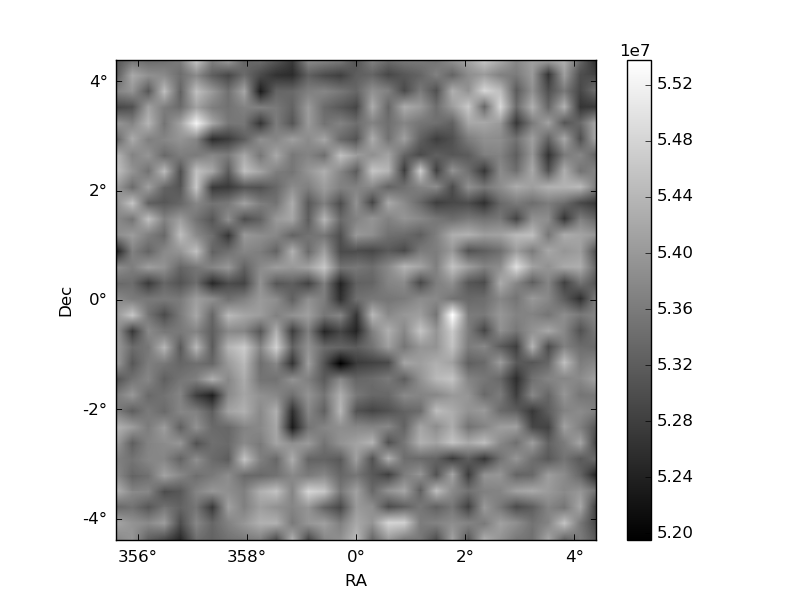
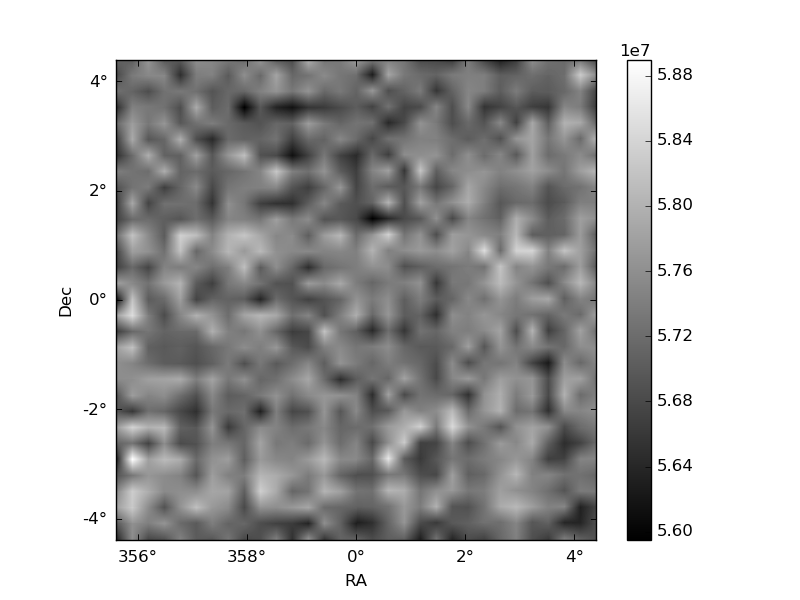
Histogram calculated using DETX and DETY for each event in the final _common_clean file
| Quadrant A | 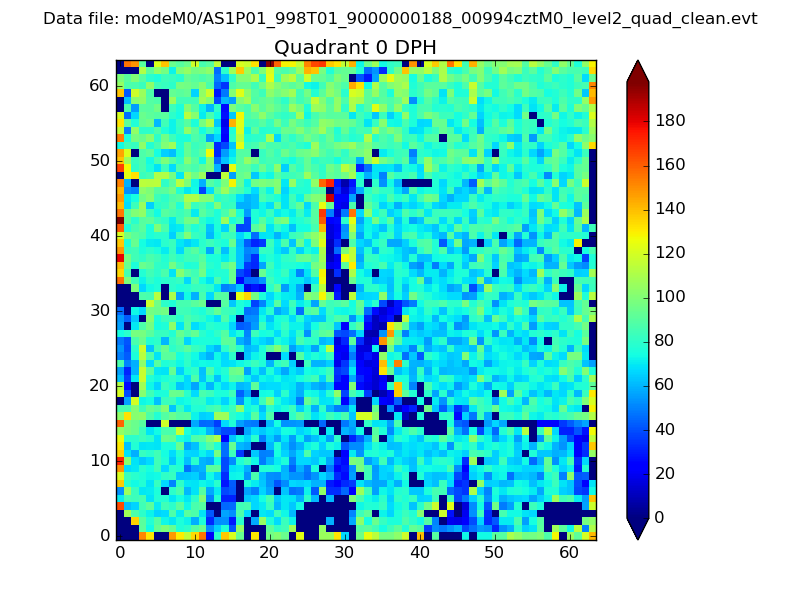 |
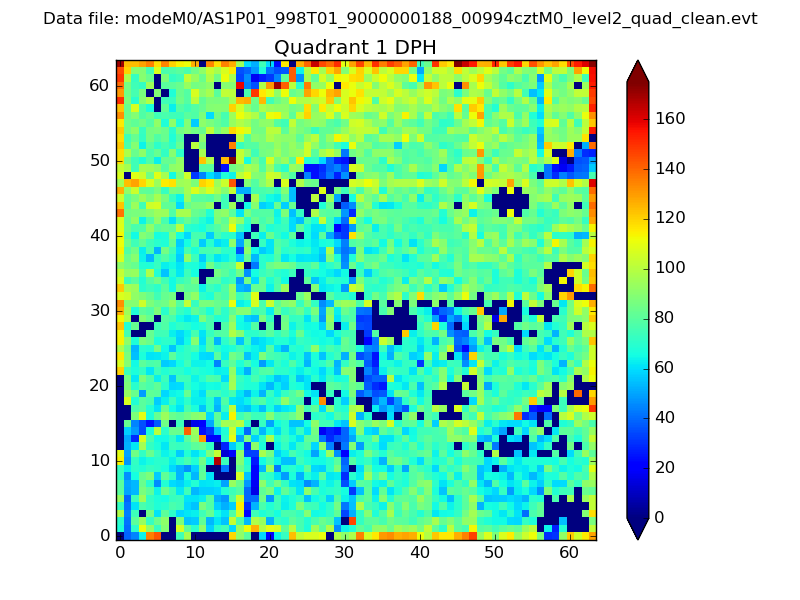 |
Quadrant B |
|---|---|---|---|
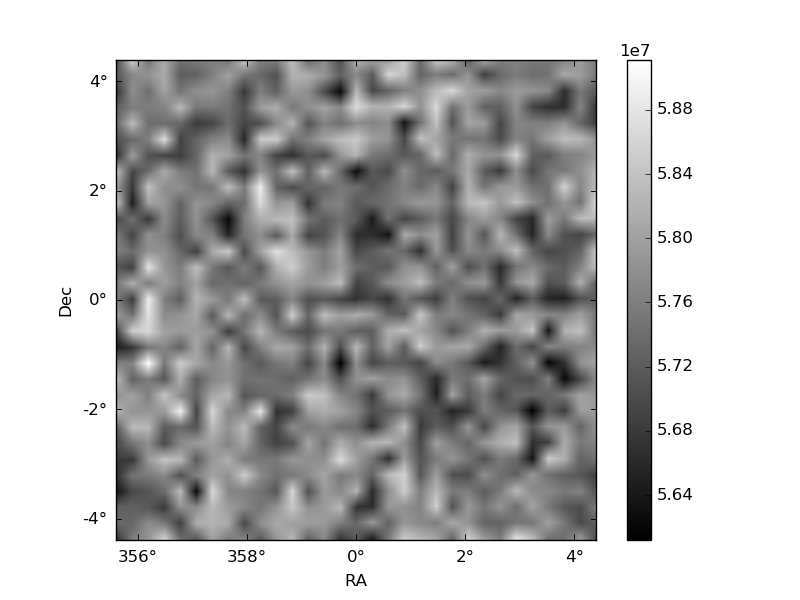
| Quadrant D | 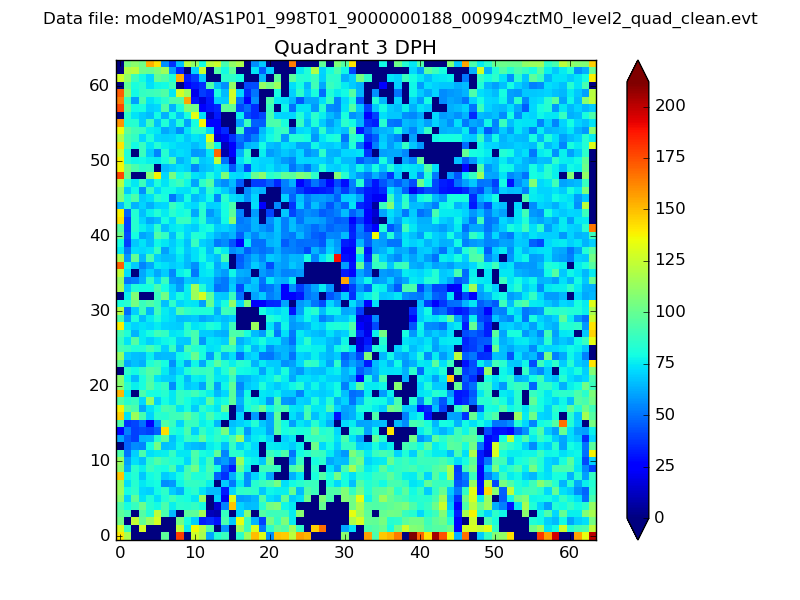 |
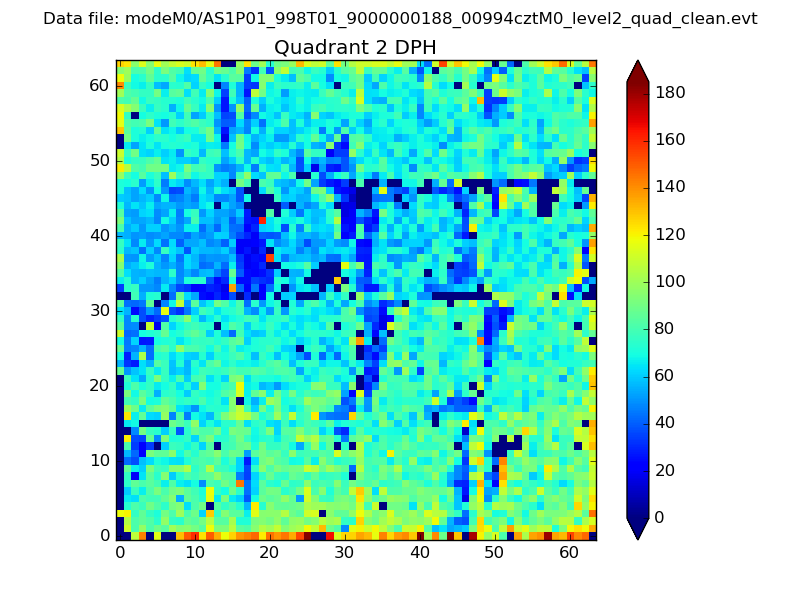 |
Quadrant C |
| Plot type | Count rate plots | Images |
|---|---|---|
| Comparison with Poisson distribution Blue bars denote a histogram of data divided into 1 sec bins. Red curve is a Poisson curve with rate = median count rate of data. |
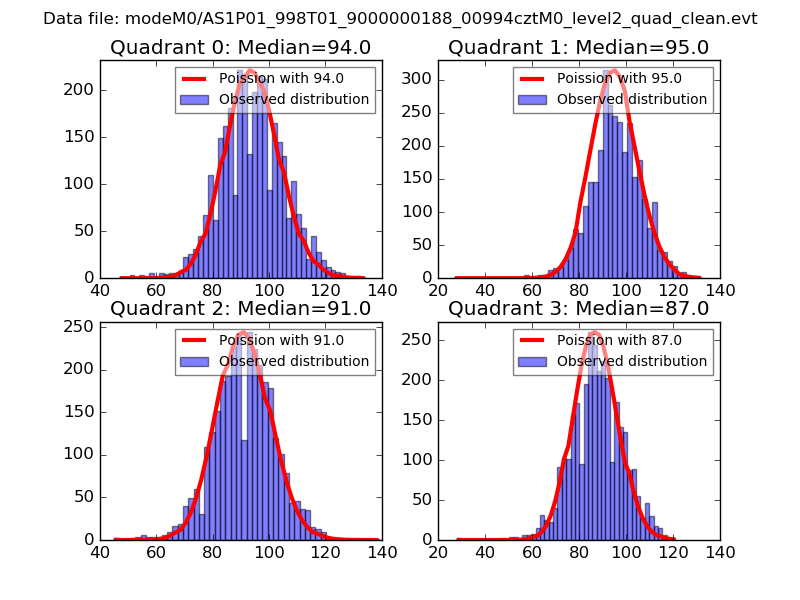 |
 |
| Quadrant-wise count rates Data is divided into 100 sec bins |
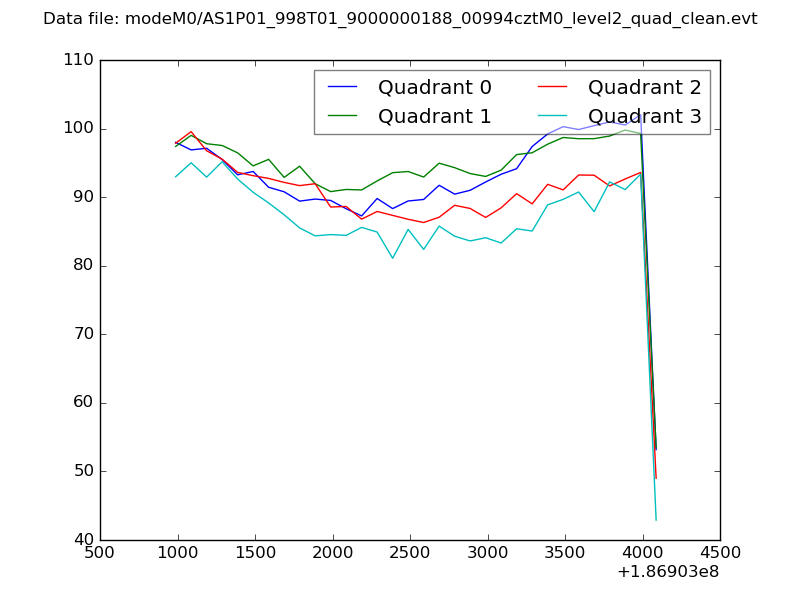 |
|
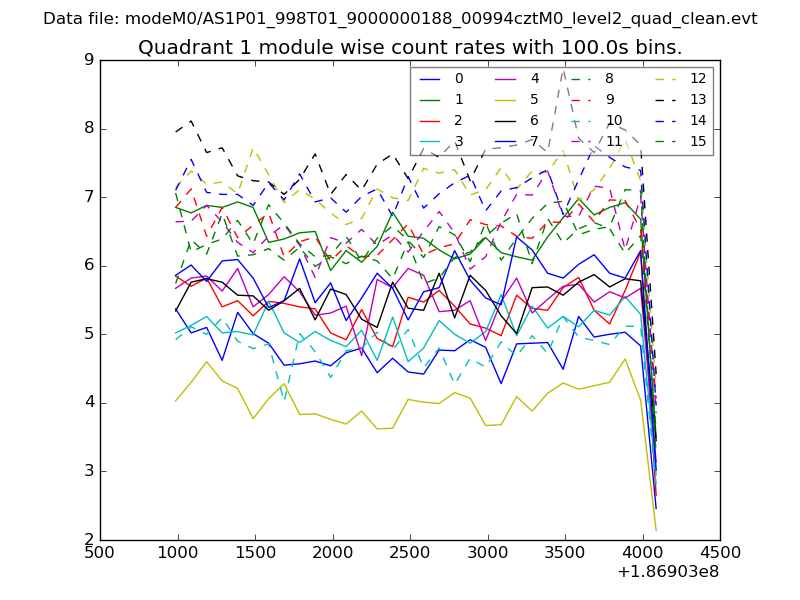
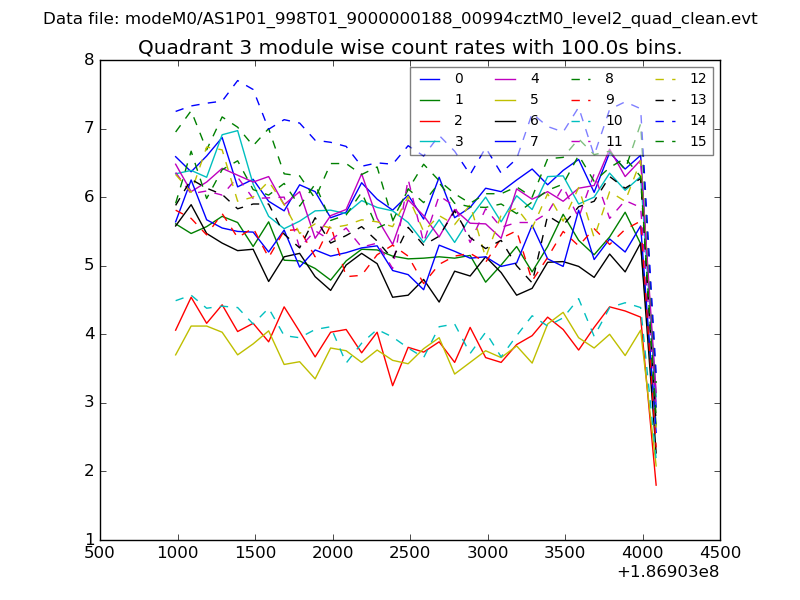
| Module-wise count rates for Quadrant A Data is divided into 100 sec bins |
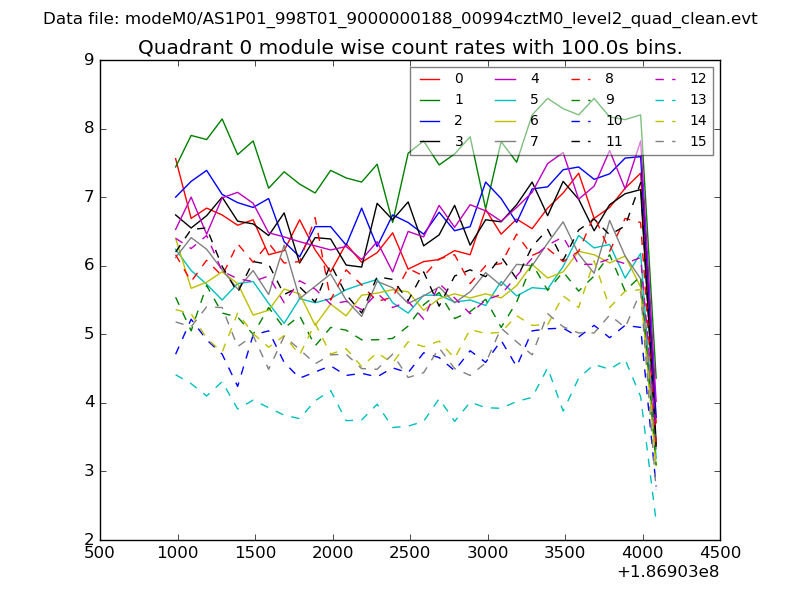 |
 |
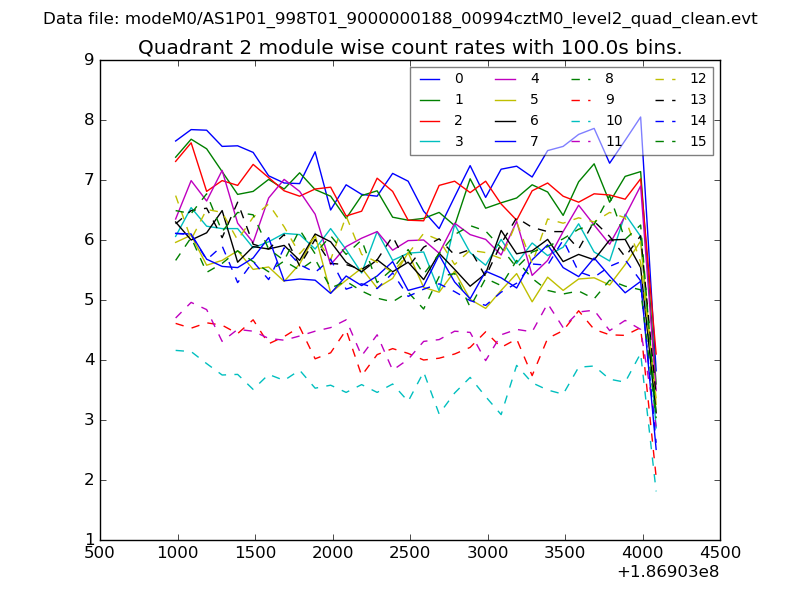
| Module-wise count rates for Quadrant B Data is divided into 100 sec bins |
 |
 |
| Module-wise count rates for Quadrant C Data is divided into 100 sec bins |
 |
 |
| Module-wise count rates for Quadrant D Data is divided into 100 sec bins |
 |
 |
| Parameter | Plot |
|---|---|
| CZT HV Monitor | 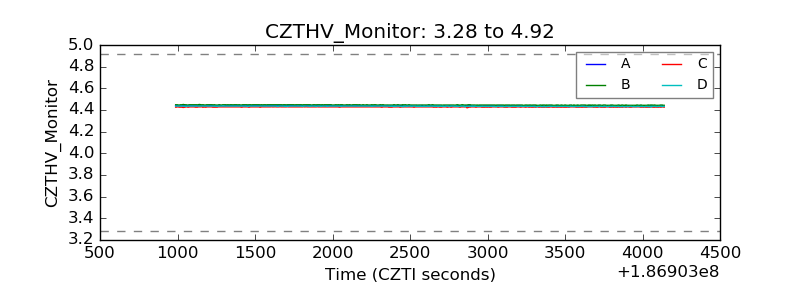 |
| D_VDD | 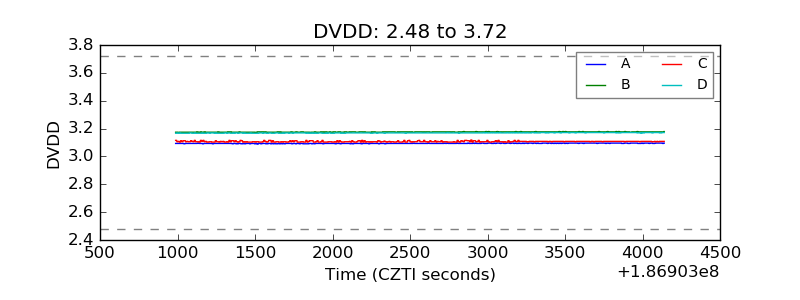 |
| Temperature 1 | 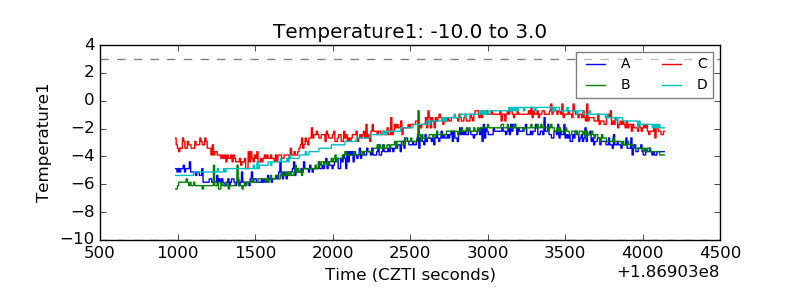 |
| Veto HV Monitor | 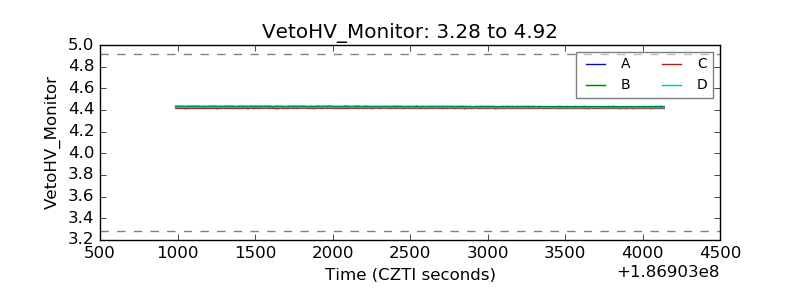 |
| Veto LLD | 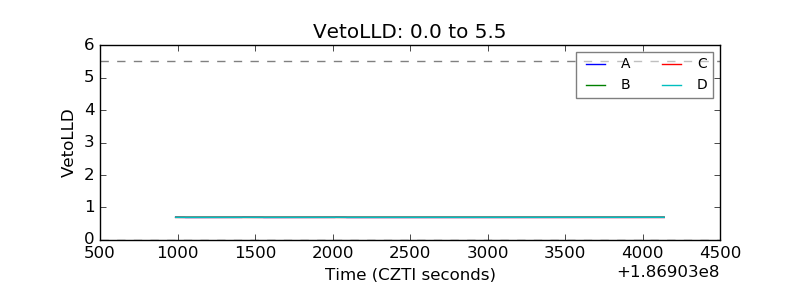 |
| Alpha Counter | 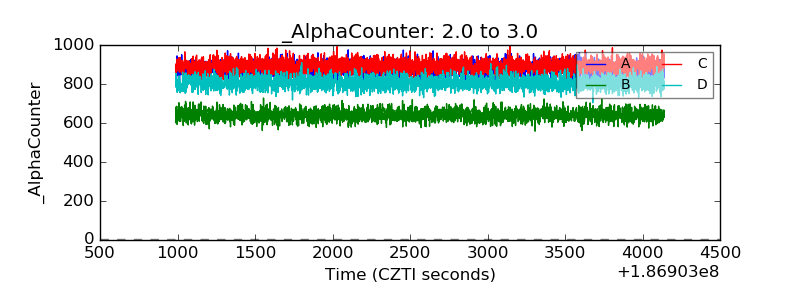 |
| _CPM_Rate | 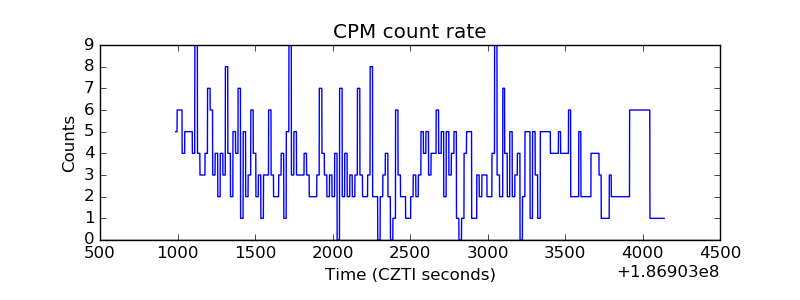 |
| CZT Counter | 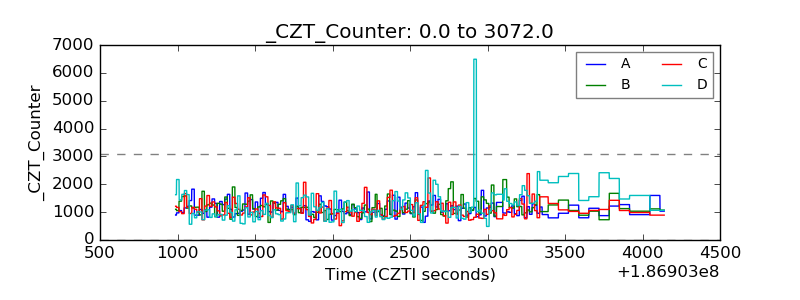 |
| +2.5 Volts monitor |  |
| +5 Volts monitor |  |
| _ROLL_ROT | 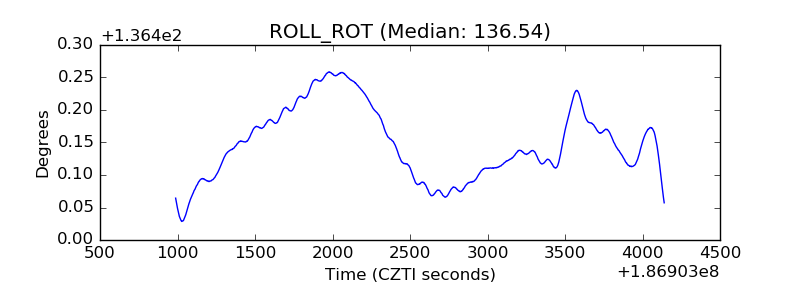 |
| _Roll_DEC | 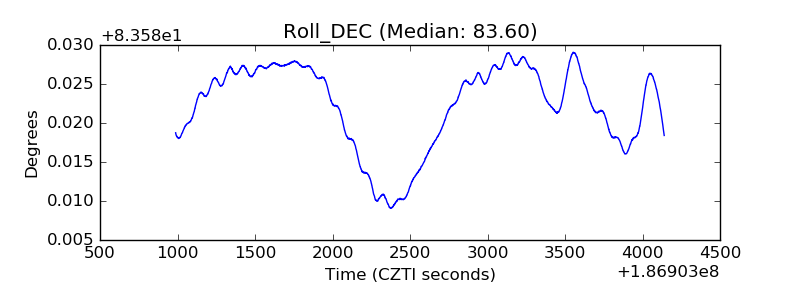 |
| _Roll_RA | 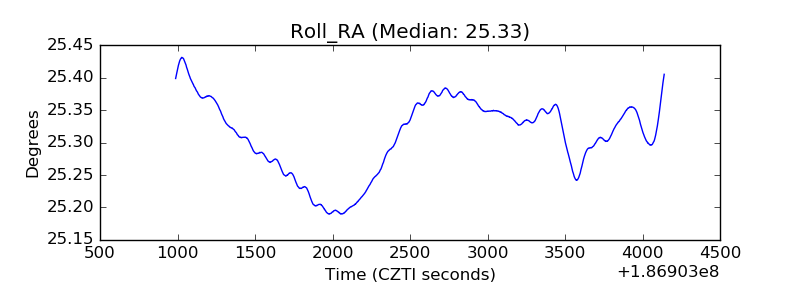 |
| Veto Counter | 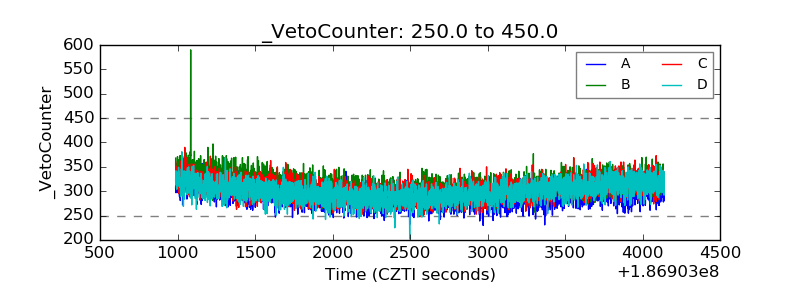 |