| Param | Original file | Final file |
|---|---|---|
| Filename | modeM0/AS1P01_998T02_9000000190cztM0_level2.fits | modeM0/AS1P01_998T02_9000000190cztM0_level2_quad_clean.evt |
| Size (bytes) | 3,403,471,680 | 5,525,625,600 |
| Size | 3.2 GB | 5.1 GB |
| Events in quadrant A | 19,747,116 | 36,760,668 |
| Events in quadrant B | 19,281,348 | 36,562,025 |
| Events in quadrant C | 18,970,378 | 34,039,499 |
| Events in quadrant D | 16,332,960 | 31,284,688 |
| Mode M0 | |||
|---|---|---|---|
| Quadrant | BADHDUFLAG | Total packets | Discarded packets |
| A | 0 | 1760764 | 0 |
| B | 0 | 1839891 | 0 |
| C | 0 | 1836653 | 0 |
| D | 0 | 1768931 | 0 |
| Mode SS | |||
|---|---|---|---|
| Quadrant | BADHDUFLAG | Total packets | Discarded packets |
| A | 0 | 8552 | 0 |
| B | 0 | 8550 | 0 |
| C | 0 | 8552 | 0 |
| D | 0 | 8552 | 0 |
| Mode M9 | |||
|---|---|---|---|
| Quadrant | BADHDUFLAG | Total packets | Discarded packets |
| A | 0 | 604 | 0 |
| B | 0 | 604 | 0 |
| C | 0 | 604 | 0 |
| D | 0 | 604 | 0 |
| Quadrant | Total seconds | Saturated seconds | Saturation percentage |
|---|---|---|---|
| A | 419560 | 1761 | 0.419725% |
| B | 419559 | 2738 | 0.652590% |
| C | 419555 | 6619 | 1.577624% |
| D | 419546 | 11600 | 2.764893% |
Noise dominated data is calculated using 1-second bins in cleaned event files. If a bin has >2000 counts, and if more than 50% of those come from <1% of pixels, then it is considered to be noise-dominated and hence unusable.
| Quadrant | # 1 sec bins | Bins with >0 counts | Bins with >2000 counts | High rate bins dominated by noise | Noise dominated (total time) | Noise dominated (detector-on time) | Marked lightcurve |
|---|---|---|---|---|---|---|---|
| A | 509940 | 419597 | 0 | 0 | 0.00% | 0.00% |  |
| B | 509941 | 419571 | 0 | 0 | 0.00% | 0.00% |  |
| C | 509940 | 419559 | 0 | 0 | 0.00% | 0.00% |  |
| D | 509940 | 417822 | 0 | 0 | 0.00% | 0.00% |  |
Top three noisy pixels from each quadrant. If the there are fewer than three noisy pixels in the level2.evt file, extra rows are filled as -1
| Pixel properties | Quadrant properties | ||||||
|---|---|---|---|---|---|---|---|
| Quadrant | DetID | PixID | Counts | Sigma | Mean | Median | Sigma |
| A | 0 | 29 | 17945 | 11.23 | 5117 | 4774 | 1173.0 |
| A | 7 | 110 | 17925 | 11.21 | 5117 | 4774 | 1173.0 |
| A | 14 | 188 | 14925 | 8.65 | 5117 | 4774 | 1173.0 |
| B | 2 | 9 | 15763 | 12.05 | 5114 | 4862 | 904.4 |
| B | 14 | 254 | 13092 | 9.1 | 5114 | 4862 | 904.4 |
| B | 2 | 8 | 12245 | 8.16 | 5114 | 4862 | 904.4 |
| C | 12 | 241 | 12982 | 6.93 | 5020 | 4644 | 1203.1 |
| C | 2 | 191 | 12784 | 6.77 | 5020 | 4644 | 1203.1 |
| C | 9 | 242 | 12479 | 6.51 | 5020 | 4644 | 1203.1 |
| D | 1 | 19 | 12304 | 7.34 | 4680 | 4293 | 1091.1 |
| D | 6 | 231 | 12001 | 7.06 | 4680 | 4293 | 1091.1 |
| D | 6 | 44 | 11928 | 7.0 | 4680 | 4293 | 1091.1 |
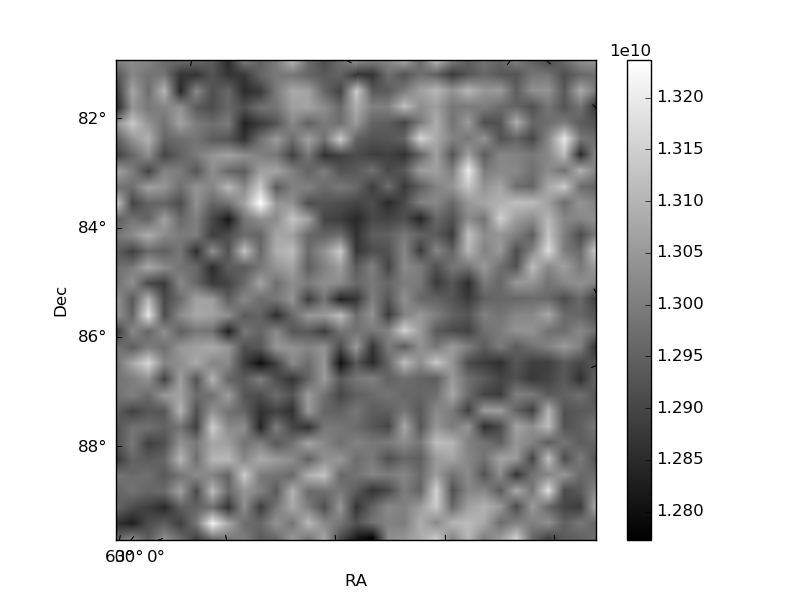
Histogram calculated using DETX and DETY for each event in the final _common_clean file
| Quadrant A | 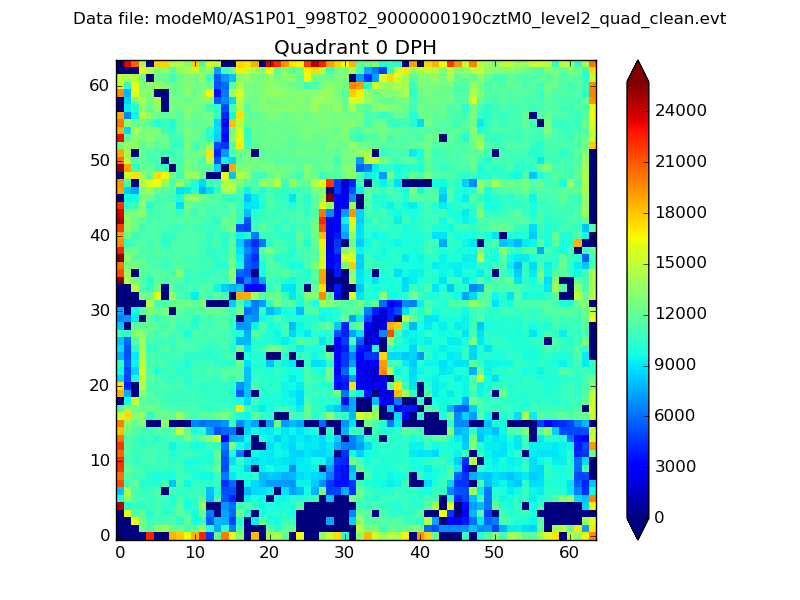 |
 |
Quadrant B |
|---|---|---|---|
| Quadrant D | 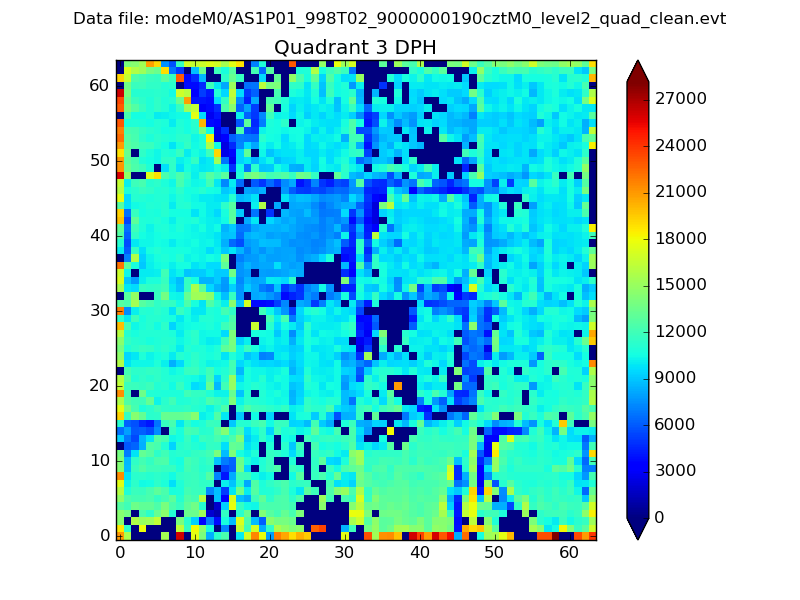 |
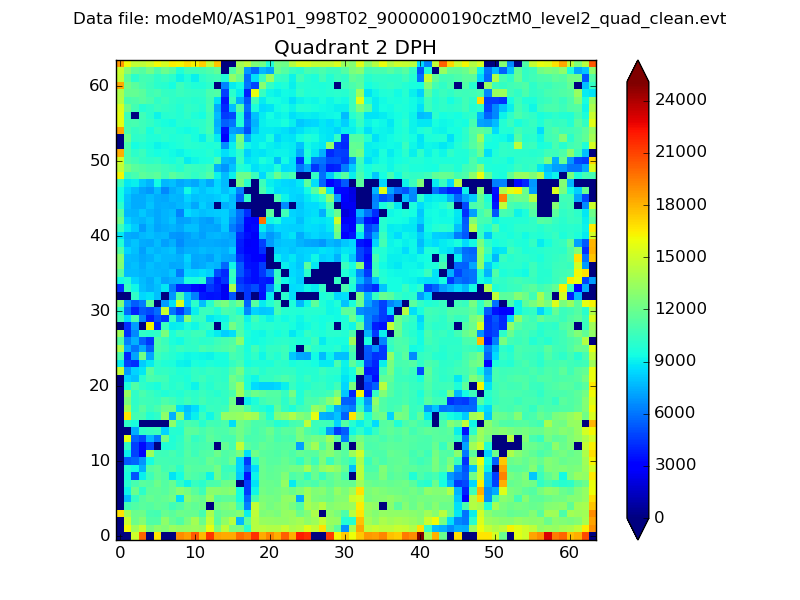 |
Quadrant C |
| Plot type | Count rate plots | Images |
|---|---|---|
| Comparison with Poisson distribution Blue bars denote a histogram of data divided into 1 sec bins. Red curve is a Poisson curve with rate = median count rate of data. |
 |
 |
| Quadrant-wise count rates Data is divided into 100 sec bins |
 |
|
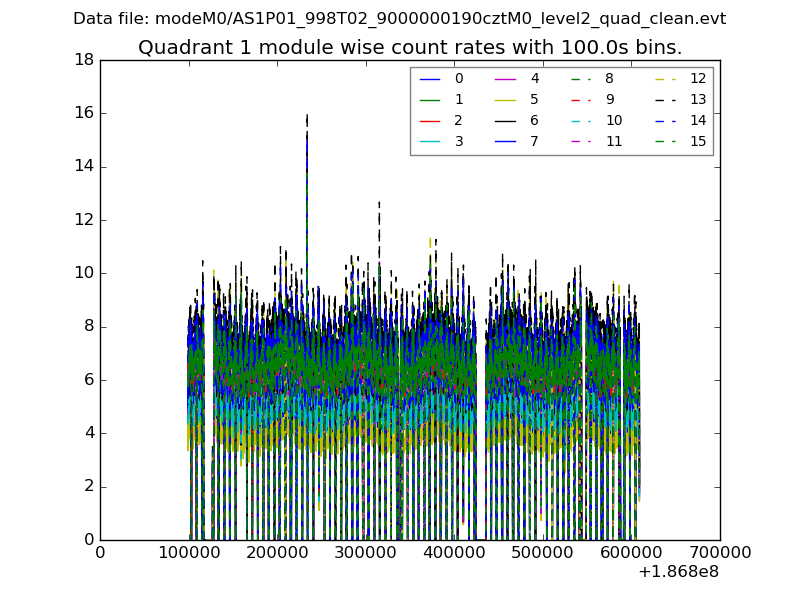
| Module-wise count rates for Quadrant A Data is divided into 100 sec bins |
 |
 |
| Module-wise count rates for Quadrant B Data is divided into 100 sec bins |
 |
 |
| Module-wise count rates for Quadrant C Data is divided into 100 sec bins |
 |
 |
| Module-wise count rates for Quadrant D Data is divided into 100 sec bins |
 |
 |
| Parameter | Plot |
|---|---|
| CZT HV Monitor | 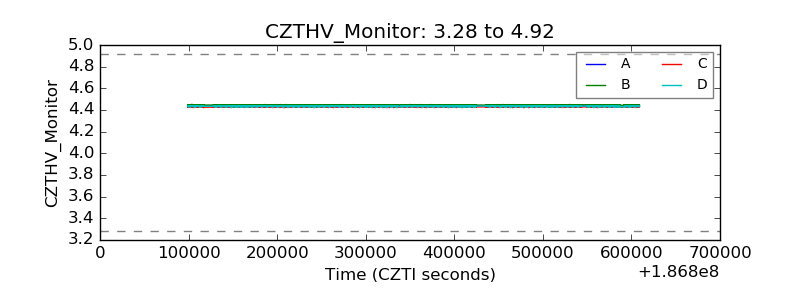 |
| D_VDD |  |
| Temperature 1 |  |
| Veto HV Monitor |  |
| Veto LLD | 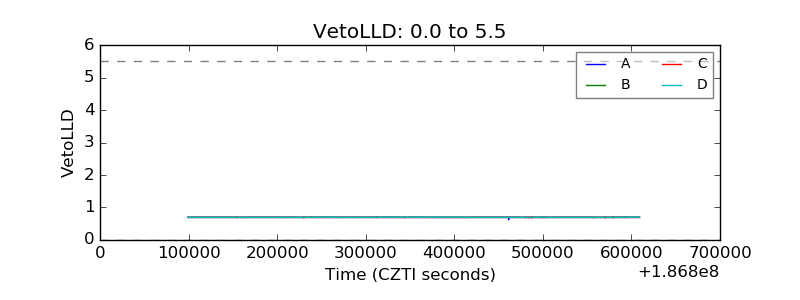 |
| Alpha Counter |  |
| _CPM_Rate |  |
| CZT Counter |  |
| +2.5 Volts monitor |  |
| +5 Volts monitor |  |
| _ROLL_ROT | 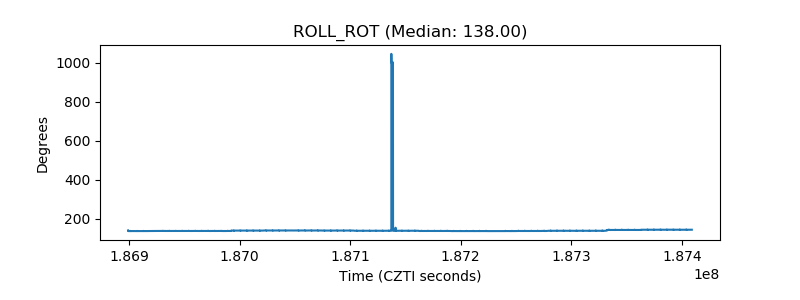 |
| _Roll_DEC | 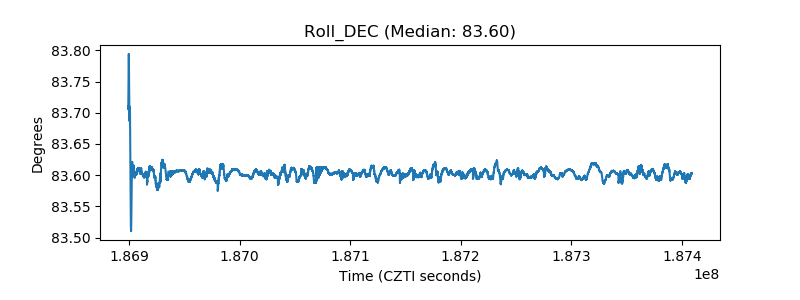 |
| _Roll_RA | 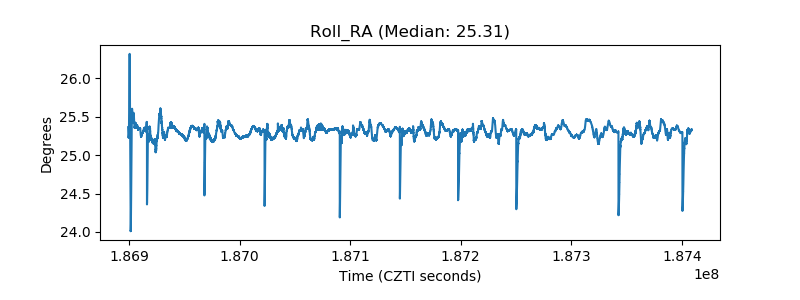 |
| Veto Counter |  |