| Param | Original file | Final file |
|---|---|---|
| Filename | modeM0/AS1P01_998T02_9000000190_00993cztM0_level2.evt | modeM0/AS1P01_998T02_9000000190_00993cztM0_level2_quad_clean.evt |
| Size (bytes) | 802,644,480 | 81,057,600 |
| Size | 765.5 MB | 77.3 MB |
| Events in quadrant A | 5,741,658 | 537,071 |
| Events in quadrant B | 6,027,562 | 546,777 |
| Events in quadrant C | 5,780,226 | 523,804 |
| Events in quadrant D | 6,439,395 | 509,472 |
| Mode M0 | |||
|---|---|---|---|
| Quadrant | BADHDUFLAG | Total packets | Discarded packets |
| A | 0 | 20496 | 1 |
| B | 0 | 21298 | 1 |
| C | 0 | 20596 | 1 |
| D | 0 | 22583 | 4 |
| Mode SS | |||
|---|---|---|---|
| Quadrant | BADHDUFLAG | Total packets | Discarded packets |
| A | 0 | 100 | 0 |
| B | 0 | 100 | 0 |
| C | 0 | 100 | 0 |
| D | 0 | 100 | 0 |
| Mode M9 | |||
|---|---|---|---|
| Quadrant | BADHDUFLAG | Total packets | Discarded packets |
| A | 0 | 8 | 0 |
| B | 0 | 8 | 0 |
| C | 0 | 8 | 0 |
| D | 0 | 8 | 0 |
| Quadrant | Total seconds | Saturated seconds | Saturation percentage |
|---|---|---|---|
| A | 4804 | 14 | 0.291424% |
| B | 4804 | 12 | 0.249792% |
| C | 4804 | 8 | 0.166528% |
| D | 4803 | 69 | 1.436602% |
Noise dominated data is calculated using 1-second bins in cleaned event files. If a bin has >2000 counts, and if more than 50% of those come from <1% of pixels, then it is considered to be noise-dominated and hence unusable.
| Quadrant | # 1 sec bins | Bins with >0 counts | Bins with >2000 counts | High rate bins dominated by noise | Noise dominated (total time) | Noise dominated (detector-on time) | Marked lightcurve |
|---|---|---|---|---|---|---|---|
| A | 5669 | 4805 | 107 | 107 | 1.89% | 2.23% | 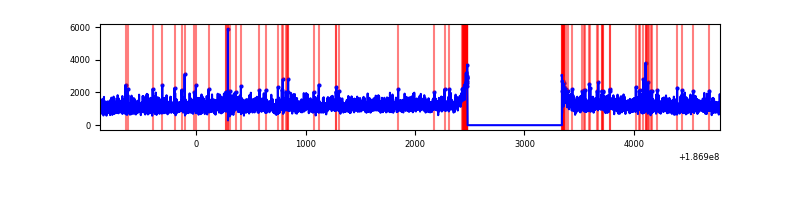 |
| B | 5669 | 4805 | 151 | 151 | 2.66% | 3.14% | 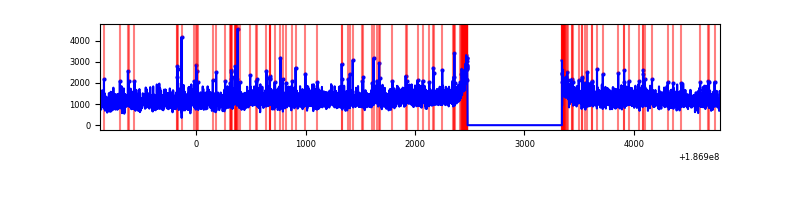 |
| C | 5669 | 4805 | 103 | 103 | 1.82% | 2.14% | 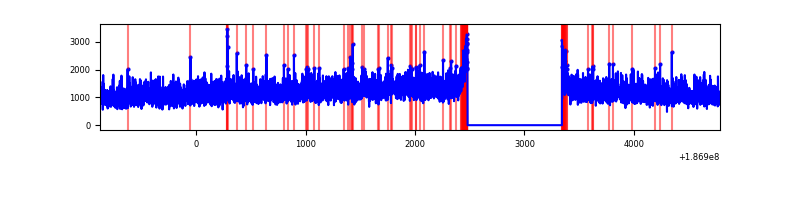 |
| D | 5668 | 4804 | 526 | 526 | 9.28% | 10.95% | 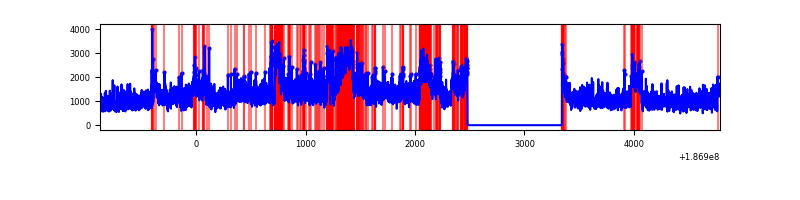 |
Top three noisy pixels from each quadrant. If the there are fewer than three noisy pixels in the level2.evt file, extra rows are filled as -1
| Pixel properties | Quadrant properties | ||||||
|---|---|---|---|---|---|---|---|
| Quadrant | DetID | PixID | Counts | Sigma | Mean | Median | Sigma |
| A | 15 | 233 | 17540 | 44.66 | 1488 | 1497 | 359.2 |
| A | 15 | 127 | 7853 | 17.69 | 1488 | 1497 | 359.2 |
| A | 11 | 79 | 5773 | 11.9 | 1488 | 1497 | 359.2 |
| B | 7 | 221 | 76350 | 204.55 | 1542 | 1546 | 365.7 |
| B | 5 | 249 | 41913 | 110.38 | 1542 | 1546 | 365.7 |
| B | 12 | 52 | 21964 | 55.83 | 1542 | 1546 | 365.7 |
| C | 15 | 241 | 228139 | 580.39 | 1402 | 1451 | 390.6 |
| C | 3 | 79 | 22284 | 53.34 | 1402 | 1451 | 390.6 |
| C | 3 | 111 | 21871 | 52.28 | 1402 | 1451 | 390.6 |
| D | 12 | 188 | 941226 | 2271.13 | 1367 | 1415 | 413.8 |
| D | 1 | 83 | 185556 | 444.99 | 1367 | 1415 | 413.8 |
| D | 1 | 4 | 109137 | 260.32 | 1367 | 1415 | 413.8 |
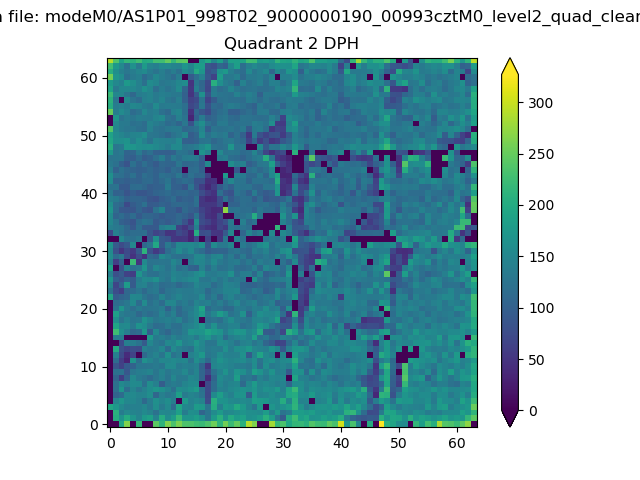
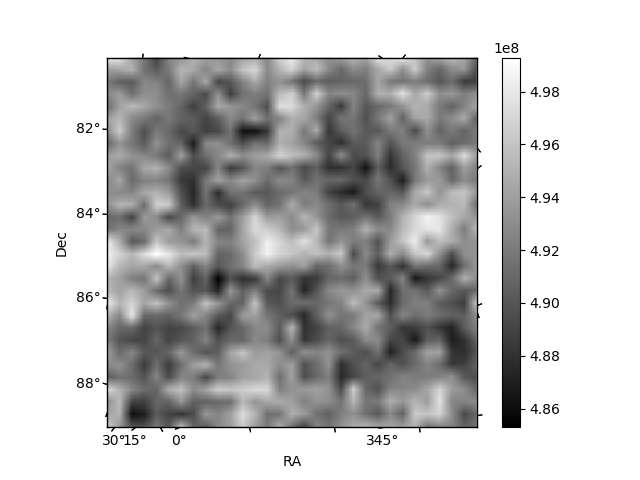
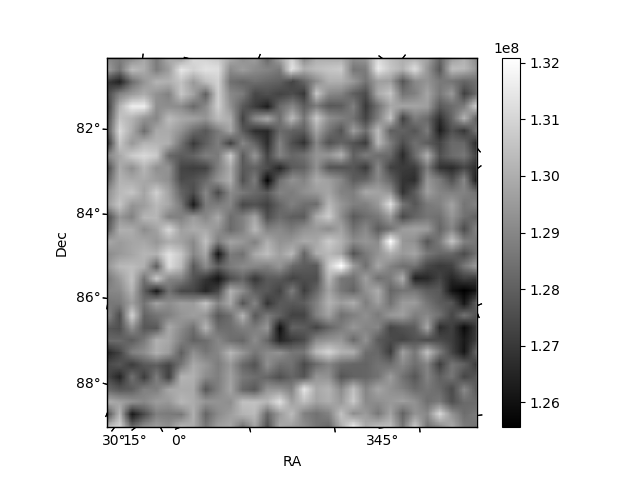
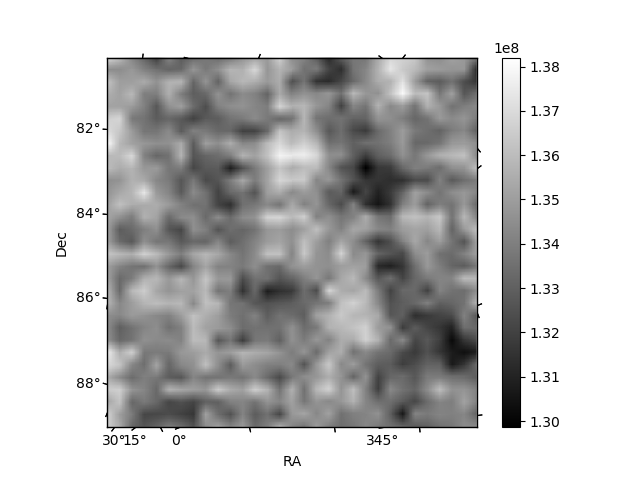
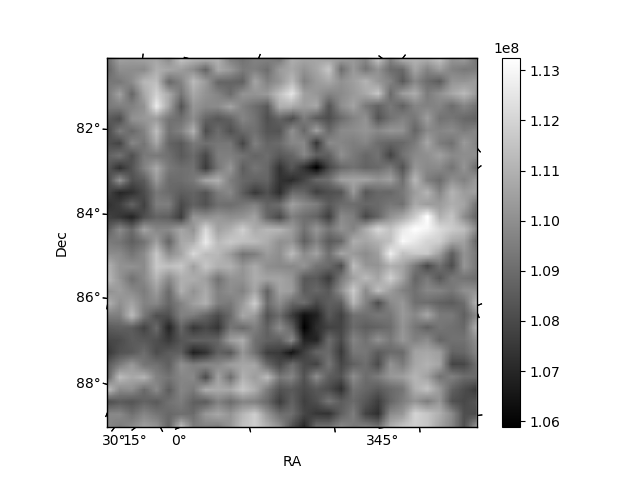
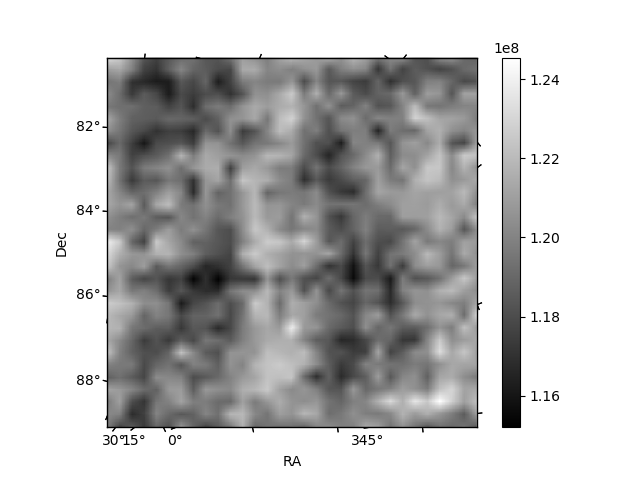
Histogram calculated using DETX and DETY for each event in the final _common_clean file
| Quadrant A | 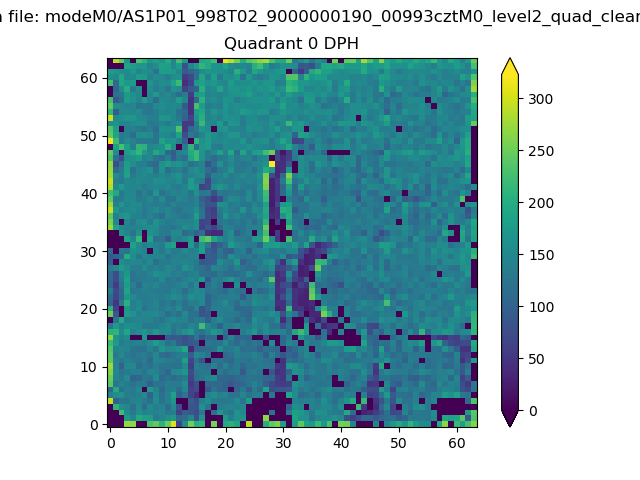 |
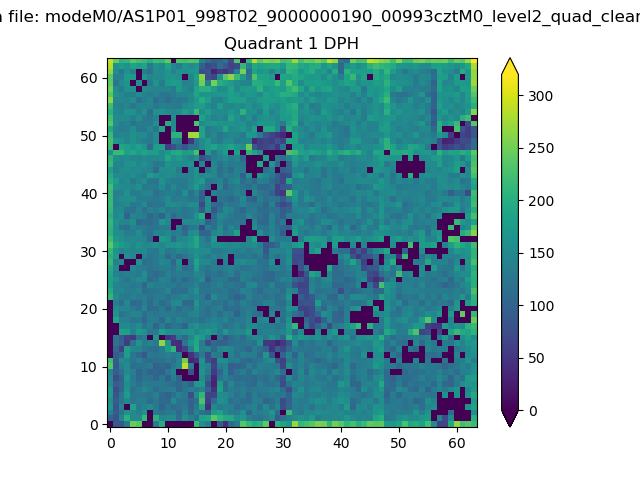 |
Quadrant B |
|---|---|---|---|
| Quadrant D | 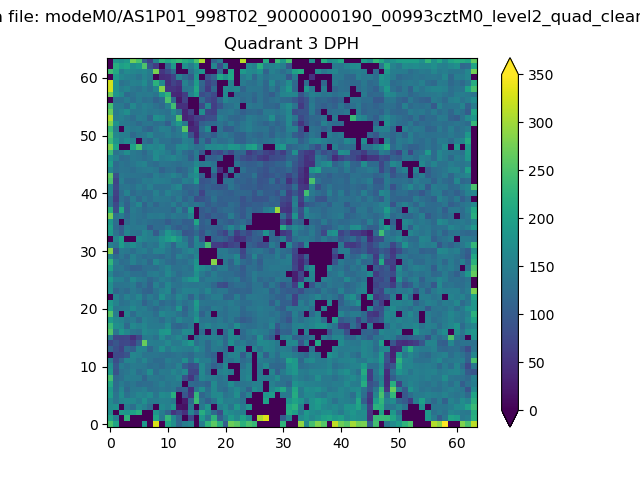 |
 |
Quadrant C |
| Plot type | Count rate plots | Images |
|---|---|---|
| Comparison with Poisson distribution Blue bars denote a histogram of data divided into 1 sec bins. Red curve is a Poisson curve with rate = median count rate of data. |
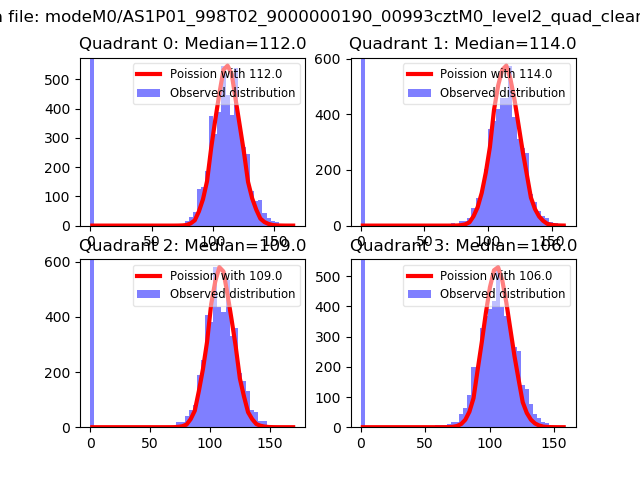 |
 |
| Quadrant-wise count rates Data is divided into 100 sec bins |
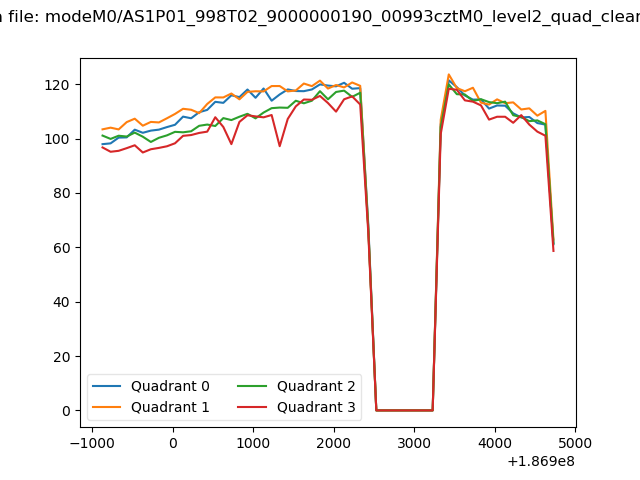 |
|
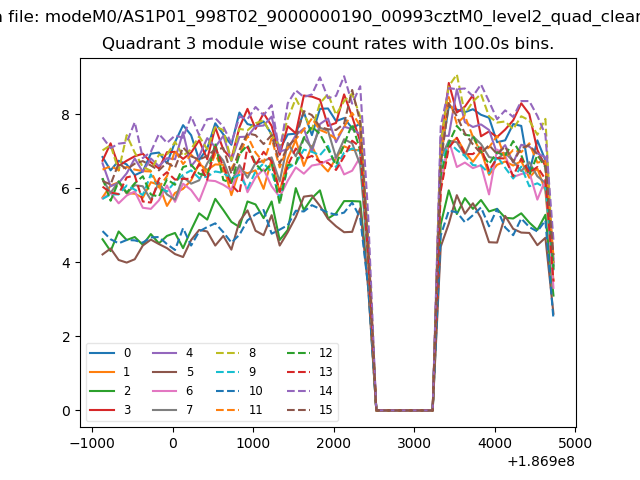
| Module-wise count rates for Quadrant A Data is divided into 100 sec bins |
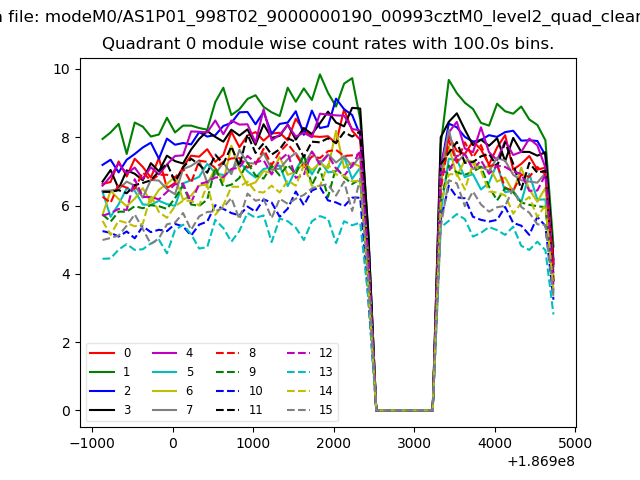 |
 |
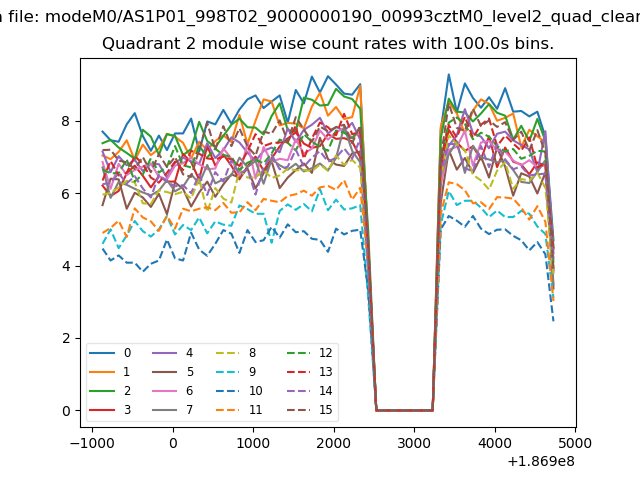
| Module-wise count rates for Quadrant B Data is divided into 100 sec bins |
 |
 |
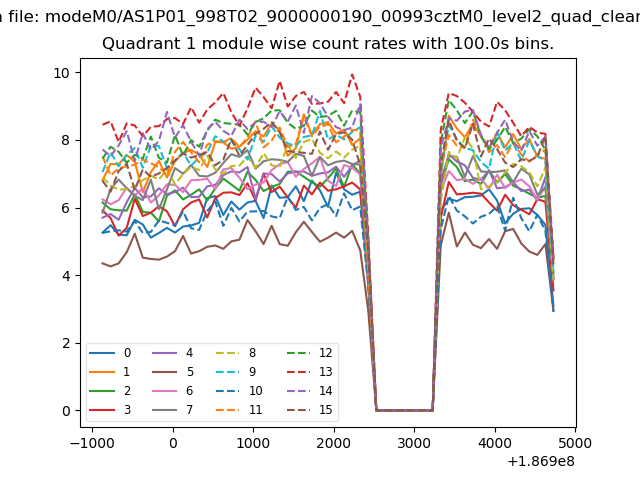
| Module-wise count rates for Quadrant C Data is divided into 100 sec bins |
 |
 |
| Module-wise count rates for Quadrant D Data is divided into 100 sec bins |
 |
 |
| Parameter | Plot |
|---|---|
| CZT HV Monitor | 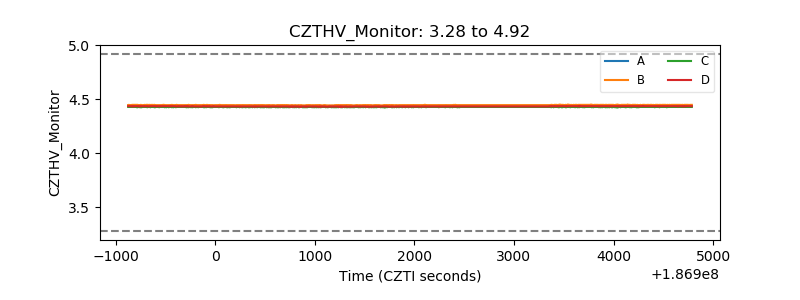 |
| D_VDD | 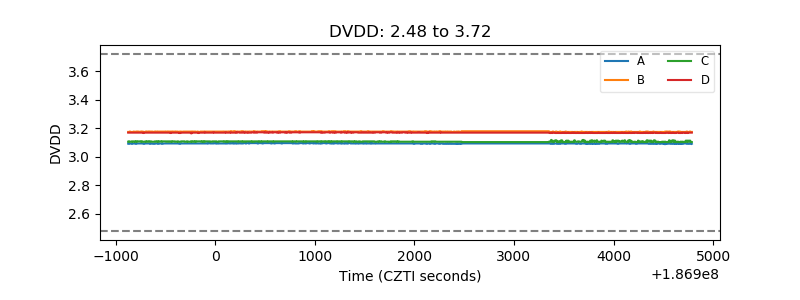 |
| Temperature 1 | 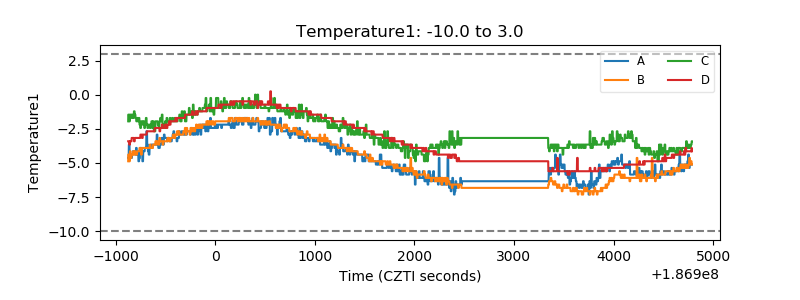 |
| Veto HV Monitor | 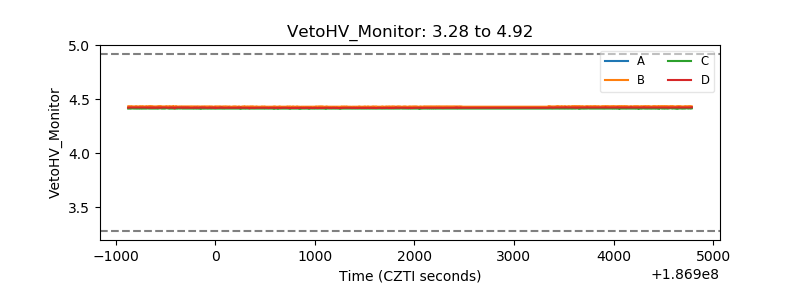 |
| Veto LLD |  |
| Alpha Counter | 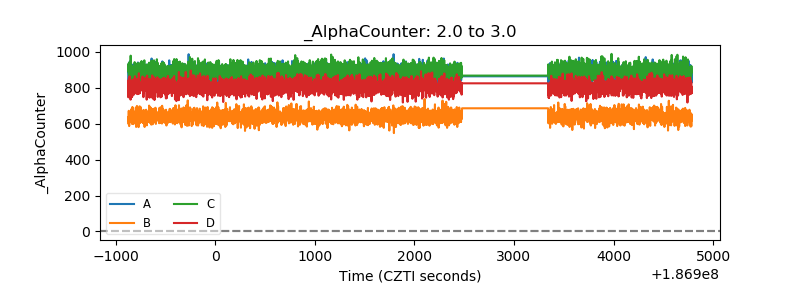 |
| _CPM_Rate | 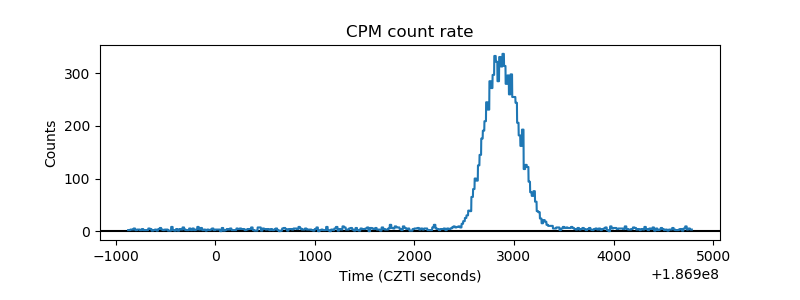 |
| CZT Counter | 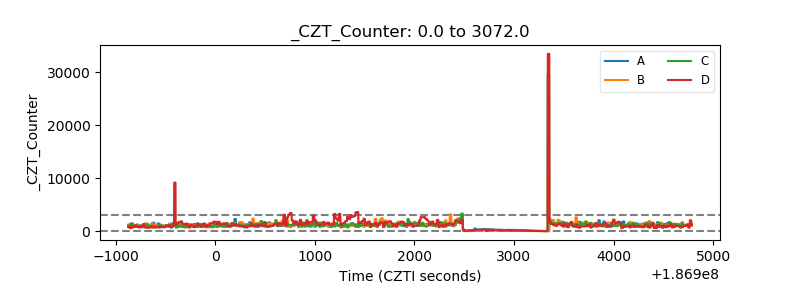 |
| +2.5 Volts monitor |  |
| +5 Volts monitor | 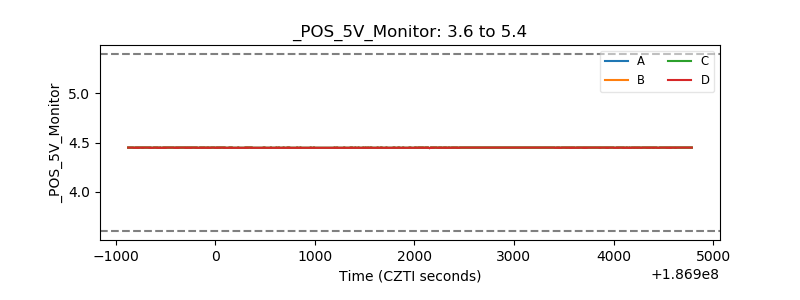 |
| _ROLL_ROT |  |
| _Roll_DEC | 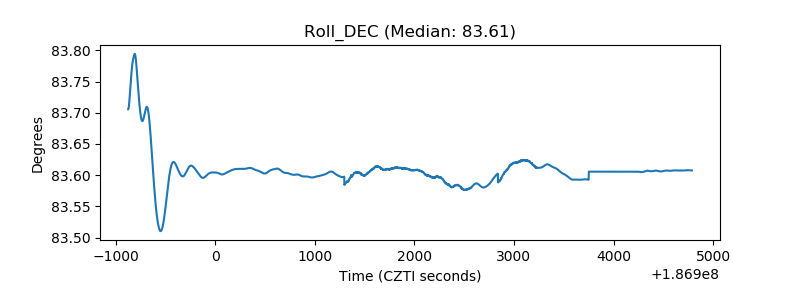 |
| _Roll_RA | 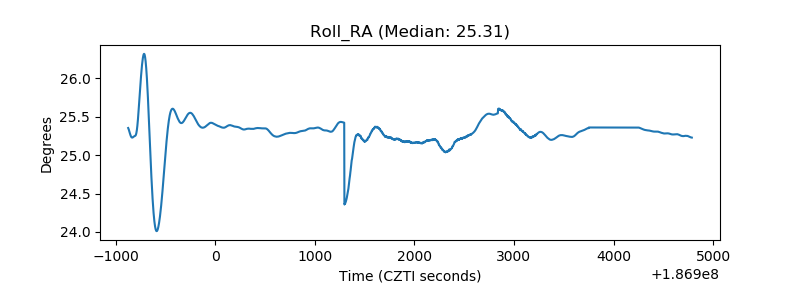 |
| Veto Counter | 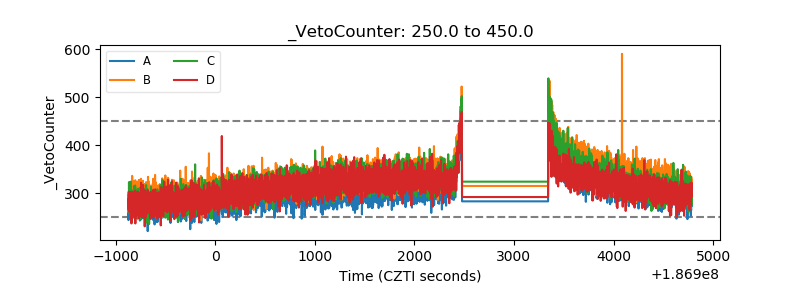 |