| Param | Original file | Final file |
|---|---|---|
| Filename | modeM0/AS1P01_998T02_9000000190_00996cztM0_level2.evt | modeM0/AS1P01_998T02_9000000190_00996cztM0_level2_quad_clean.evt |
| Size (bytes) | 995,008,320 | 108,740,160 |
| Size | 948.9 MB | 103.7 MB |
| Events in quadrant A | 7,756,535 | 724,332 |
| Events in quadrant B | 7,810,865 | 737,425 |
| Events in quadrant C | 7,316,098 | 704,455 |
| Events in quadrant D | 6,838,528 | 693,953 |
| Mode M0 | |||
|---|---|---|---|
| Quadrant | BADHDUFLAG | Total packets | Discarded packets |
| A | 0 | 27454 | 1 |
| B | 0 | 27634 | 1 |
| C | 0 | 26134 | 1 |
| D | 0 | 24738 | 3 |
| Mode SS | |||
|---|---|---|---|
| Quadrant | BADHDUFLAG | Total packets | Discarded packets |
| A | 0 | 126 | 0 |
| B | 0 | 126 | 0 |
| C | 0 | 126 | 0 |
| D | 0 | 126 | 0 |
| Mode M9 | |||
|---|---|---|---|
| Quadrant | BADHDUFLAG | Total packets | Discarded packets |
| A | 0 | 11 | 0 |
| B | 0 | 11 | 0 |
| C | 0 | 11 | 0 |
| D | 0 | 11 | 0 |
| Quadrant | Total seconds | Saturated seconds | Saturation percentage |
|---|---|---|---|
| A | 6207 | 122 | 1.965523% |
| B | 6207 | 51 | 0.821653% |
| C | 6207 | 29 | 0.467214% |
| D | 6207 | 59 | 0.950540% |
Noise dominated data is calculated using 1-second bins in cleaned event files. If a bin has >2000 counts, and if more than 50% of those come from <1% of pixels, then it is considered to be noise-dominated and hence unusable.
| Quadrant | # 1 sec bins | Bins with >0 counts | Bins with >2000 counts | High rate bins dominated by noise | Noise dominated (total time) | Noise dominated (detector-on time) | Marked lightcurve |
|---|---|---|---|---|---|---|---|
| A | 7292 | 6208 | 363 | 363 | 4.98% | 5.85% |  |
| B | 7292 | 6208 | 252 | 252 | 3.46% | 4.06% |  |
| C | 7292 | 6208 | 144 | 144 | 1.97% | 2.32% | 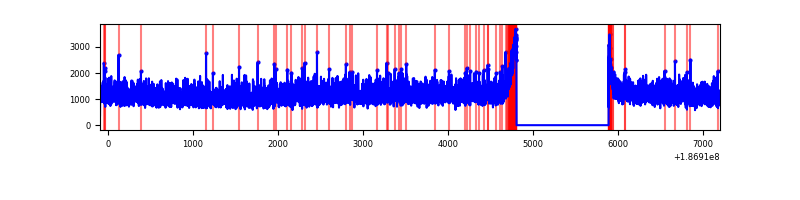 |
| D | 7292 | 6208 | 134 | 134 | 1.84% | 2.16% | 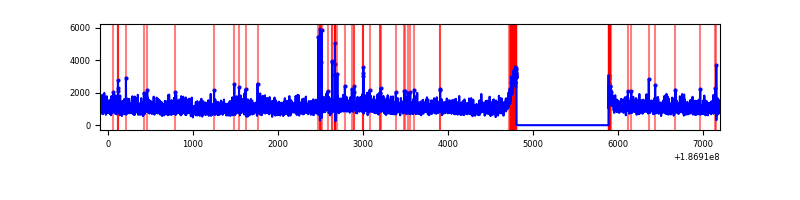 |
Top three noisy pixels from each quadrant. If the there are fewer than three noisy pixels in the level2.evt file, extra rows are filled as -1
| Pixel properties | Quadrant properties | ||||||
|---|---|---|---|---|---|---|---|
| Quadrant | DetID | PixID | Counts | Sigma | Mean | Median | Sigma |
| A | 4 | 2 | 354996 | 764.42 | 1927 | 1942 | 461.9 |
| A | 11 | 242 | 10050 | 17.56 | 1927 | 1942 | 461.9 |
| A | 11 | 79 | 8170 | 13.48 | 1927 | 1942 | 461.9 |
| B | 8 | 234 | 79578 | 164.79 | 1985 | 1992 | 470.8 |
| B | 5 | 249 | 72039 | 148.78 | 1985 | 1992 | 470.8 |
| B | 0 | 220 | 57390 | 117.67 | 1985 | 1992 | 470.8 |
| C | 15 | 241 | 297941 | 595.42 | 1781 | 1838 | 497.3 |
| C | 3 | 111 | 25235 | 47.05 | 1781 | 1838 | 497.3 |
| C | 3 | 79 | 24505 | 45.58 | 1781 | 1838 | 497.3 |
| D | 1 | 4 | 135678 | 257.37 | 1754 | 1798 | 520.2 |
| D | 12 | 188 | 44748 | 82.57 | 1754 | 1798 | 520.2 |
| D | 13 | 170 | 34079 | 62.06 | 1754 | 1798 | 520.2 |
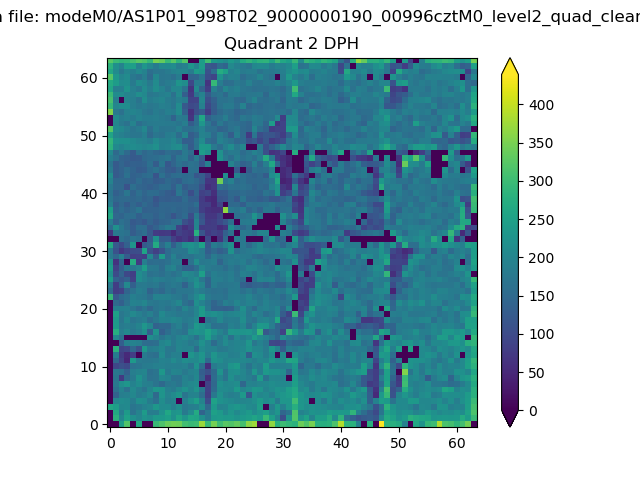
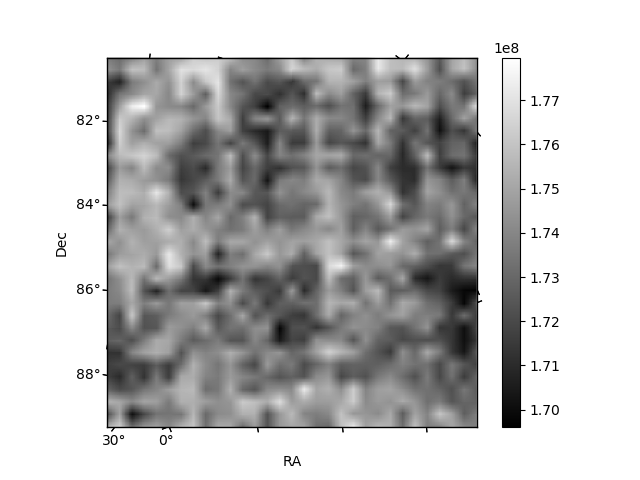
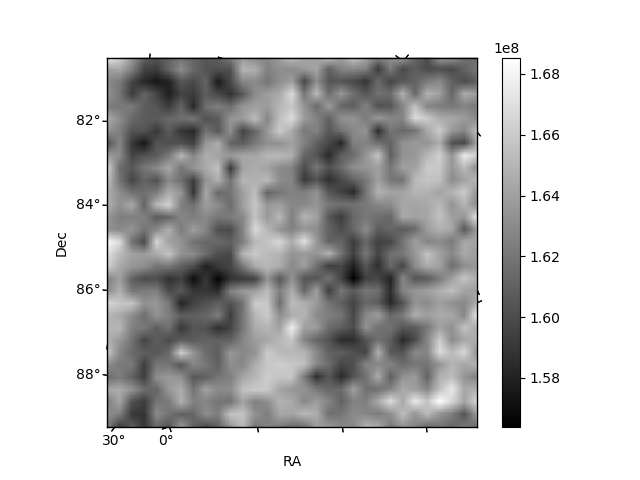
Histogram calculated using DETX and DETY for each event in the final _common_clean file
| Quadrant A | 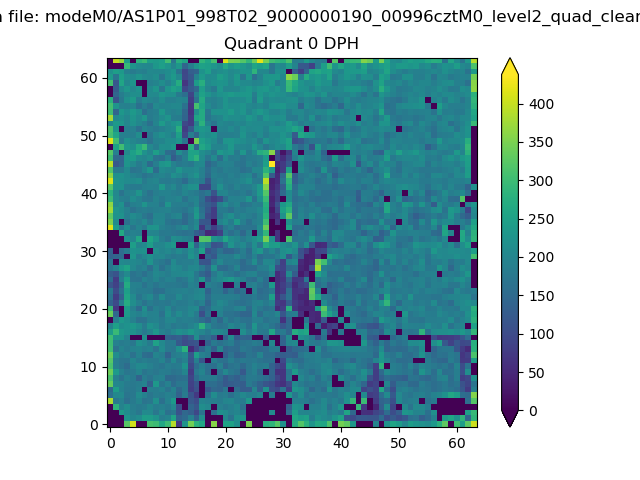 |
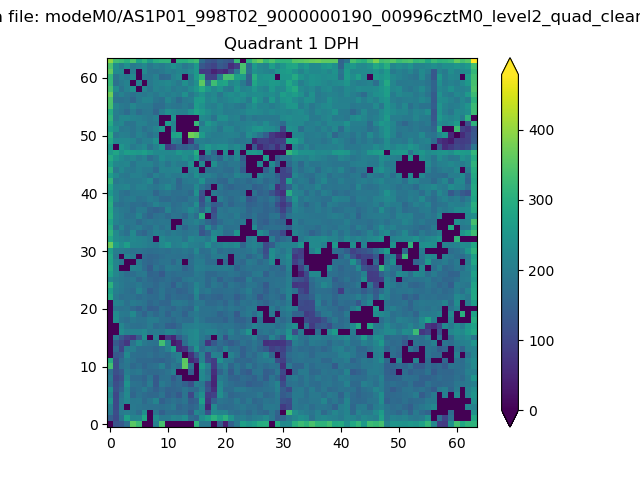 |
Quadrant B |
|---|---|---|---|
| Quadrant D | 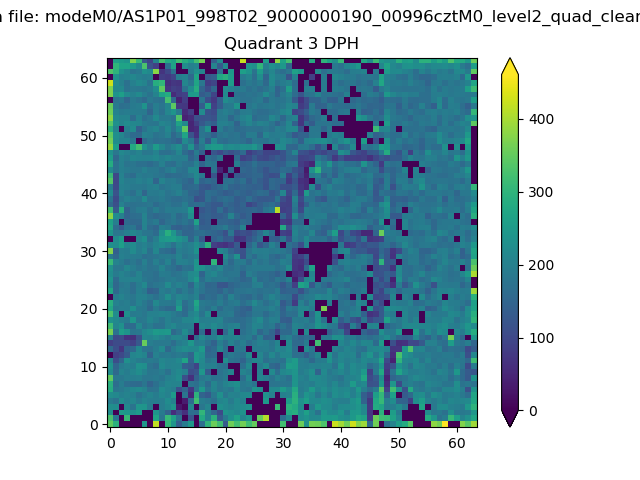 |
 |
Quadrant C |
| Plot type | Count rate plots | Images |
|---|---|---|
| Comparison with Poisson distribution Blue bars denote a histogram of data divided into 1 sec bins. Red curve is a Poisson curve with rate = median count rate of data. |
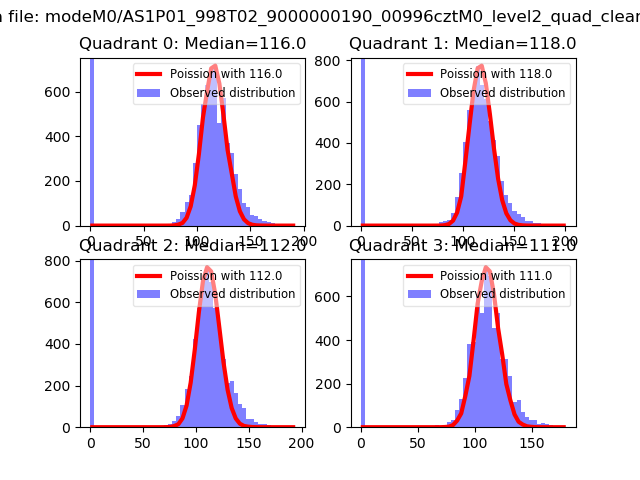 |
 |
| Quadrant-wise count rates Data is divided into 100 sec bins |
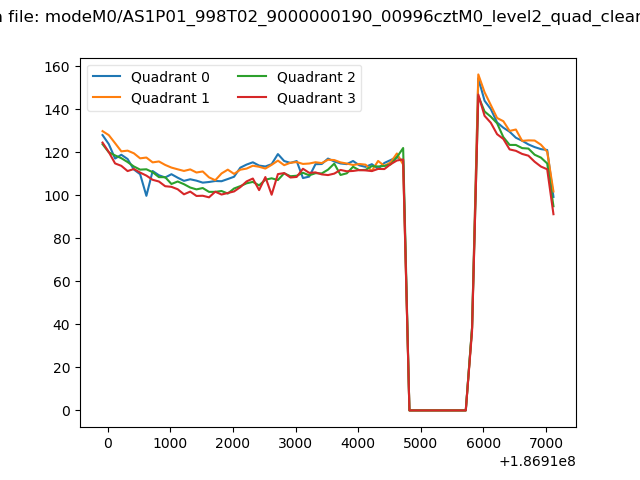 |
|
| Module-wise count rates for Quadrant A Data is divided into 100 sec bins |
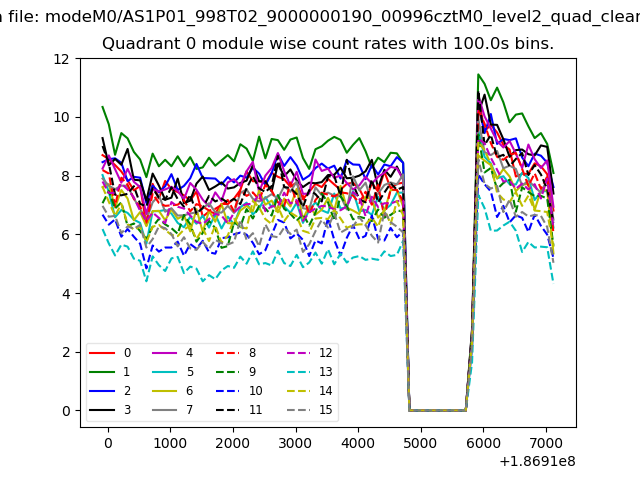 |
 |
| Module-wise count rates for Quadrant B Data is divided into 100 sec bins |
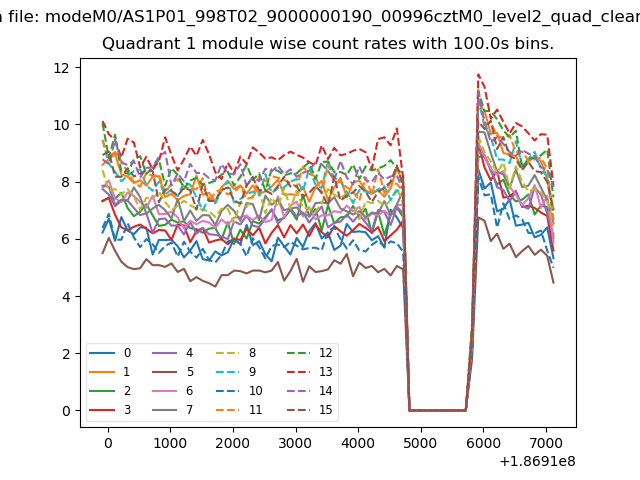 |
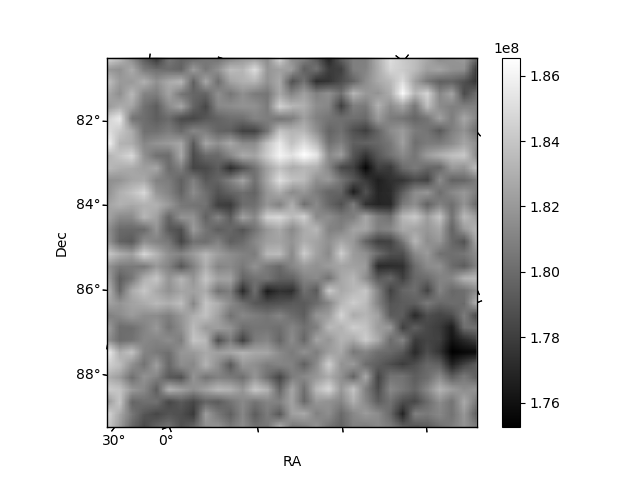 |
| Module-wise count rates for Quadrant C Data is divided into 100 sec bins |
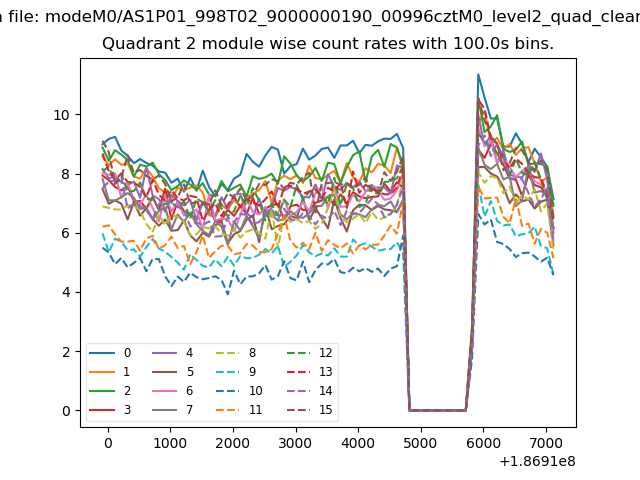 |
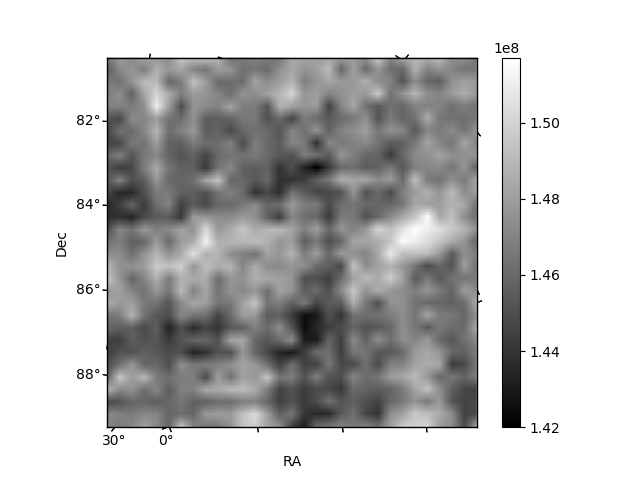 |
| Module-wise count rates for Quadrant D Data is divided into 100 sec bins |
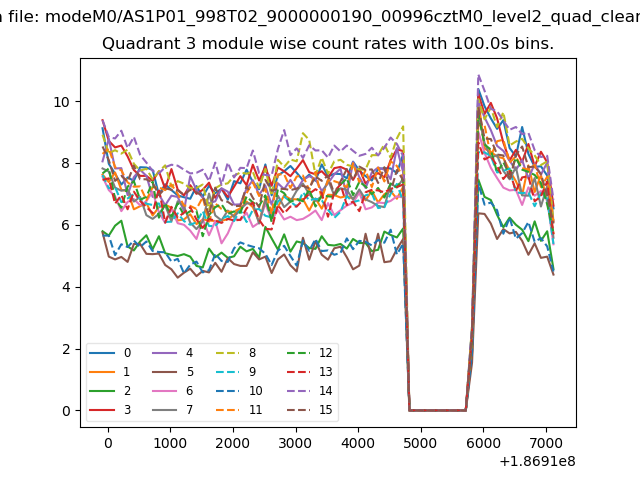 |
 |
| Parameter | Plot |
|---|---|
| CZT HV Monitor | 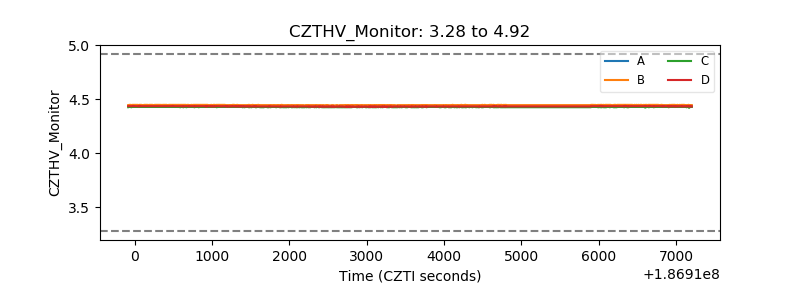 |
| D_VDD | 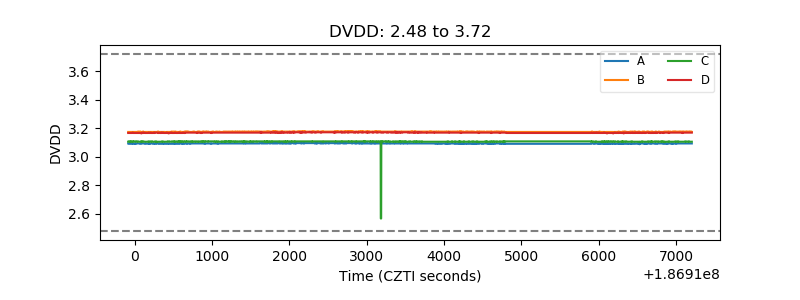 |
| Temperature 1 | 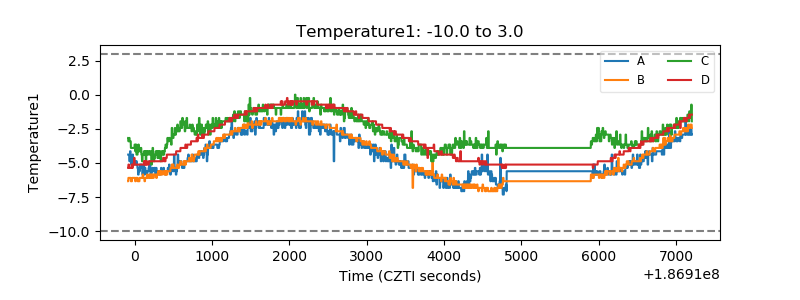 |
| Veto HV Monitor | 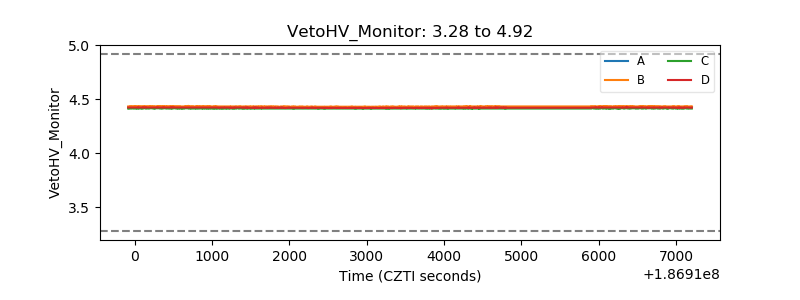 |
| Veto LLD |  |
| Alpha Counter | 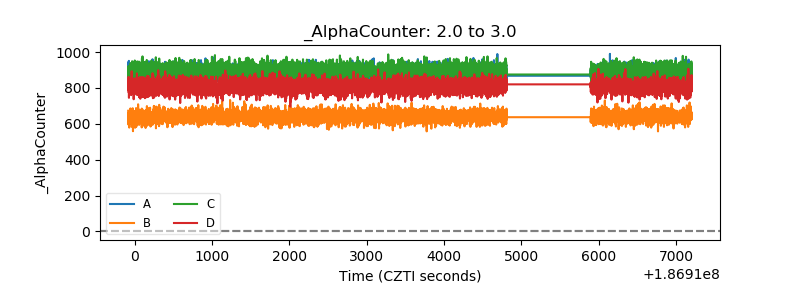 |
| _CPM_Rate | 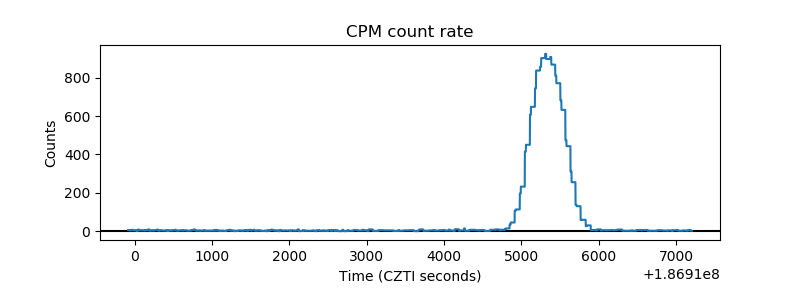 |
| CZT Counter | 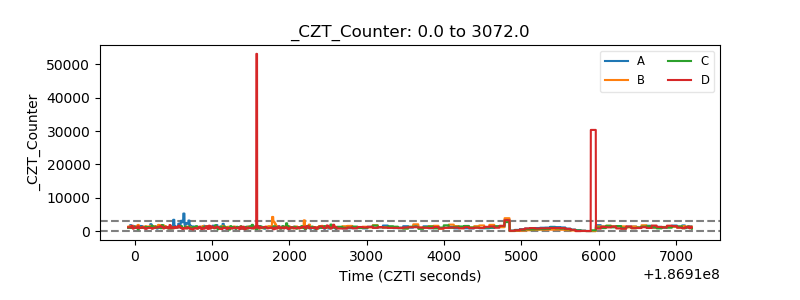 |
| +2.5 Volts monitor |  |
| +5 Volts monitor |  |
| _ROLL_ROT | 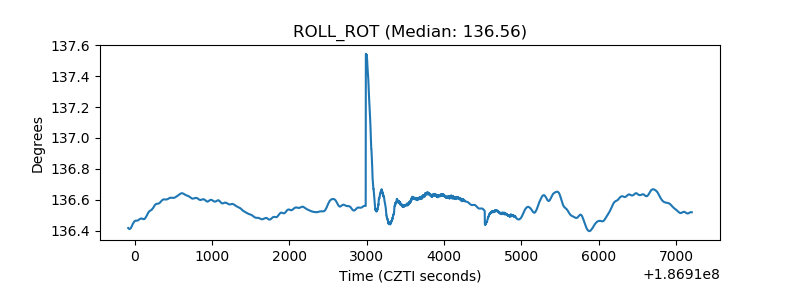 |
| _Roll_DEC | 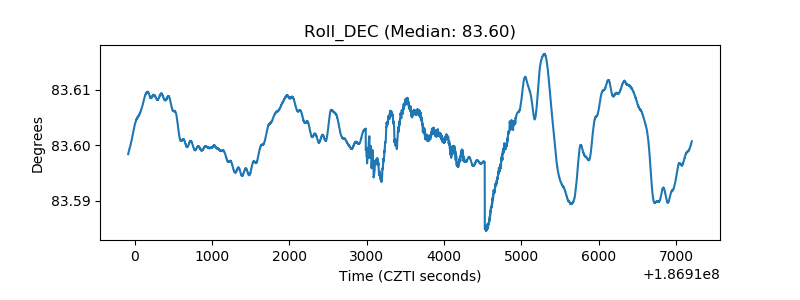 |
| _Roll_RA | 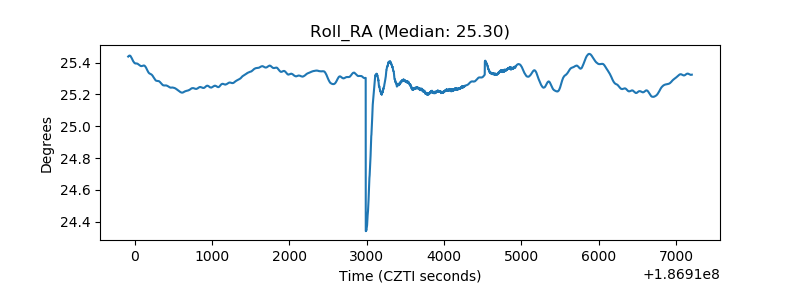 |
| Veto Counter | 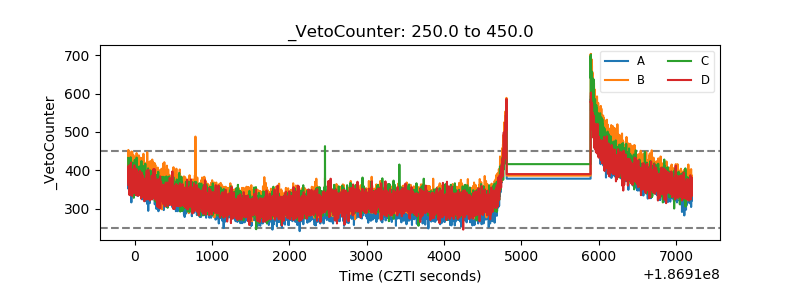 |