| Param | Original file | Final file |
|---|---|---|
| Filename | modeM0/AS1P01_998T02_9000000190_00998cztM0_level2.evt | modeM0/AS1P01_998T02_9000000190_00998cztM0_level2_quad_clean.evt |
| Size (bytes) | 314,654,400 | 33,255,360 |
| Size | 300.1 MB | 31.7 MB |
| Events in quadrant A | 2,439,900 | 223,781 |
| Events in quadrant B | 2,430,982 | 226,897 |
| Events in quadrant C | 2,207,043 | 216,973 |
| Events in quadrant D | 2,334,592 | 212,326 |
| Mode M0 | |||
|---|---|---|---|
| Quadrant | BADHDUFLAG | Total packets | Discarded packets |
| A | 0 | 8479 | 1 |
| B | 0 | 8448 | 1 |
| C | 0 | 7795 | 4 |
| D | 0 | 8176 | 1 |
| Mode SS | |||
|---|---|---|---|
| Quadrant | BADHDUFLAG | Total packets | Discarded packets |
| A | 0 | 36 | 0 |
| B | 0 | 36 | 0 |
| C | 0 | 36 | 0 |
| D | 0 | 36 | 0 |
| Mode M9 | |||
|---|---|---|---|
| Quadrant | BADHDUFLAG | Total packets | Discarded packets |
| A | 0 | 12 | 0 |
| B | 0 | 12 | 0 |
| C | 0 | 12 | 0 |
| D | 0 | 12 | 0 |
| Quadrant | Total seconds | Saturated seconds | Saturation percentage |
|---|---|---|---|
| A | 1729 | 73 | 4.222094% |
| B | 1729 | 67 | 3.875072% |
| C | 1728 | 47 | 2.719907% |
| D | 1729 | 48 | 2.776171% |
Noise dominated data is calculated using 1-second bins in cleaned event files. If a bin has >2000 counts, and if more than 50% of those come from <1% of pixels, then it is considered to be noise-dominated and hence unusable.
| Quadrant | # 1 sec bins | Bins with >0 counts | Bins with >2000 counts | High rate bins dominated by noise | Noise dominated (total time) | Noise dominated (detector-on time) | Marked lightcurve |
|---|---|---|---|---|---|---|---|
| A | 2949 | 1730 | 149 | 149 | 5.05% | 8.61% |  |
| B | 2949 | 1730 | 131 | 131 | 4.44% | 7.57% |  |
| C | 2948 | 1729 | 84 | 84 | 2.85% | 4.86% | 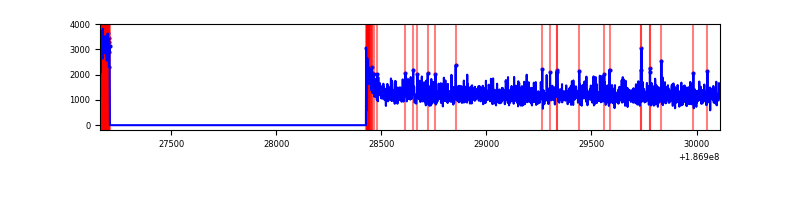 |
| D | 2949 | 1730 | 114 | 114 | 3.87% | 6.59% |  |
Top three noisy pixels from each quadrant. If the there are fewer than three noisy pixels in the level2.evt file, extra rows are filled as -1
| Pixel properties | Quadrant properties | ||||||
|---|---|---|---|---|---|---|---|
| Quadrant | DetID | PixID | Counts | Sigma | Mean | Median | Sigma |
| A | 0 | 253 | 119796 | 814.35 | 600 | 604 | 146.4 |
| A | 12 | 243 | 11328 | 73.27 | 600 | 604 | 146.4 |
| A | 12 | 189 | 2614 | 13.73 | 600 | 604 | 146.4 |
| B | 5 | 6 | 65164 | 450.23 | 599 | 601 | 143.4 |
| B | 5 | 249 | 27429 | 187.09 | 599 | 601 | 143.4 |
| B | 15 | 85 | 17949 | 120.98 | 599 | 601 | 143.4 |
| C | 15 | 241 | 86246 | 569.79 | 538 | 555 | 150.4 |
| C | 3 | 79 | 7496 | 46.15 | 538 | 555 | 150.4 |
| C | 3 | 111 | 7266 | 44.62 | 538 | 555 | 150.4 |
| D | 1 | 4 | 249468 | 1420.14 | 555 | 571 | 175.3 |
| D | 13 | 170 | 3515 | 16.8 | 555 | 571 | 175.3 |
| D | 12 | 188 | 3468 | 16.53 | 555 | 571 | 175.3 |
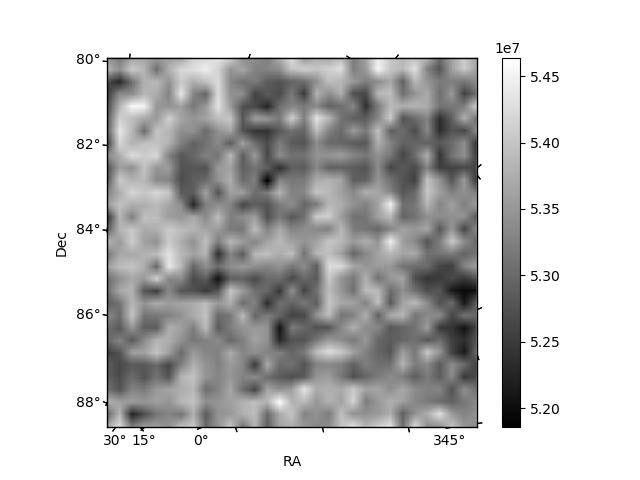
Histogram calculated using DETX and DETY for each event in the final _common_clean file
| Quadrant A | 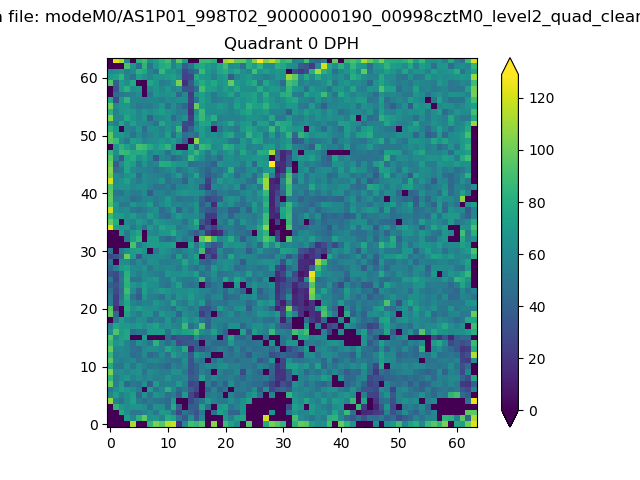 |
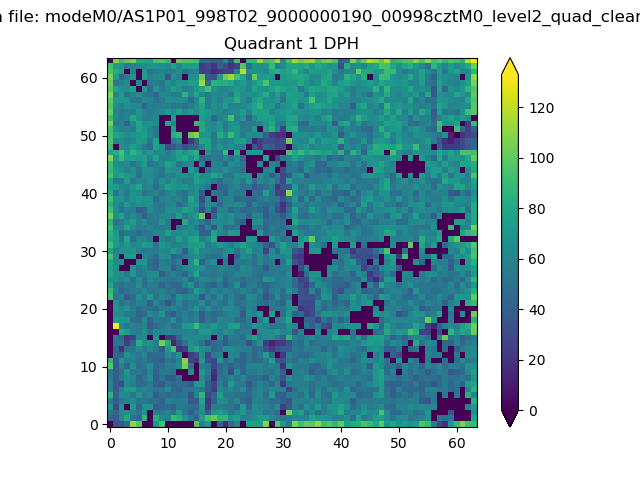 |
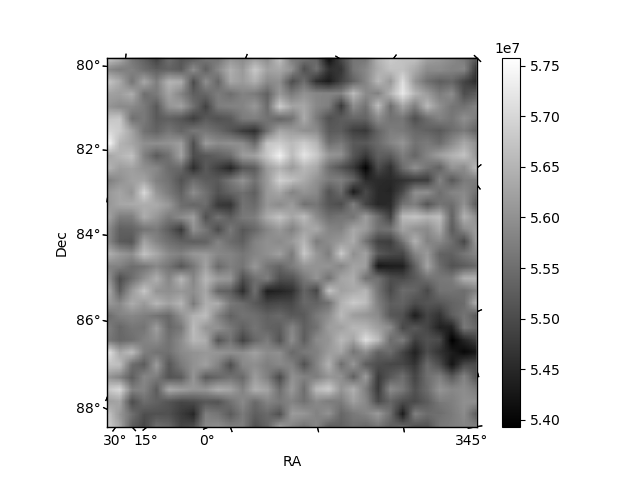
Quadrant B |
|---|---|---|---|
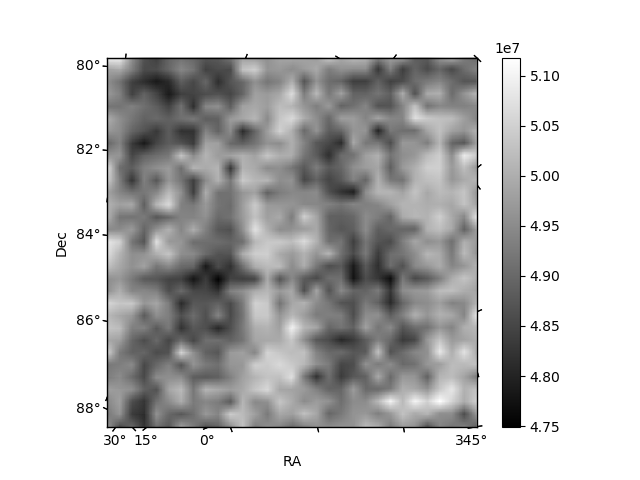
| Quadrant D | 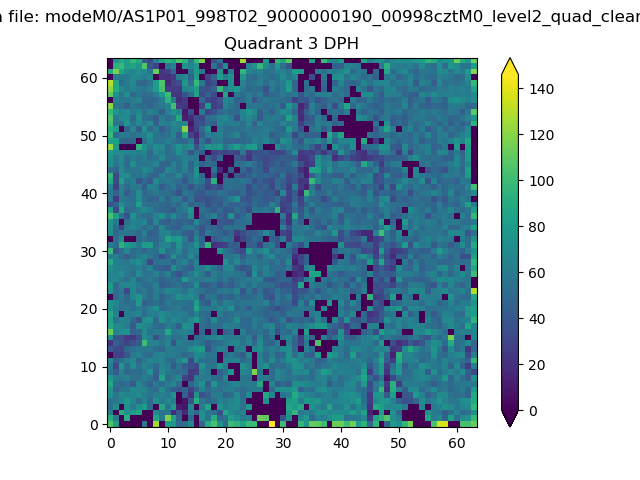 |
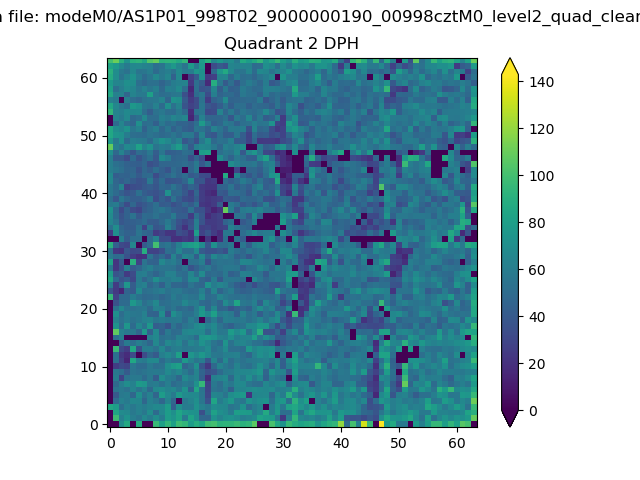 |
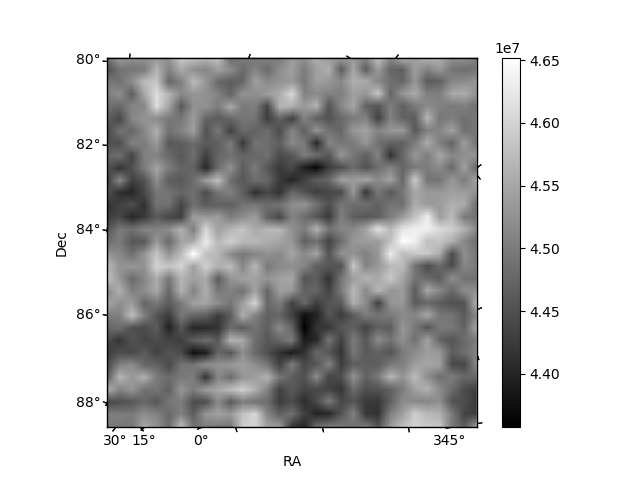
Quadrant C |
| Plot type | Count rate plots | Images |
|---|---|---|
| Comparison with Poisson distribution Blue bars denote a histogram of data divided into 1 sec bins. Red curve is a Poisson curve with rate = median count rate of data. |
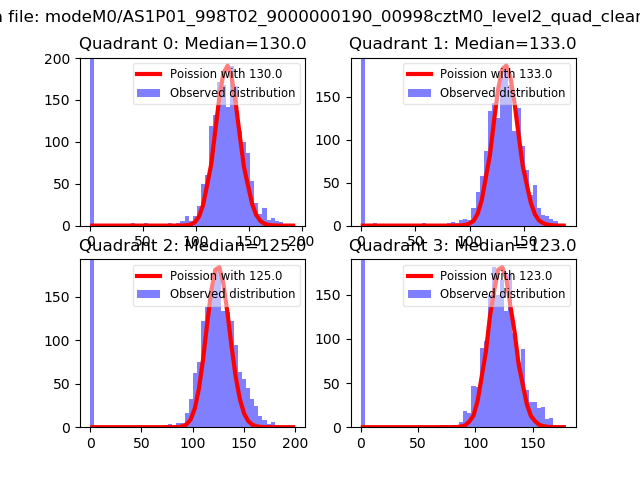 |
 |
| Quadrant-wise count rates Data is divided into 100 sec bins |
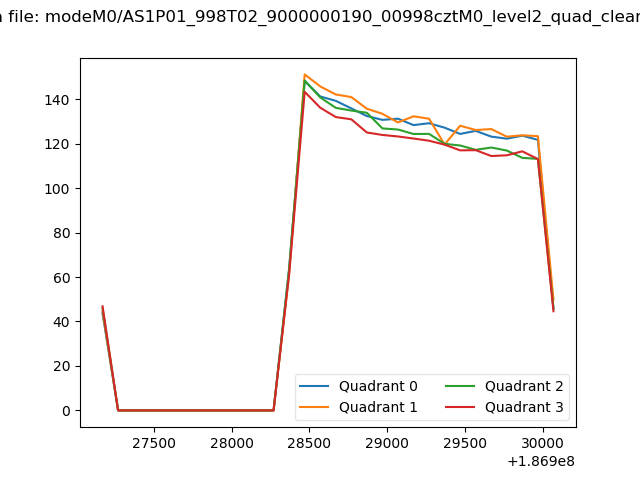 |
|
| Module-wise count rates for Quadrant A Data is divided into 100 sec bins |
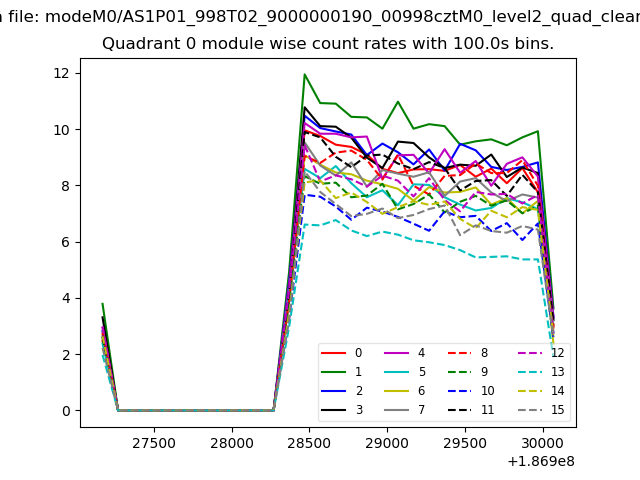 |
 |
| Module-wise count rates for Quadrant B Data is divided into 100 sec bins |
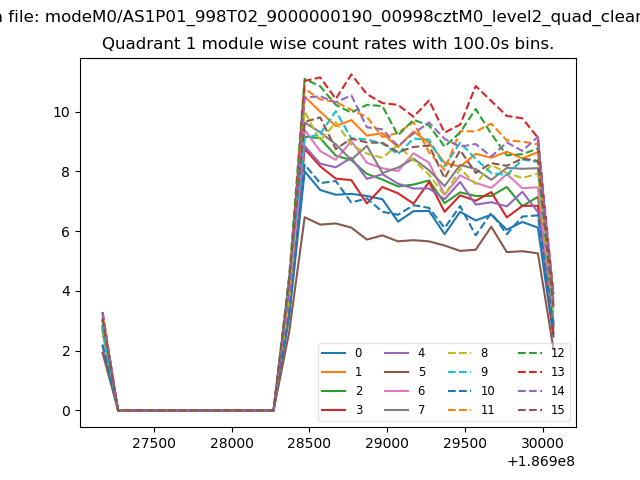 |
 |
| Module-wise count rates for Quadrant C Data is divided into 100 sec bins |
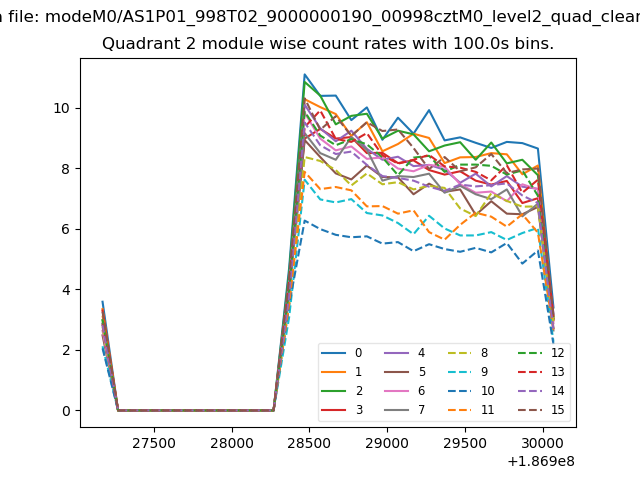 |
 |
| Module-wise count rates for Quadrant D Data is divided into 100 sec bins |
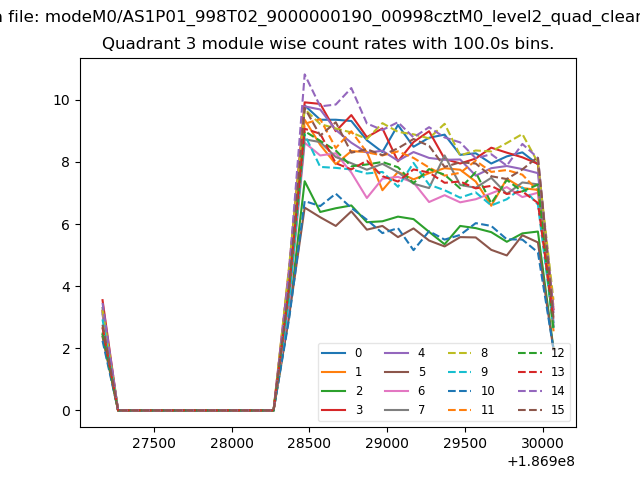 |
 |
| Parameter | Plot |
|---|---|
| CZT HV Monitor | 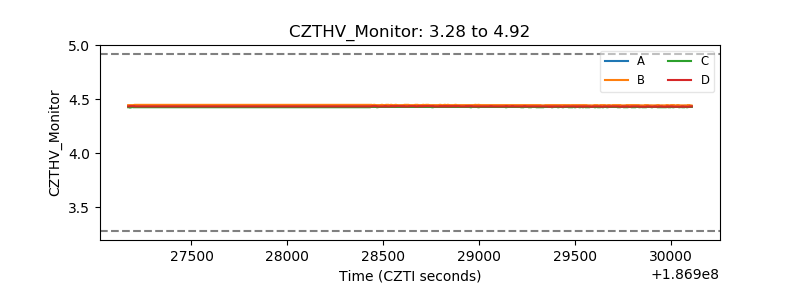 |
| D_VDD | 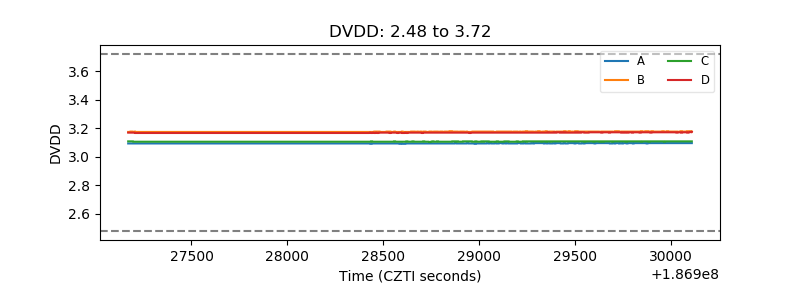 |
| Temperature 1 |  |
| Veto HV Monitor | 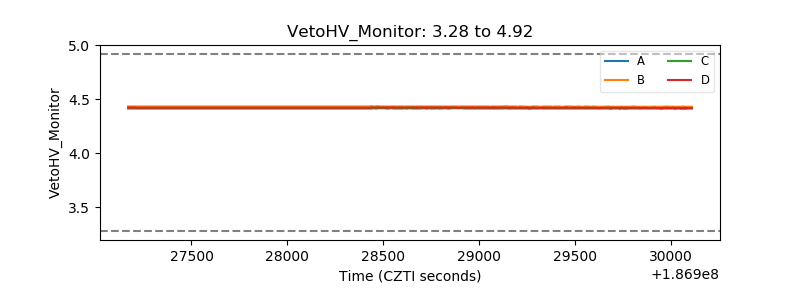 |
| Veto LLD |  |
| Alpha Counter | 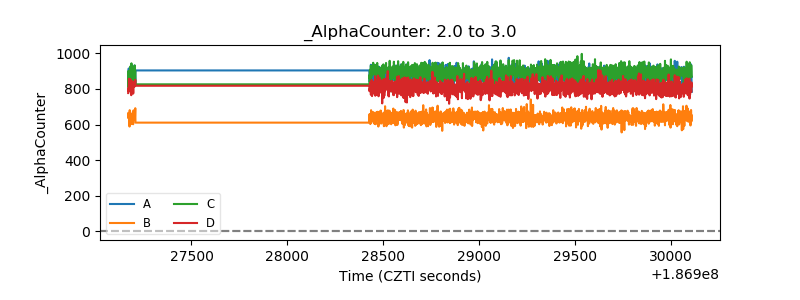 |
| _CPM_Rate | 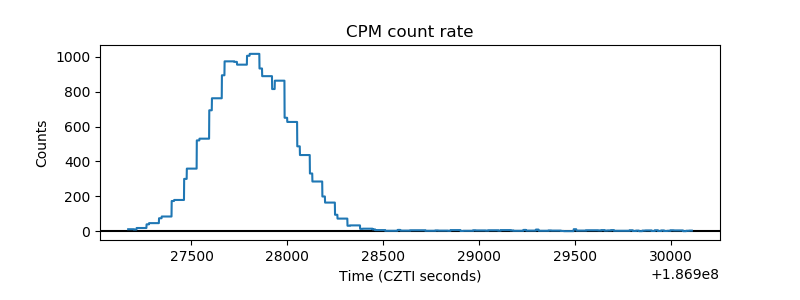 |
| CZT Counter | 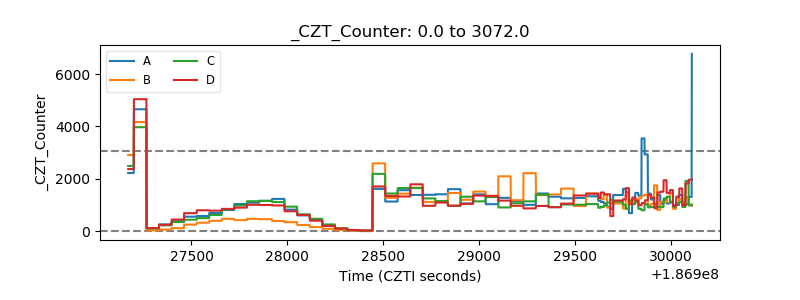 |
| +2.5 Volts monitor |  |
| +5 Volts monitor |  |
| _ROLL_ROT | 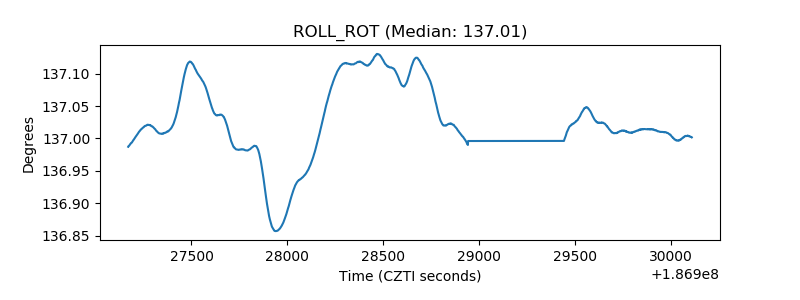 |
| _Roll_DEC | 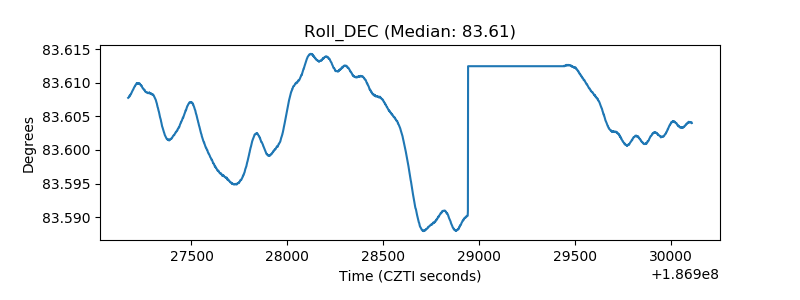 |
| _Roll_RA | 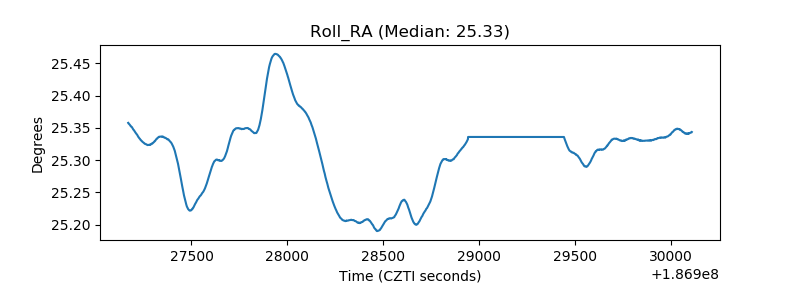 |
| Veto Counter | 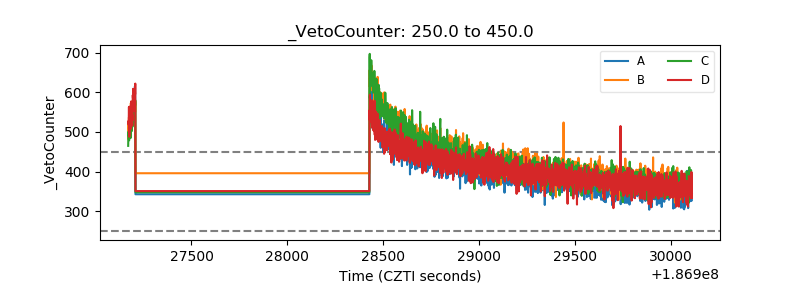 |