| Param | Original file | Final file |
|---|---|---|
| Filename | modeM0/AS1P01_998T02_9000000190_00999cztM0_level2.evt | modeM0/AS1P01_998T02_9000000190_00999cztM0_level2_quad_clean.evt |
| Size (bytes) | 1,001,433,600 | 109,376,640 |
| Size | 955.0 MB | 104.3 MB |
| Events in quadrant A | 7,382,565 | 734,991 |
| Events in quadrant B | 7,612,010 | 737,173 |
| Events in quadrant C | 7,354,936 | 713,296 |
| Events in quadrant D | 7,577,841 | 704,502 |
| Mode M0 | |||
|---|---|---|---|
| Quadrant | BADHDUFLAG | Total packets | Discarded packets |
| A | 0 | 26276 | 5 |
| B | 0 | 26903 | 1 |
| C | 0 | 26133 | 1 |
| D | 0 | 26795 | 1 |
| Mode SS | |||
|---|---|---|---|
| Quadrant | BADHDUFLAG | Total packets | Discarded packets |
| A | 0 | 122 | 0 |
| B | 0 | 122 | 0 |
| C | 0 | 122 | 0 |
| D | 0 | 122 | 0 |
| Mode M9 | |||
|---|---|---|---|
| Quadrant | BADHDUFLAG | Total packets | Discarded packets |
| A | 0 | 12 | 0 |
| B | 0 | 12 | 0 |
| C | 0 | 12 | 0 |
| D | 0 | 12 | 0 |
| Quadrant | Total seconds | Saturated seconds | Saturation percentage |
|---|---|---|---|
| A | 6058 | 84 | 1.386596% |
| B | 6058 | 69 | 1.138990% |
| C | 6058 | 33 | 0.544734% |
| D | 6058 | 46 | 0.759327% |
Noise dominated data is calculated using 1-second bins in cleaned event files. If a bin has >2000 counts, and if more than 50% of those come from <1% of pixels, then it is considered to be noise-dominated and hence unusable.
| Quadrant | # 1 sec bins | Bins with >0 counts | Bins with >2000 counts | High rate bins dominated by noise | Noise dominated (total time) | Noise dominated (detector-on time) | Marked lightcurve |
|---|---|---|---|---|---|---|---|
| A | 7258 | 6059 | 323 | 323 | 4.45% | 5.33% | 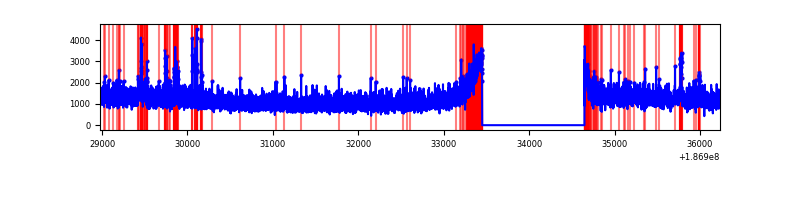 |
| B | 7258 | 6059 | 285 | 285 | 3.93% | 4.70% | 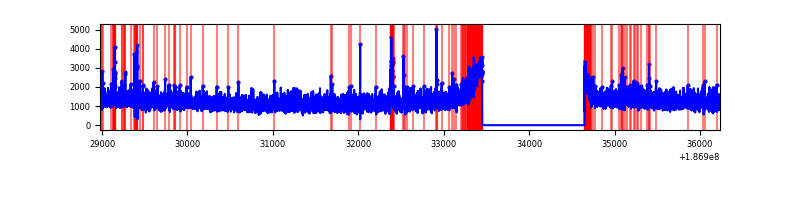 |
| C | 7258 | 6059 | 205 | 205 | 2.82% | 3.38% | 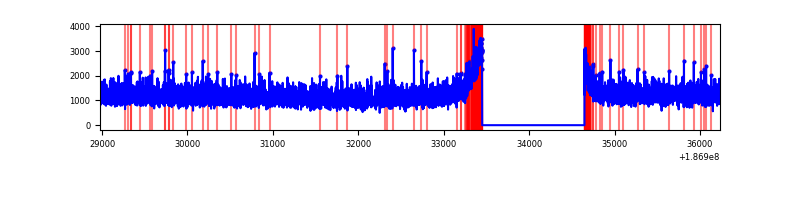 |
| D | 7258 | 6059 | 377 | 377 | 5.19% | 6.22% | 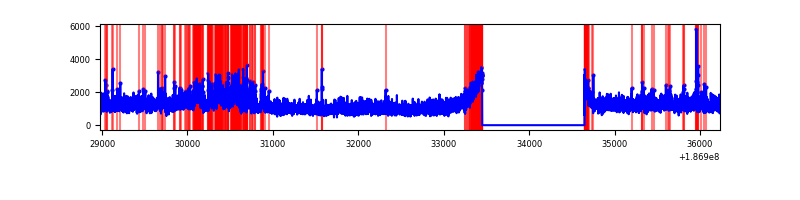 |
Top three noisy pixels from each quadrant. If the there are fewer than three noisy pixels in the level2.evt file, extra rows are filled as -1
| Pixel properties | Quadrant properties | ||||||
|---|---|---|---|---|---|---|---|
| Quadrant | DetID | PixID | Counts | Sigma | Mean | Median | Sigma |
| A | 0 | 253 | 211064 | 466.9 | 1863 | 1874 | 448.0 |
| A | 12 | 243 | 12551 | 23.83 | 1863 | 1874 | 448.0 |
| A | 11 | 79 | 8310 | 14.36 | 1863 | 1874 | 448.0 |
| B | 5 | 249 | 95862 | 207.42 | 1930 | 1933 | 452.8 |
| B | 5 | 6 | 51528 | 109.52 | 1930 | 1933 | 452.8 |
| B | 15 | 85 | 35318 | 73.72 | 1930 | 1933 | 452.8 |
| C | 15 | 241 | 303162 | 608.22 | 1788 | 1844 | 495.4 |
| C | 3 | 79 | 33106 | 63.1 | 1788 | 1844 | 495.4 |
| C | 3 | 111 | 28340 | 53.48 | 1788 | 1844 | 495.4 |
| D | 1 | 4 | 959330 | 1806.01 | 1756 | 1815 | 530.2 |
| D | 13 | 85 | 22644 | 39.29 | 1756 | 1815 | 530.2 |
| D | 12 | 22 | 16101 | 26.95 | 1756 | 1815 | 530.2 |
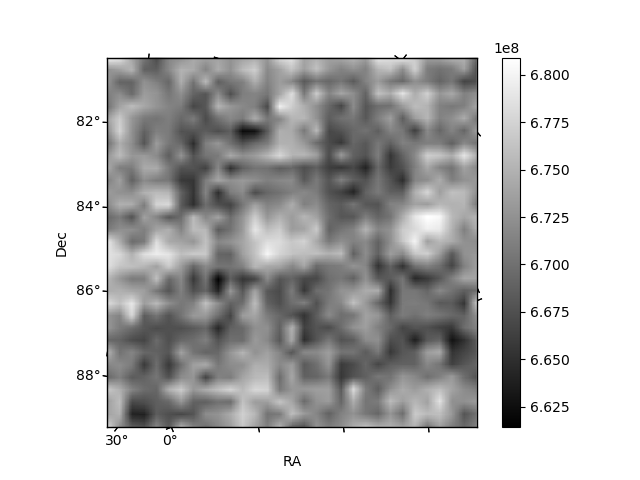
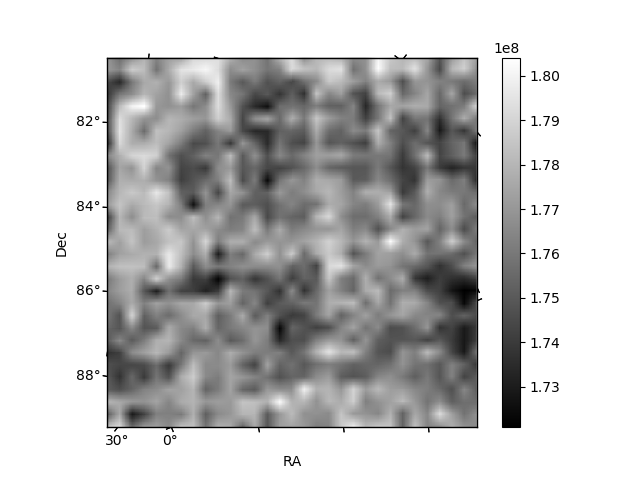
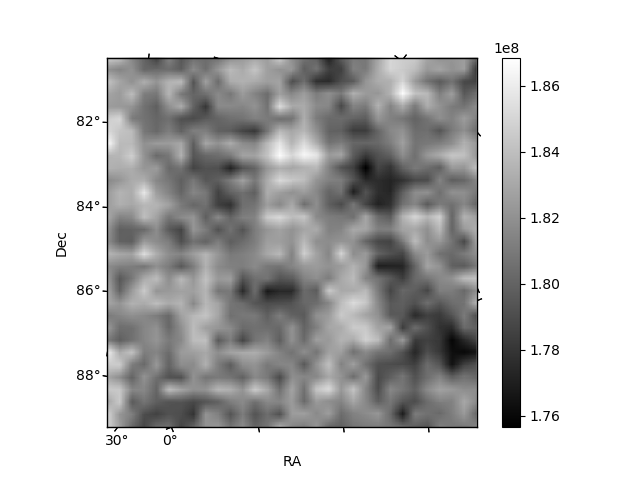
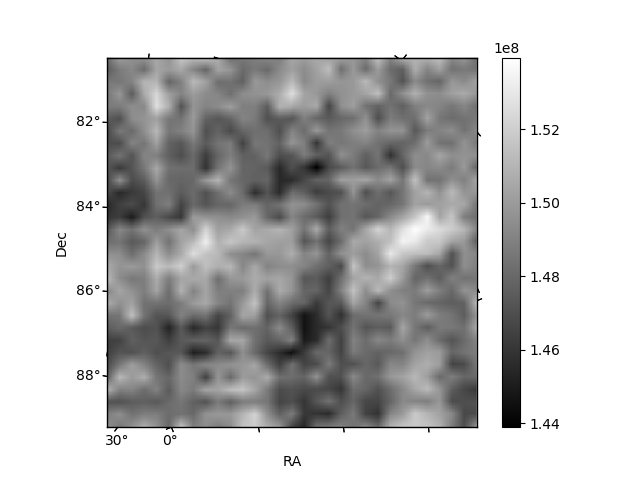
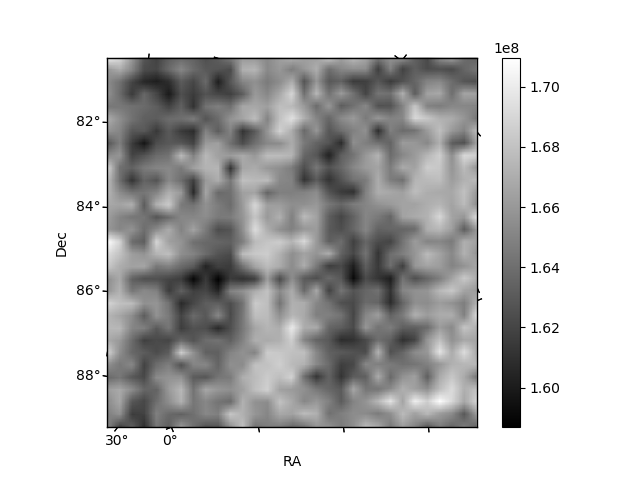
Histogram calculated using DETX and DETY for each event in the final _common_clean file
| Quadrant A | 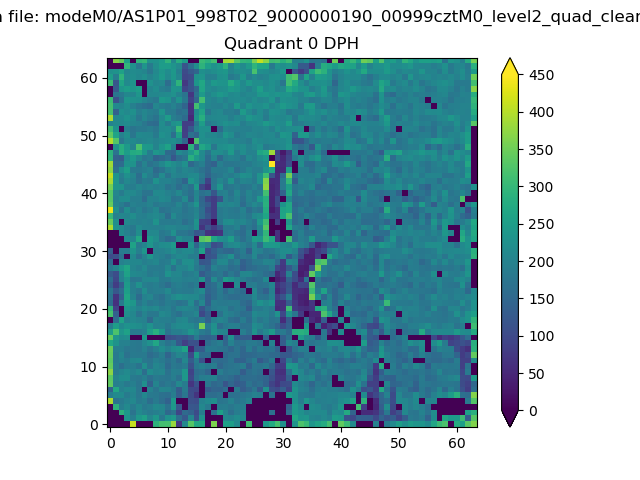 |
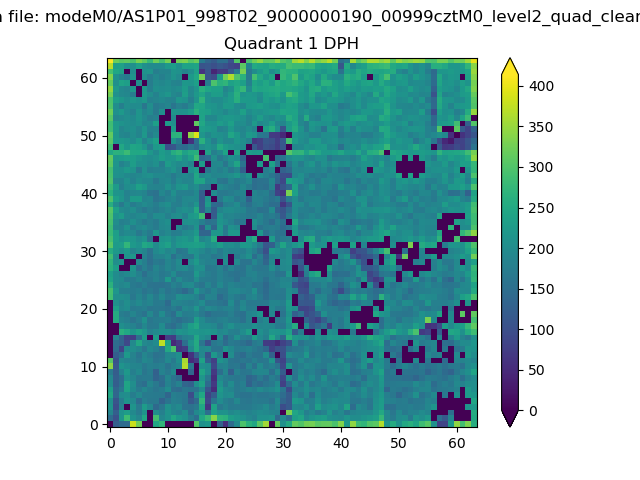 |
Quadrant B |
|---|---|---|---|
| Quadrant D | 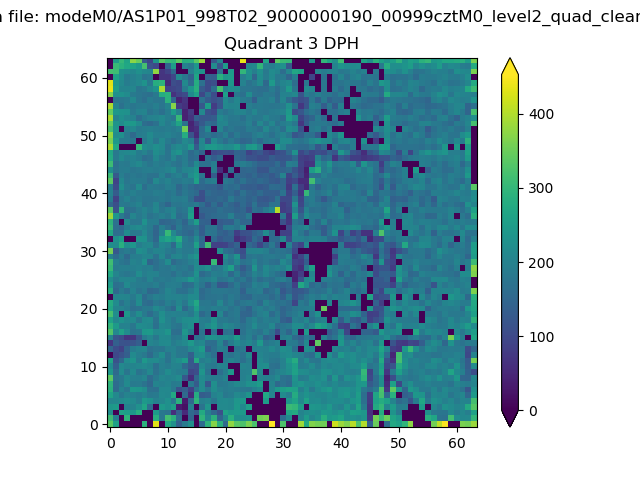 |
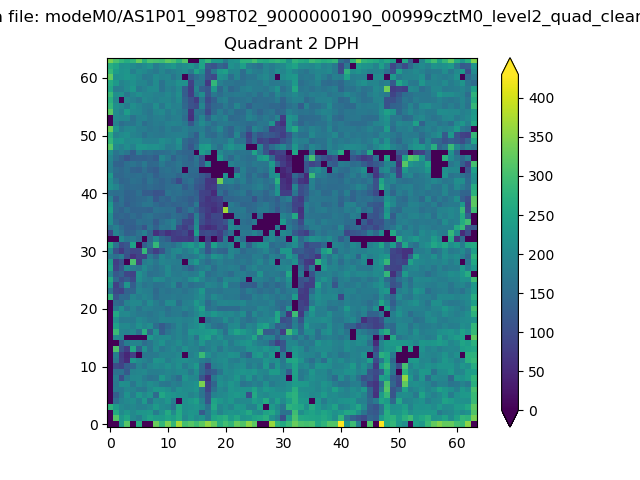 |
Quadrant C |
| Plot type | Count rate plots | Images |
|---|---|---|
| Comparison with Poisson distribution Blue bars denote a histogram of data divided into 1 sec bins. Red curve is a Poisson curve with rate = median count rate of data. |
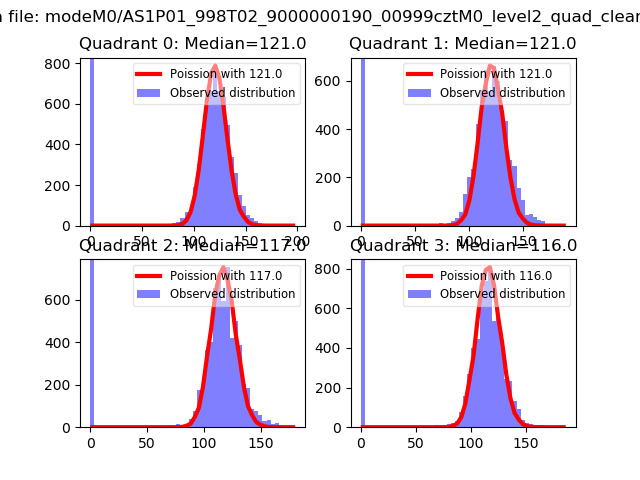 |
 |
| Quadrant-wise count rates Data is divided into 100 sec bins |
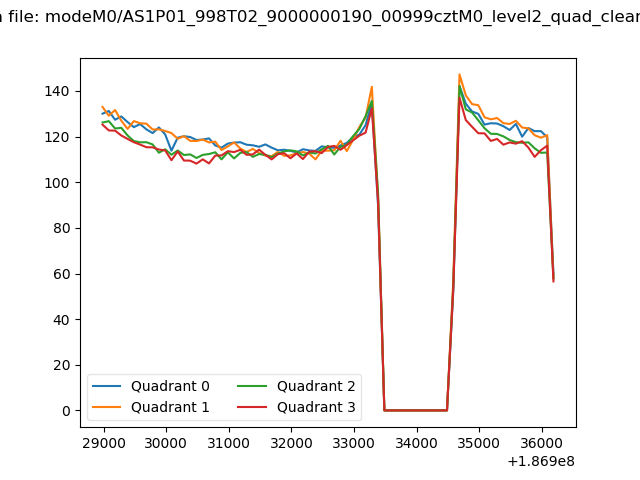 |
|
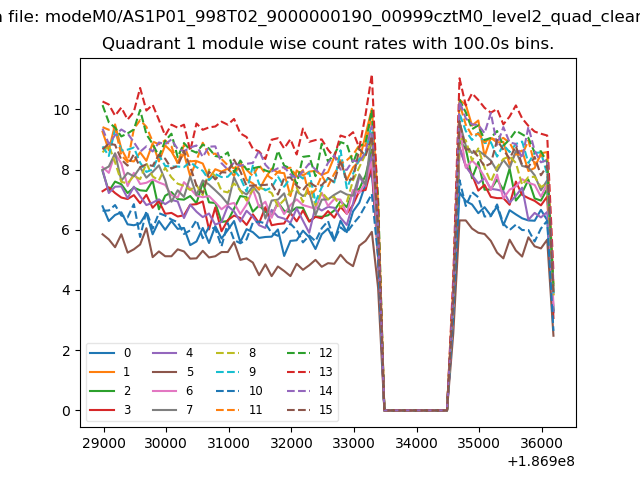
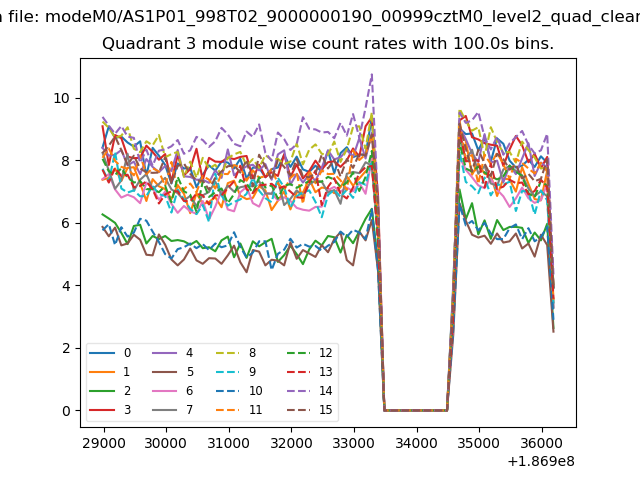
| Module-wise count rates for Quadrant A Data is divided into 100 sec bins |
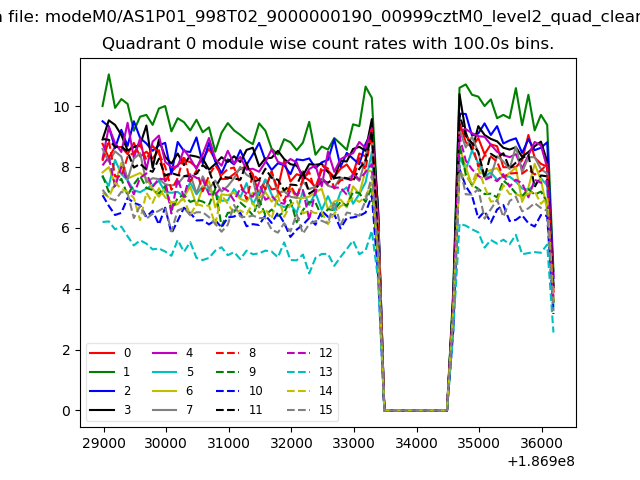 |
 |
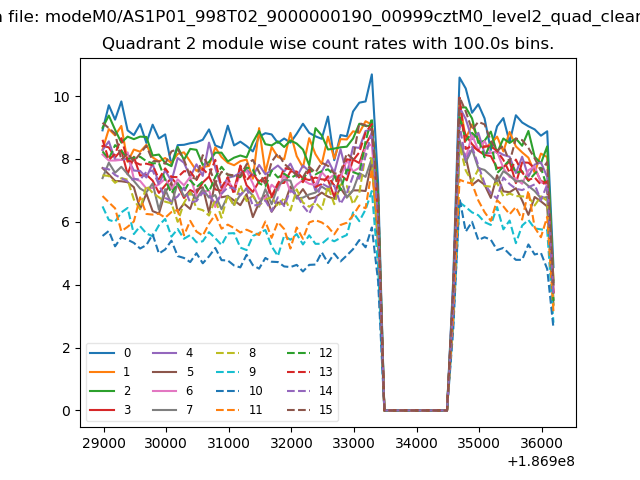
| Module-wise count rates for Quadrant B Data is divided into 100 sec bins |
 |
 |
| Module-wise count rates for Quadrant C Data is divided into 100 sec bins |
 |
 |
| Module-wise count rates for Quadrant D Data is divided into 100 sec bins |
 |
 |
| Parameter | Plot |
|---|---|
| CZT HV Monitor | 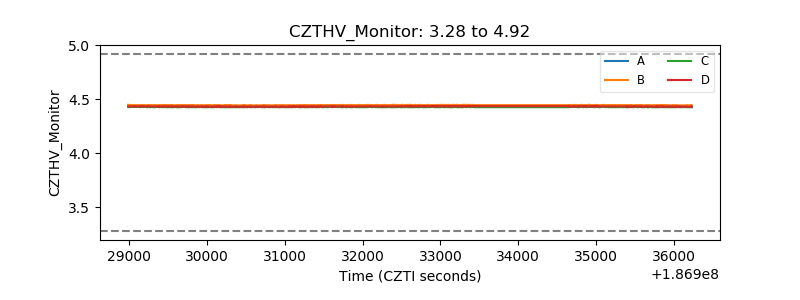 |
| D_VDD | 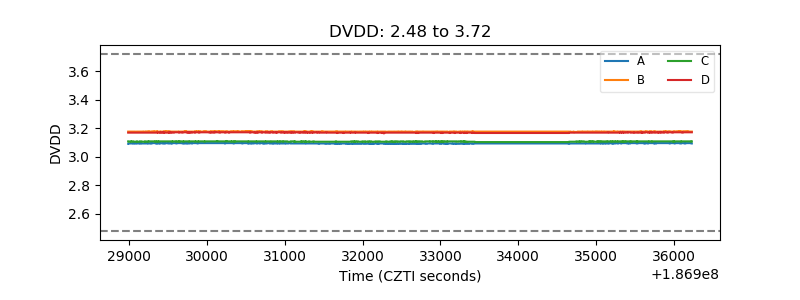 |
| Temperature 1 | 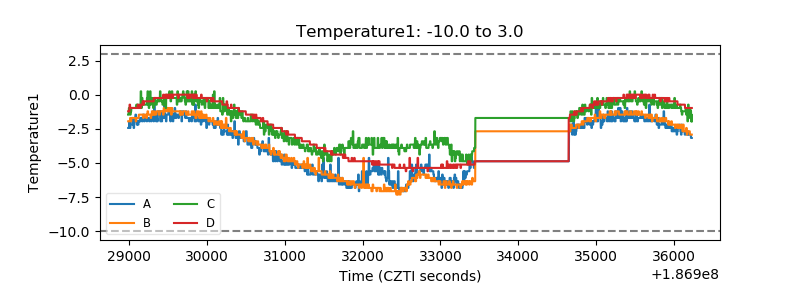 |
| Veto HV Monitor | 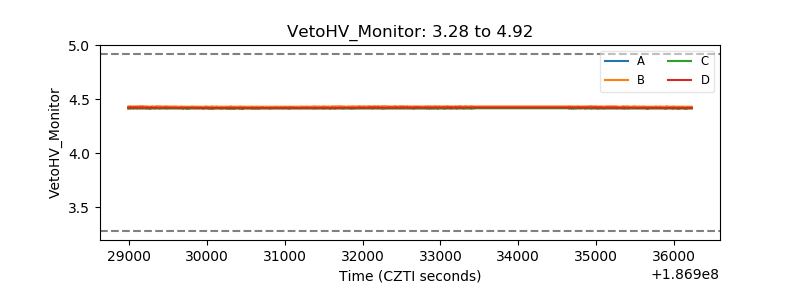 |
| Veto LLD | 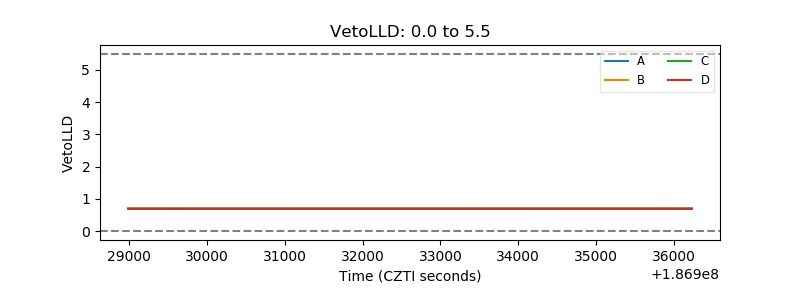 |
| Alpha Counter | 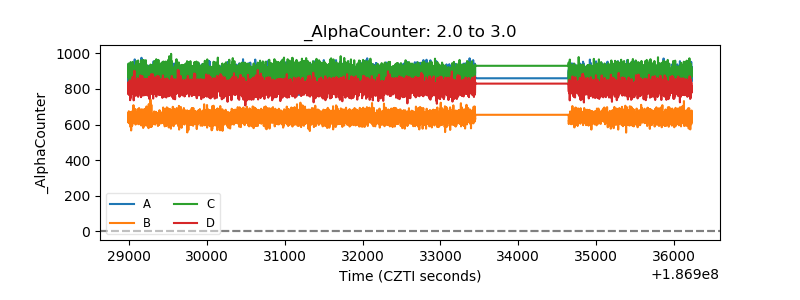 |
| _CPM_Rate | 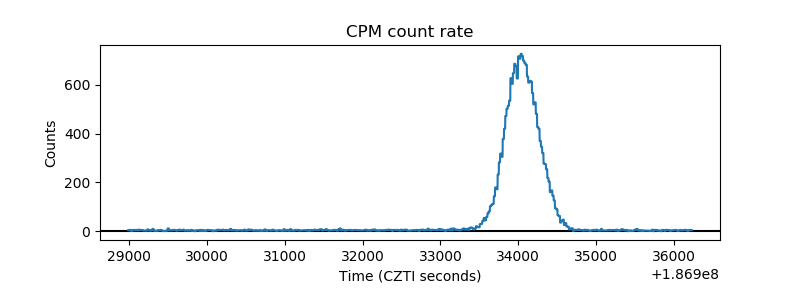 |
| CZT Counter | 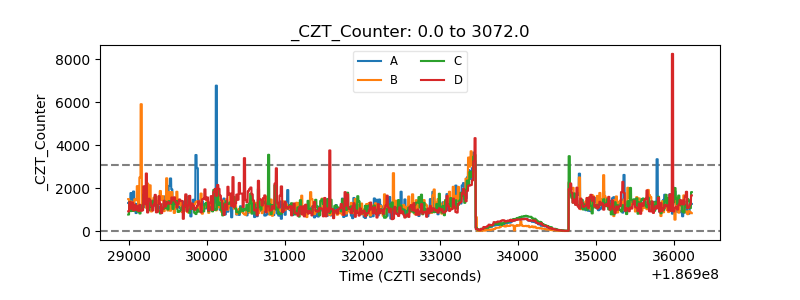 |
| +2.5 Volts monitor |  |
| +5 Volts monitor | 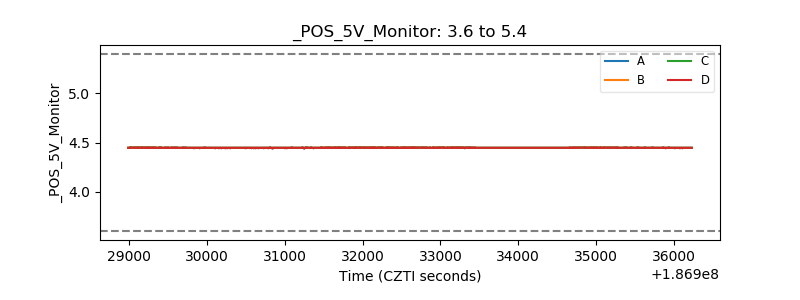 |
| _ROLL_ROT | 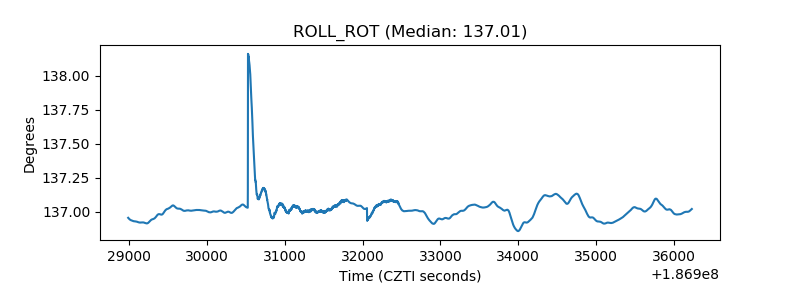 |
| _Roll_DEC | 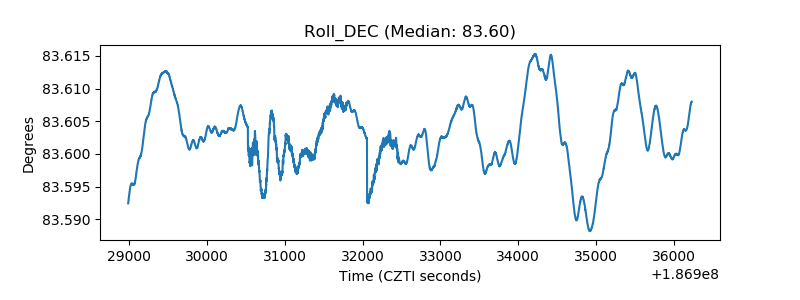 |
| _Roll_RA | 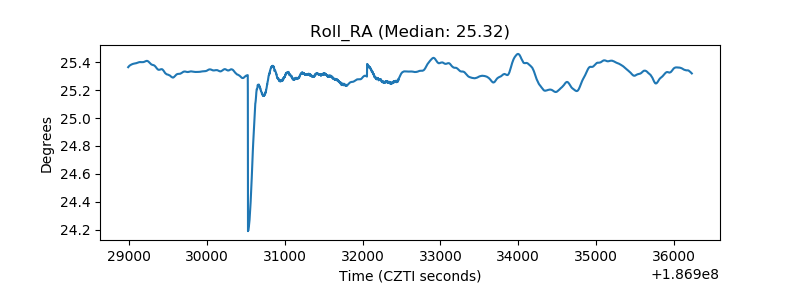 |
| Veto Counter | 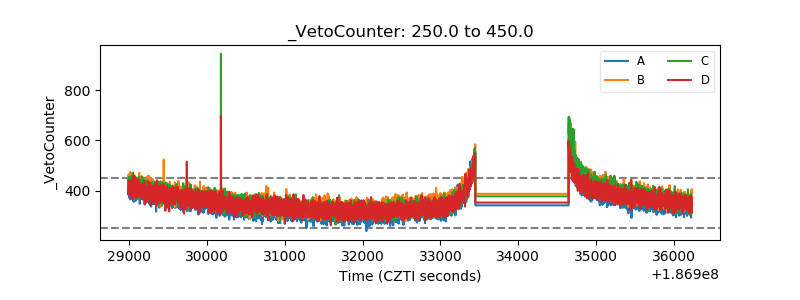 |