| Param | Original file | Final file |
|---|---|---|
| Filename | modeM0/AS1P01_998T02_9000000190_01000cztM0_level2.evt | modeM0/AS1P01_998T02_9000000190_01000cztM0_level2_quad_clean.evt |
| Size (bytes) | 985,489,920 | 108,538,560 |
| Size | 939.8 MB | 103.5 MB |
| Events in quadrant A | 7,204,553 | 726,206 |
| Events in quadrant B | 7,507,281 | 728,523 |
| Events in quadrant C | 7,378,613 | 706,550 |
| Events in quadrant D | 7,345,848 | 695,341 |
| Mode M0 | |||
|---|---|---|---|
| Quadrant | BADHDUFLAG | Total packets | Discarded packets |
| A | 0 | 25808 | 3 |
| B | 0 | 26646 | 1 |
| C | 0 | 26276 | 1 |
| D | 0 | 26217 | 1 |
| Mode SS | |||
|---|---|---|---|
| Quadrant | BADHDUFLAG | Total packets | Discarded packets |
| A | 0 | 126 | 0 |
| B | 0 | 126 | 0 |
| C | 0 | 126 | 0 |
| D | 0 | 126 | 0 |
| Mode M9 | |||
|---|---|---|---|
| Quadrant | BADHDUFLAG | Total packets | Discarded packets |
| A | 0 | 11 | 0 |
| B | 0 | 11 | 0 |
| C | 0 | 11 | 0 |
| D | 0 | 11 | 0 |
| Quadrant | Total seconds | Saturated seconds | Saturation percentage |
|---|---|---|---|
| A | 6168 | 19 | 0.308042% |
| B | 6168 | 22 | 0.356680% |
| C | 6168 | 4 | 0.064851% |
| D | 6169 | 12 | 0.194521% |
Noise dominated data is calculated using 1-second bins in cleaned event files. If a bin has >2000 counts, and if more than 50% of those come from <1% of pixels, then it is considered to be noise-dominated and hence unusable.
| Quadrant | # 1 sec bins | Bins with >0 counts | Bins with >2000 counts | High rate bins dominated by noise | Noise dominated (total time) | Noise dominated (detector-on time) | Marked lightcurve |
|---|---|---|---|---|---|---|---|
| A | 7283 | 6169 | 182 | 182 | 2.50% | 2.95% | 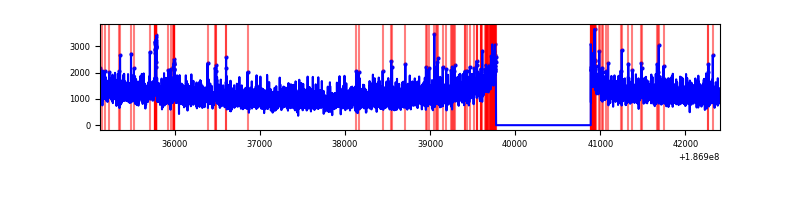 |
| B | 7283 | 6169 | 232 | 232 | 3.19% | 3.76% | 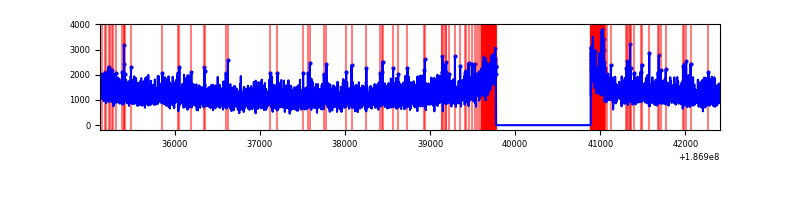 |
| C | 7283 | 6169 | 150 | 150 | 2.06% | 2.43% | 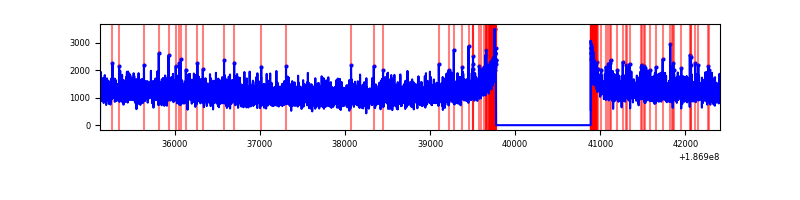 |
| D | 7284 | 6170 | 264 | 264 | 3.62% | 4.28% | 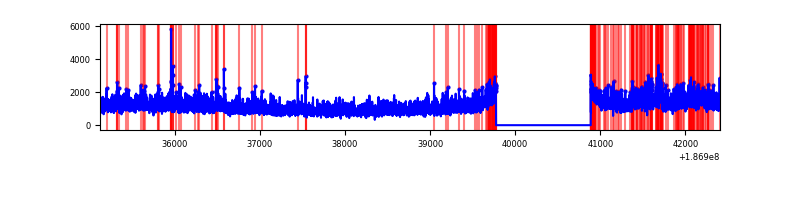 |
Top three noisy pixels from each quadrant. If the there are fewer than three noisy pixels in the level2.evt file, extra rows are filled as -1
| Pixel properties | Quadrant properties | ||||||
|---|---|---|---|---|---|---|---|
| Quadrant | DetID | PixID | Counts | Sigma | Mean | Median | Sigma |
| A | 0 | 253 | 86900 | 192.81 | 1851 | 1860 | 441.1 |
| A | 12 | 189 | 12292 | 23.65 | 1851 | 1860 | 441.1 |
| A | 11 | 79 | 8333 | 14.68 | 1851 | 1860 | 441.1 |
| B | 5 | 249 | 74506 | 161.26 | 1925 | 1926 | 450.1 |
| B | 7 | 221 | 48945 | 104.47 | 1925 | 1926 | 450.1 |
| B | 4 | 200 | 18495 | 36.81 | 1925 | 1926 | 450.1 |
| C | 15 | 241 | 311073 | 622.67 | 1792 | 1850 | 496.6 |
| C | 3 | 79 | 34123 | 64.99 | 1792 | 1850 | 496.6 |
| C | 3 | 111 | 29431 | 55.54 | 1792 | 1850 | 496.6 |
| D | 1 | 4 | 405788 | 758.47 | 1758 | 1819 | 532.6 |
| D | 12 | 22 | 291687 | 544.24 | 1758 | 1819 | 532.6 |
| D | 10 | 85 | 25069 | 43.65 | 1758 | 1819 | 532.6 |
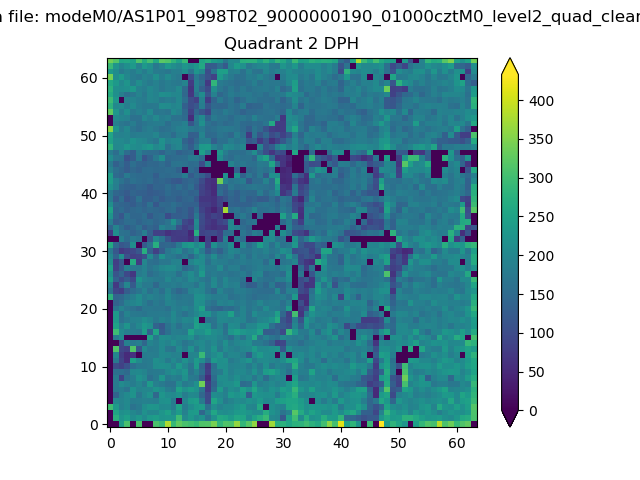
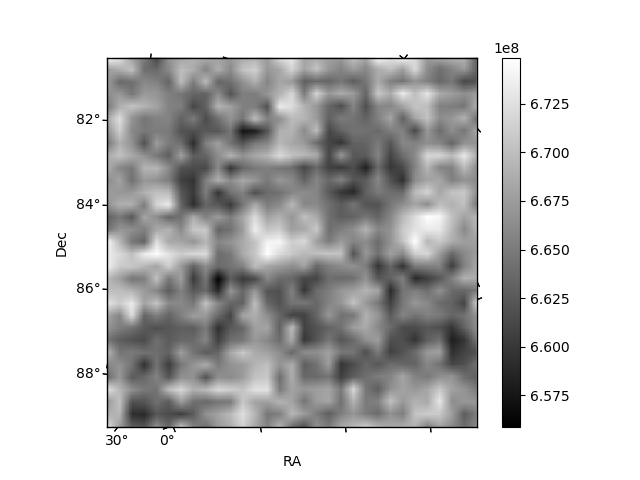
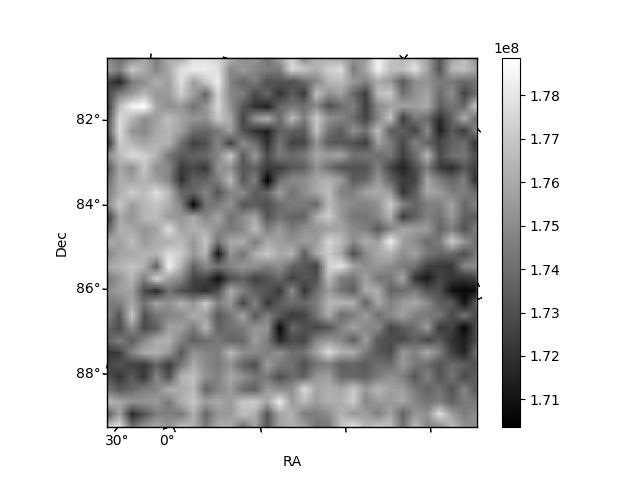
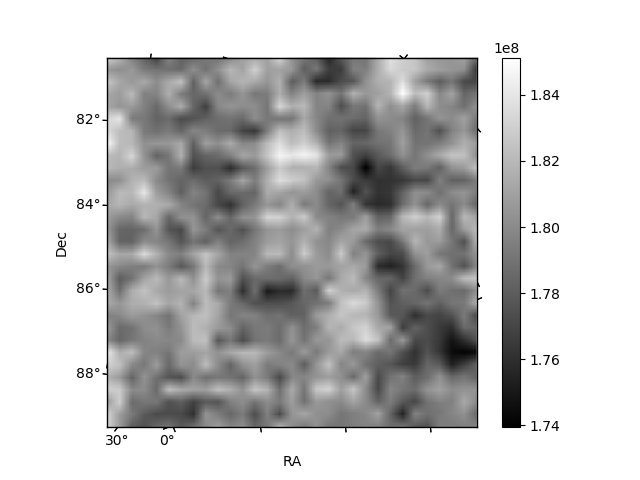
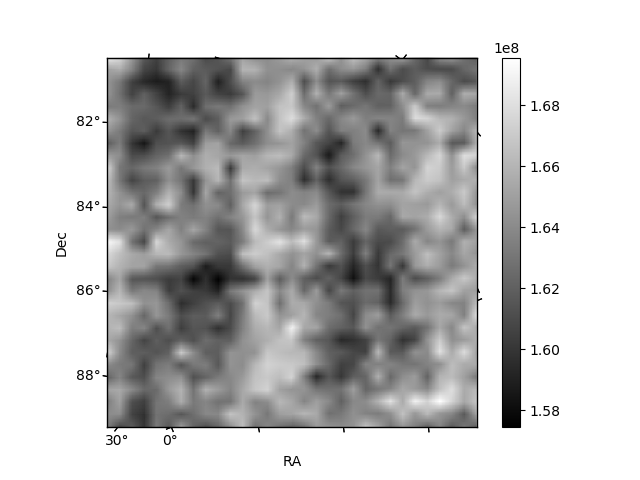
Histogram calculated using DETX and DETY for each event in the final _common_clean file
| Quadrant A | 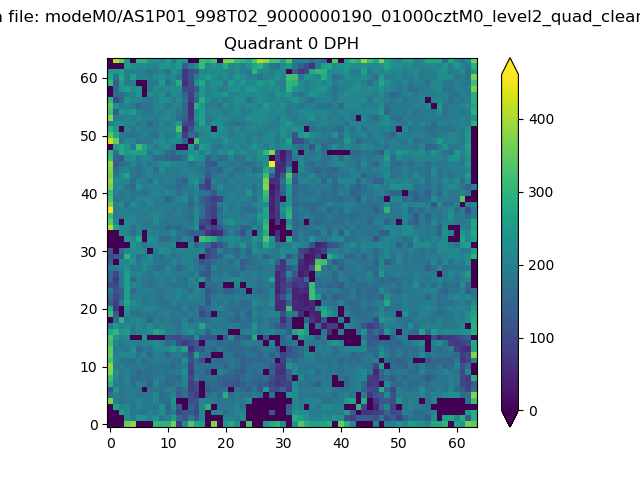 |
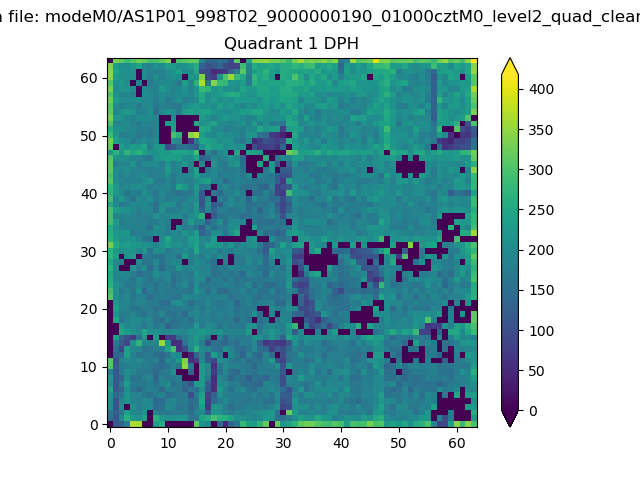 |
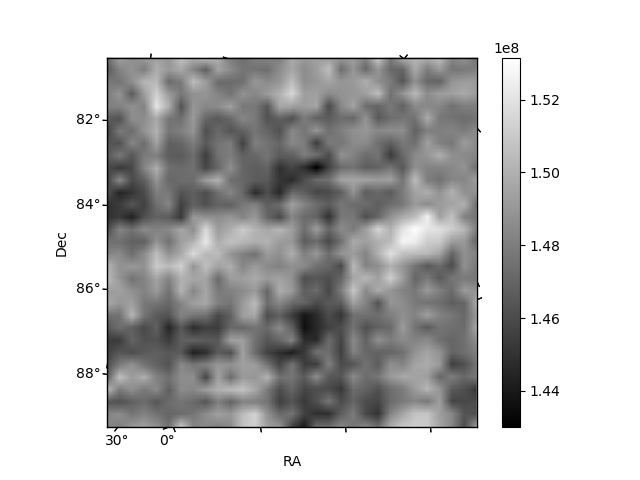
Quadrant B |
|---|---|---|---|
| Quadrant D | 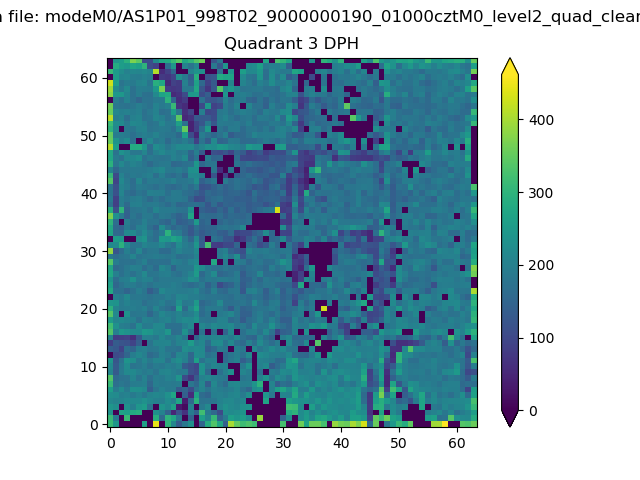 |
 |
Quadrant C |
| Plot type | Count rate plots | Images |
|---|---|---|
| Comparison with Poisson distribution Blue bars denote a histogram of data divided into 1 sec bins. Red curve is a Poisson curve with rate = median count rate of data. |
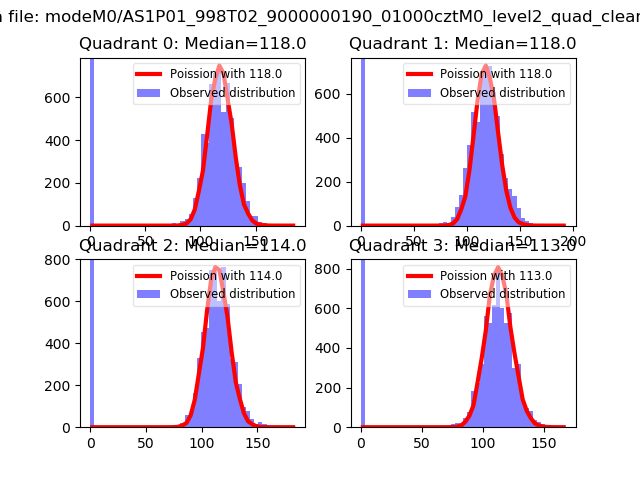 |
 |
| Quadrant-wise count rates Data is divided into 100 sec bins |
 |
|
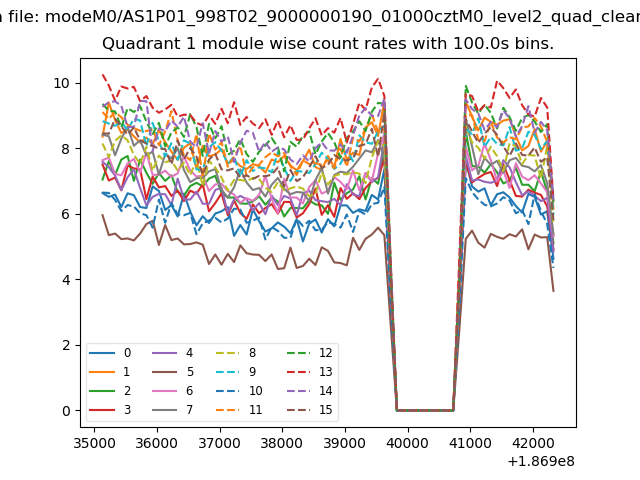
| Module-wise count rates for Quadrant A Data is divided into 100 sec bins |
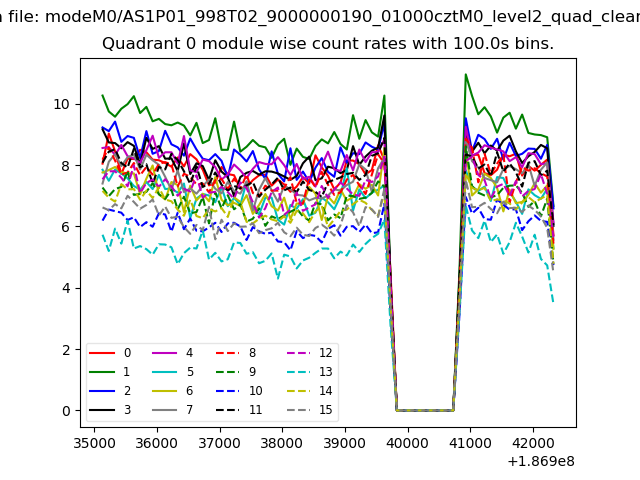 |
 |
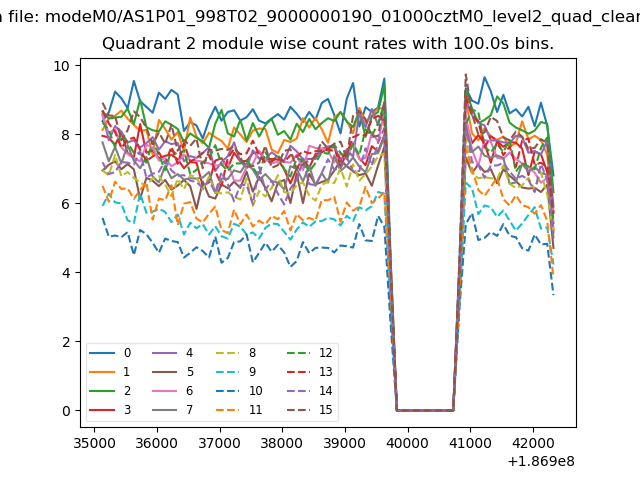
| Module-wise count rates for Quadrant B Data is divided into 100 sec bins |
 |
 |
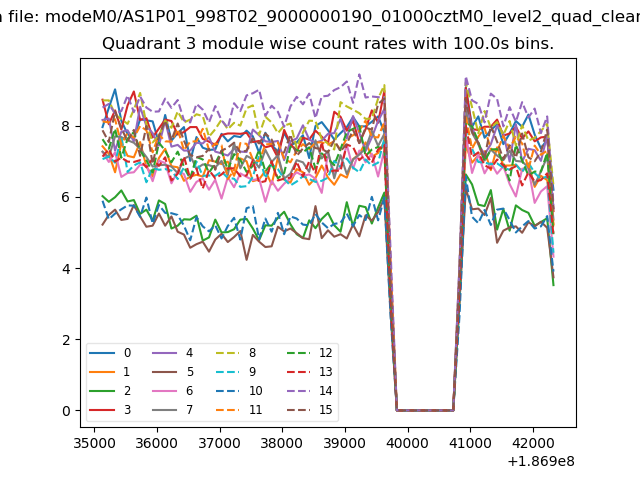
| Module-wise count rates for Quadrant C Data is divided into 100 sec bins |
 |
 |
| Module-wise count rates for Quadrant D Data is divided into 100 sec bins |
 |
 |
| Parameter | Plot |
|---|---|
| CZT HV Monitor | 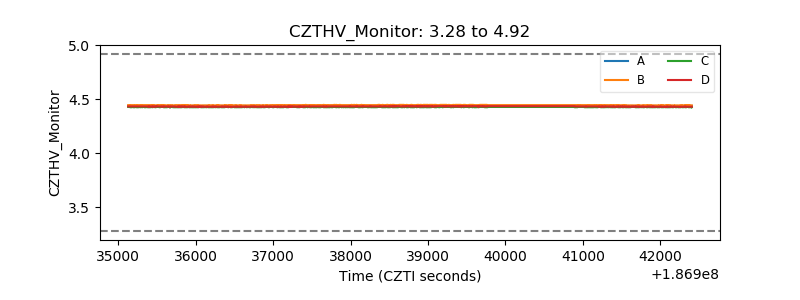 |
| D_VDD | 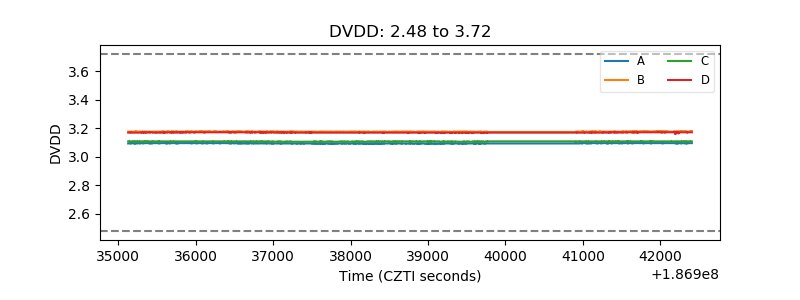 |
| Temperature 1 | 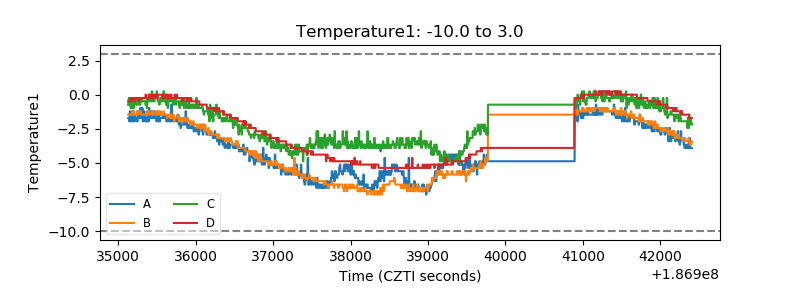 |
| Veto HV Monitor | 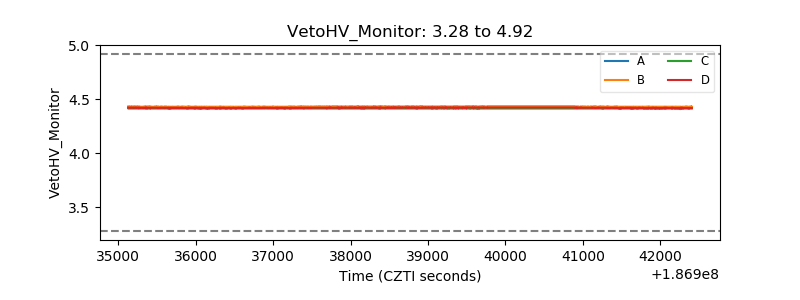 |
| Veto LLD | 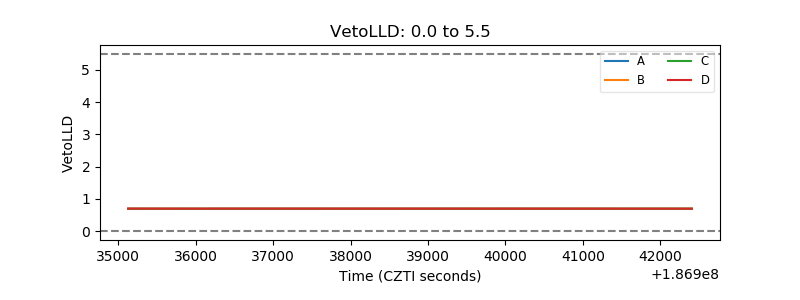 |
| Alpha Counter | 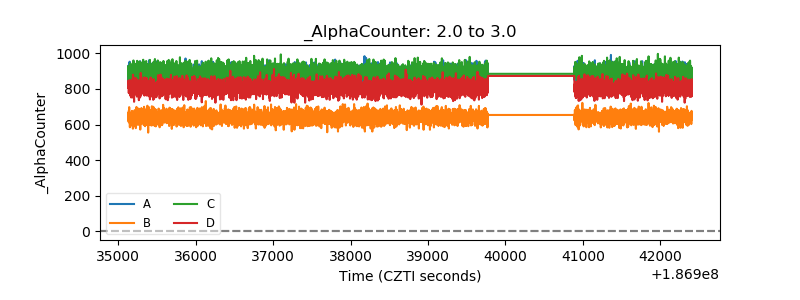 |
| _CPM_Rate | 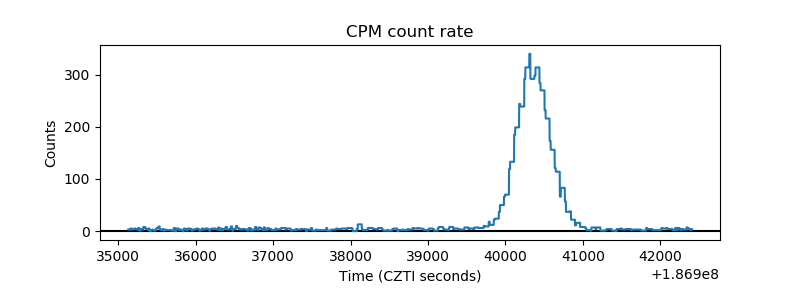 |
| CZT Counter | 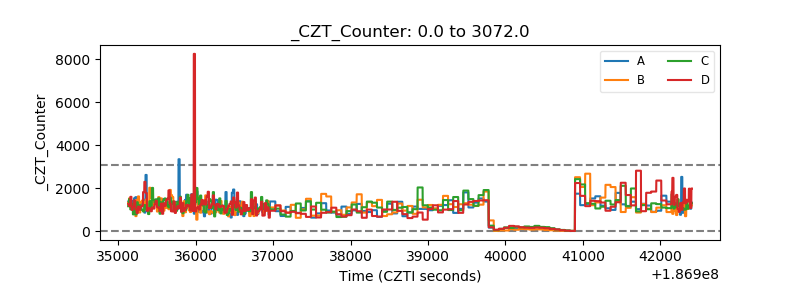 |
| +2.5 Volts monitor |  |
| +5 Volts monitor |  |
| _ROLL_ROT | 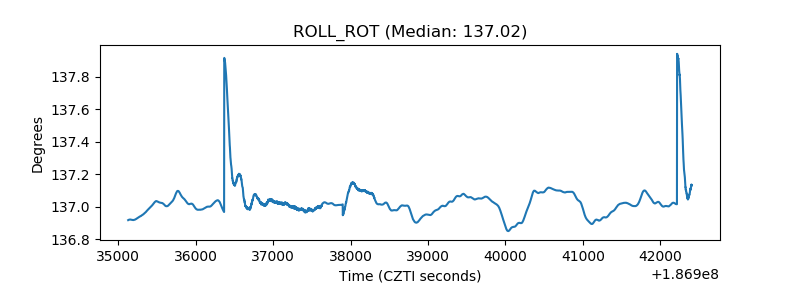 |
| _Roll_DEC | 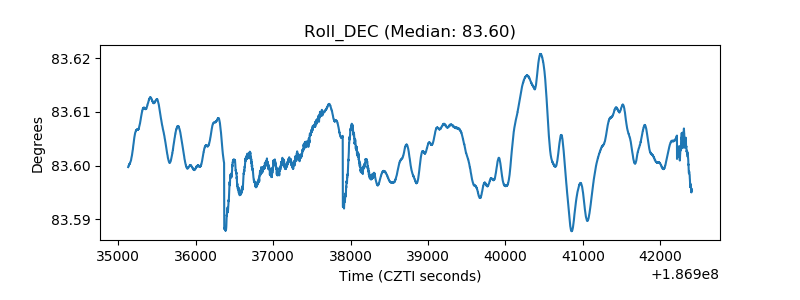 |
| _Roll_RA | 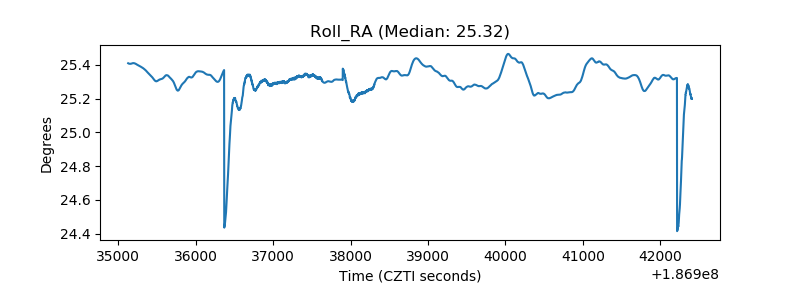 |
| Veto Counter | 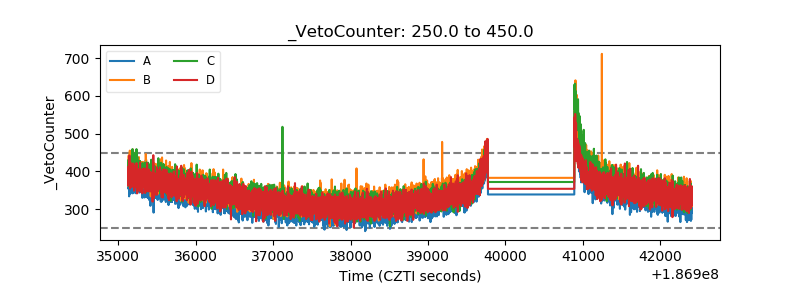 |