| Param | Original file | Final file |
|---|---|---|
| Filename | modeM0/AS1P01_998T02_9000000190_01004cztM0_level2.evt | modeM0/AS1P01_998T02_9000000190_01004cztM0_level2_quad_clean.evt |
| Size (bytes) | 1,318,141,440 | 137,378,880 |
| Size | 1.2 GB | 131.0 MB |
| Events in quadrant A | 9,753,322 | 907,664 |
| Events in quadrant B | 10,395,355 | 917,303 |
| Events in quadrant C | 10,086,316 | 895,599 |
| Events in quadrant D | 9,149,611 | 877,922 |
| Mode M0 | |||
|---|---|---|---|
| Quadrant | BADHDUFLAG | Total packets | Discarded packets |
| A | 0 | 34713 | 3 |
| B | 0 | 36630 | 3 |
| C | 0 | 35676 | 3 |
| D | 0 | 32928 | 3 |
| Mode SS | |||
|---|---|---|---|
| Quadrant | BADHDUFLAG | Total packets | Discarded packets |
| A | 0 | 164 | 0 |
| B | 0 | 164 | 0 |
| C | 0 | 164 | 0 |
| D | 0 | 164 | 0 |
| Mode M9 | |||
|---|---|---|---|
| Quadrant | BADHDUFLAG | Total packets | Discarded packets |
| A | 0 | 3 | 0 |
| B | 0 | 3 | 0 |
| C | 0 | 3 | 0 |
| D | 0 | 3 | 0 |
| Quadrant | Total seconds | Saturated seconds | Saturation percentage |
|---|---|---|---|
| A | 8094 | 13 | 0.160613% |
| B | 8094 | 46 | 0.568322% |
| C | 8094 | 13 | 0.160613% |
| D | 8094 | 35 | 0.432419% |
Noise dominated data is calculated using 1-second bins in cleaned event files. If a bin has >2000 counts, and if more than 50% of those come from <1% of pixels, then it is considered to be noise-dominated and hence unusable.
| Quadrant | # 1 sec bins | Bins with >0 counts | Bins with >2000 counts | High rate bins dominated by noise | Noise dominated (total time) | Noise dominated (detector-on time) | Marked lightcurve |
|---|---|---|---|---|---|---|---|
| A | 8454 | 8097 | 404 | 404 | 4.78% | 4.99% | 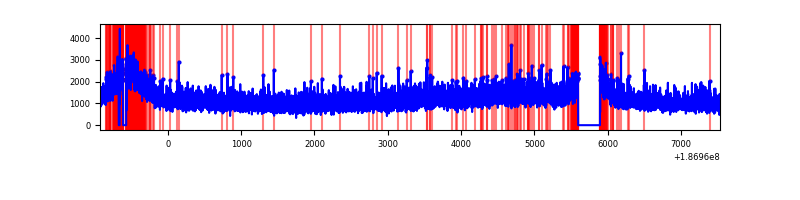 |
| B | 8454 | 8097 | 567 | 567 | 6.71% | 7.00% | 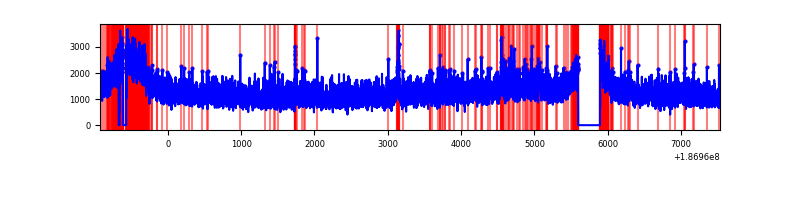 |
| C | 8454 | 8097 | 487 | 487 | 5.76% | 6.01% | 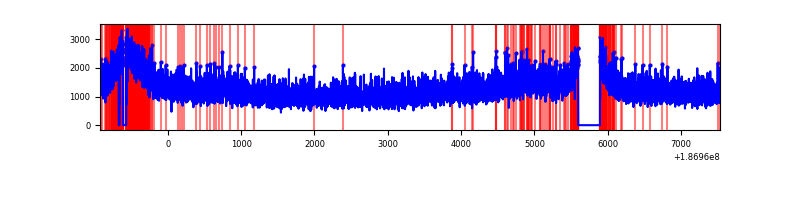 |
| D | 8454 | 8097 | 338 | 338 | 4.00% | 4.17% | 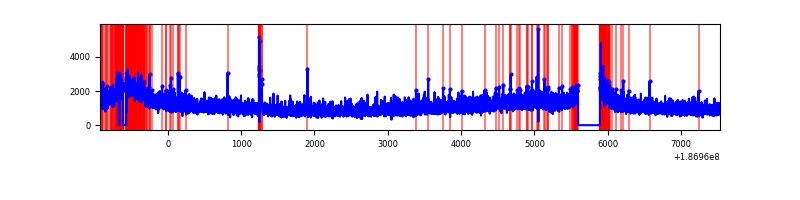 |
Top three noisy pixels from each quadrant. If the there are fewer than three noisy pixels in the level2.evt file, extra rows are filled as -1
| Pixel properties | Quadrant properties | ||||||
|---|---|---|---|---|---|---|---|
| Quadrant | DetID | PixID | Counts | Sigma | Mean | Median | Sigma |
| A | 15 | 233 | 36488 | 55.81 | 2531 | 2546 | 608.1 |
| A | 11 | 79 | 10910 | 13.75 | 2531 | 2546 | 608.1 |
| A | 3 | 111 | 7805 | 8.65 | 2531 | 2546 | 608.1 |
| B | 14 | 53 | 61642 | 92.36 | 2675 | 2677 | 638.4 |
| B | 5 | 63 | 38083 | 55.46 | 2675 | 2677 | 638.4 |
| B | 7 | 221 | 32562 | 46.81 | 2675 | 2677 | 638.4 |
| C | 15 | 241 | 410511 | 594.96 | 2454 | 2538 | 685.7 |
| C | 3 | 79 | 46484 | 64.09 | 2454 | 2538 | 685.7 |
| C | 3 | 111 | 44229 | 60.8 | 2454 | 2538 | 685.7 |
| D | 1 | 4 | 190870 | 259.28 | 2344 | 2420 | 726.8 |
| D | 13 | 13 | 57245 | 75.43 | 2344 | 2420 | 726.8 |
| D | 7 | 143 | 53835 | 70.74 | 2344 | 2420 | 726.8 |
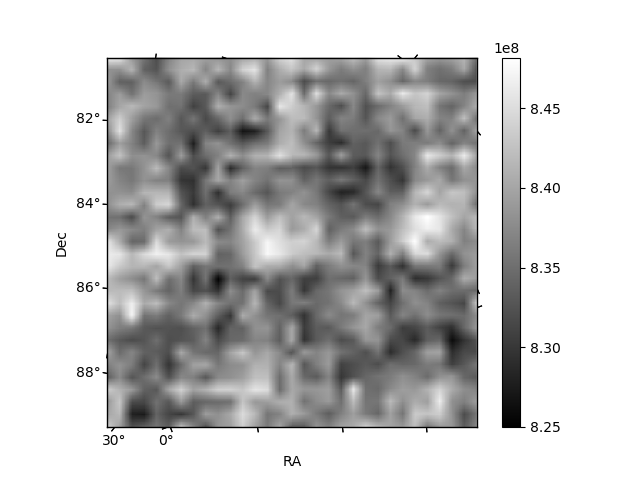
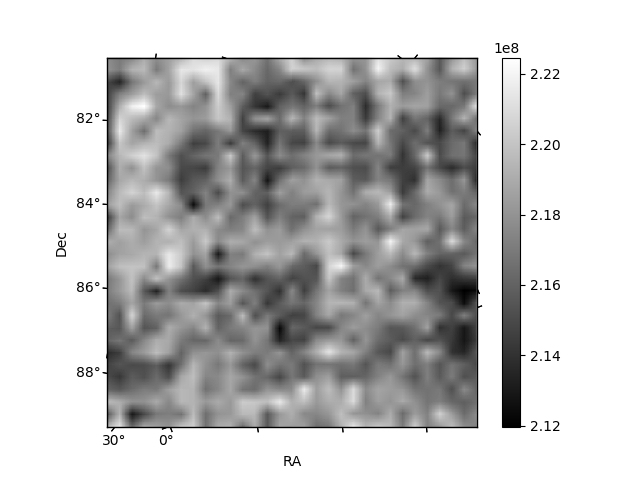
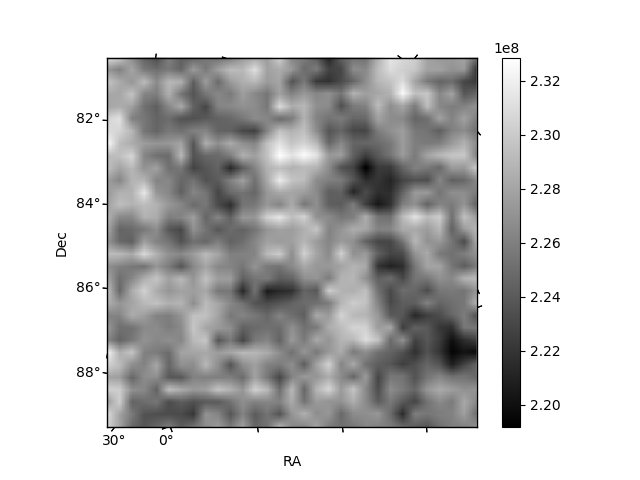
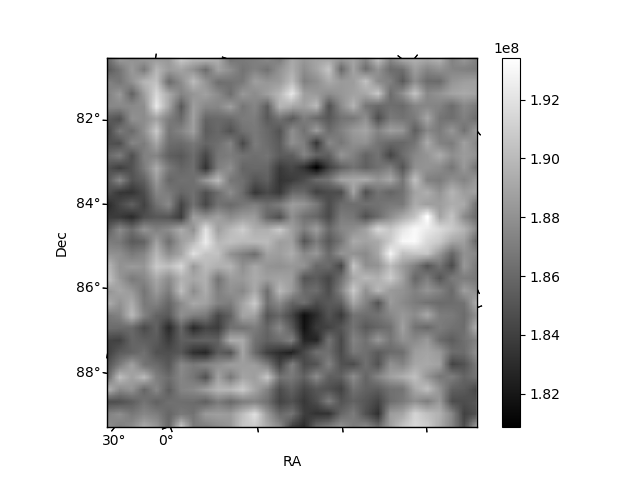
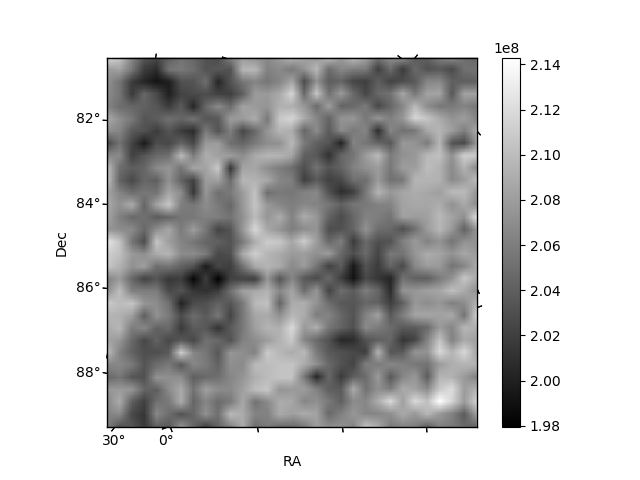
Histogram calculated using DETX and DETY for each event in the final _common_clean file
| Quadrant A | 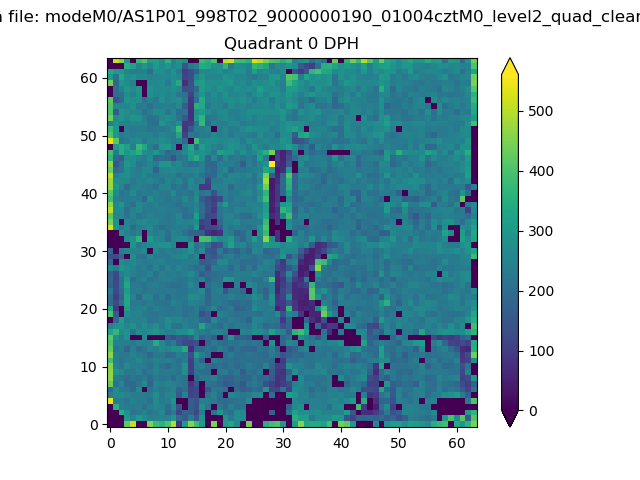 |
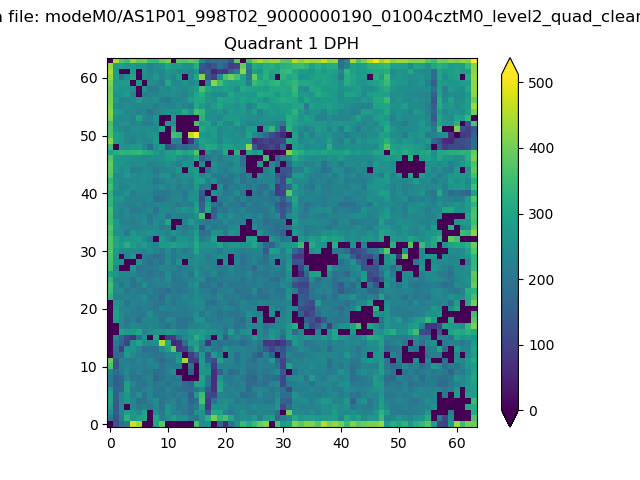 |
Quadrant B |
|---|---|---|---|
| Quadrant D | 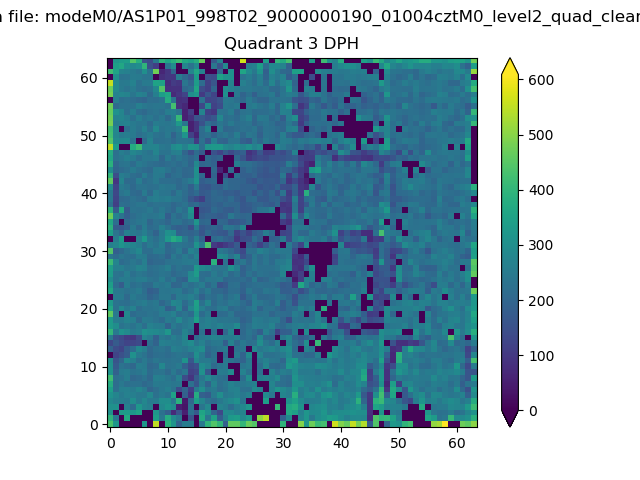 |
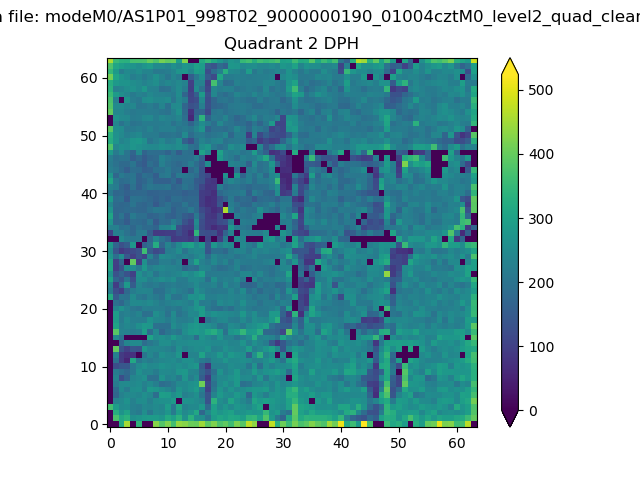 |
Quadrant C |
| Plot type | Count rate plots | Images |
|---|---|---|
| Comparison with Poisson distribution Blue bars denote a histogram of data divided into 1 sec bins. Red curve is a Poisson curve with rate = median count rate of data. |
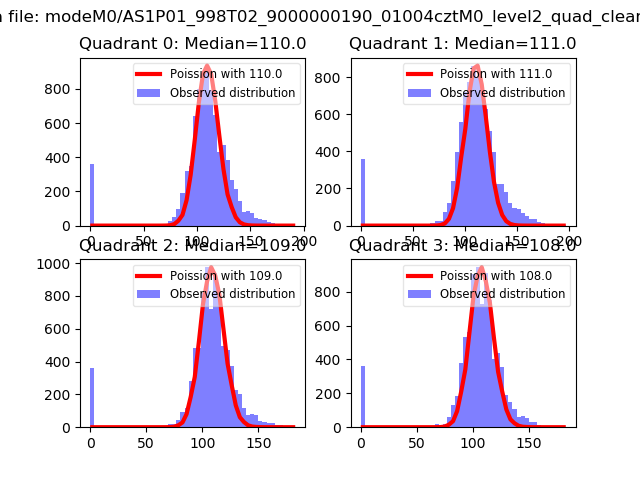 |
 |
| Quadrant-wise count rates Data is divided into 100 sec bins |
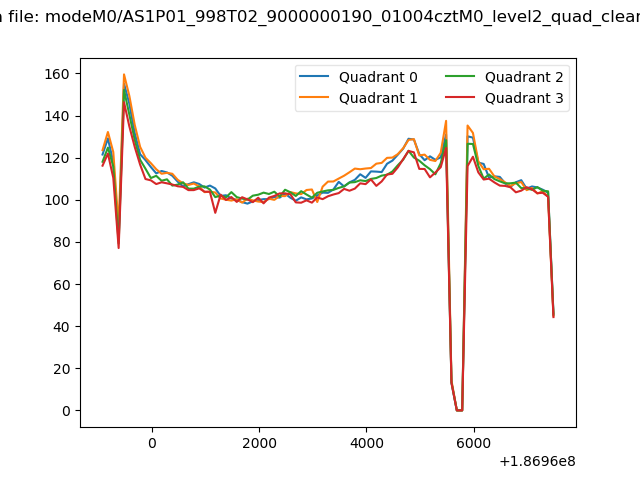 |
|
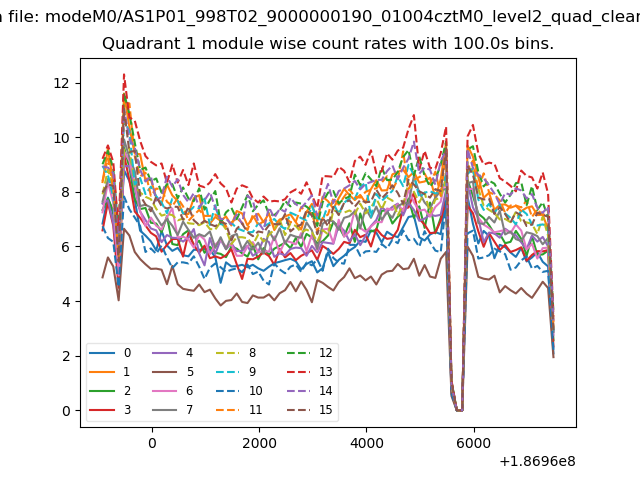
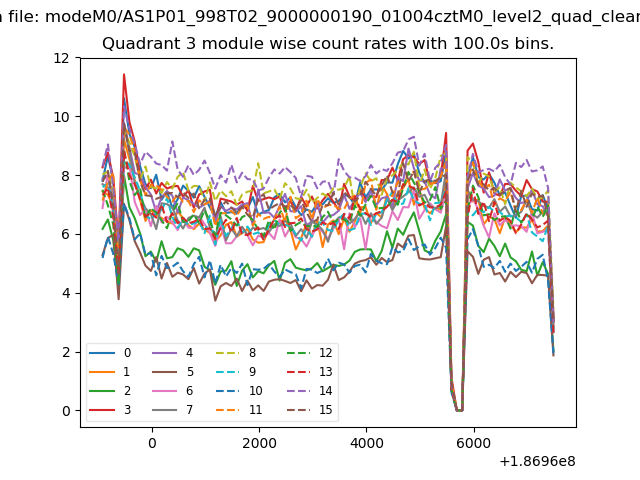
| Module-wise count rates for Quadrant A Data is divided into 100 sec bins |
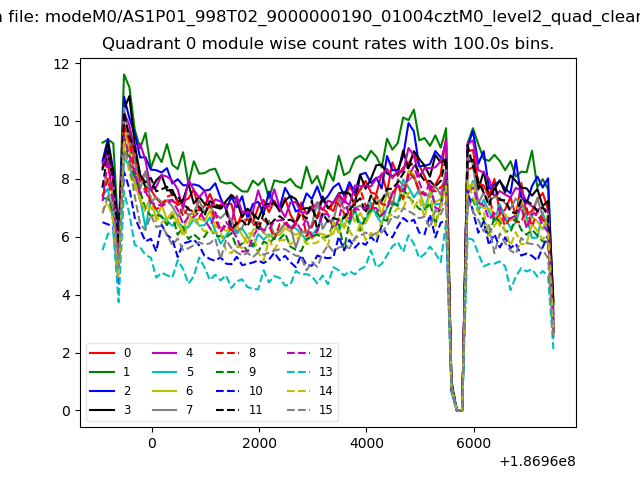 |
 |
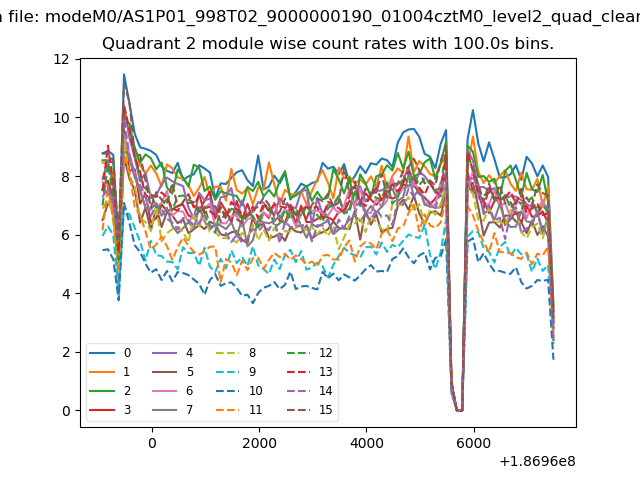
| Module-wise count rates for Quadrant B Data is divided into 100 sec bins |
 |
 |
| Module-wise count rates for Quadrant C Data is divided into 100 sec bins |
 |
 |
| Module-wise count rates for Quadrant D Data is divided into 100 sec bins |
 |
 |
| Parameter | Plot |
|---|---|
| CZT HV Monitor | 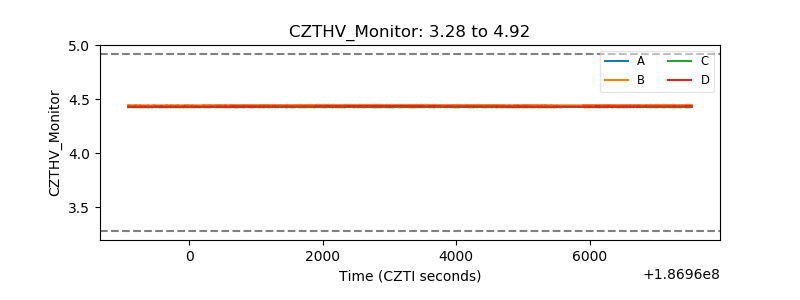 |
| D_VDD | 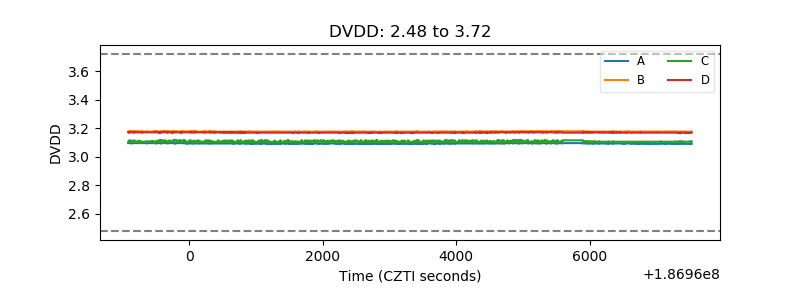 |
| Temperature 1 |  |
| Veto HV Monitor | 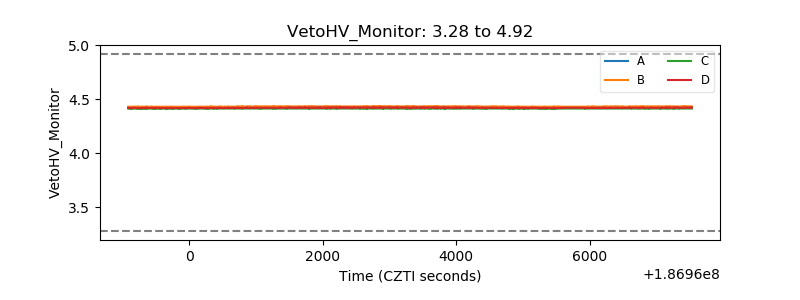 |
| Veto LLD | 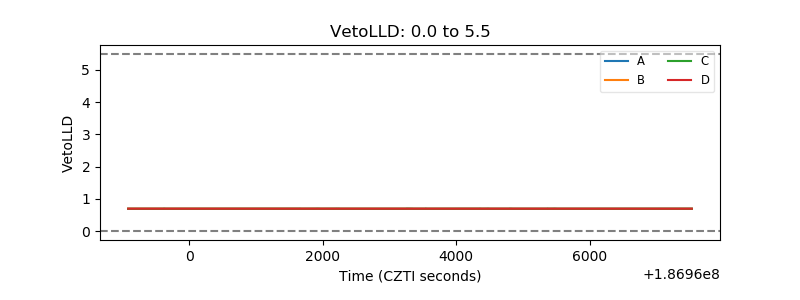 |
| Alpha Counter | 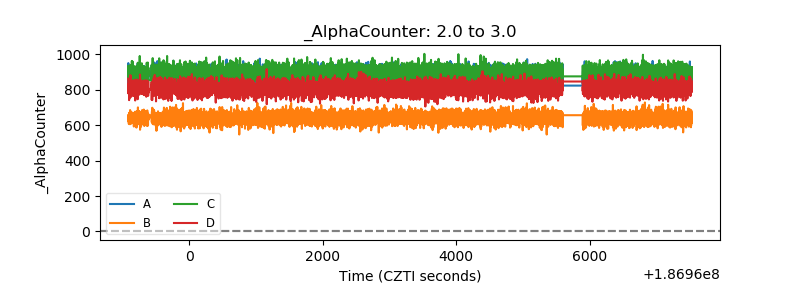 |
| _CPM_Rate | 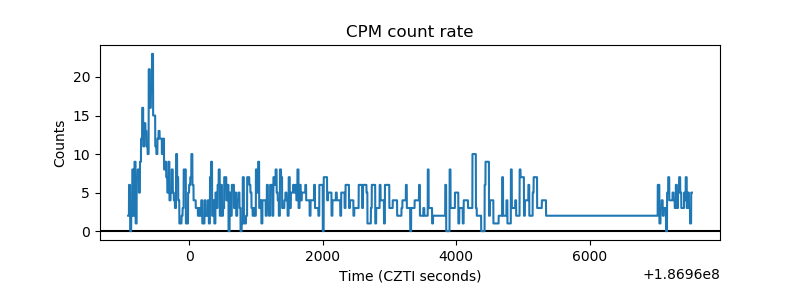 |
| CZT Counter | 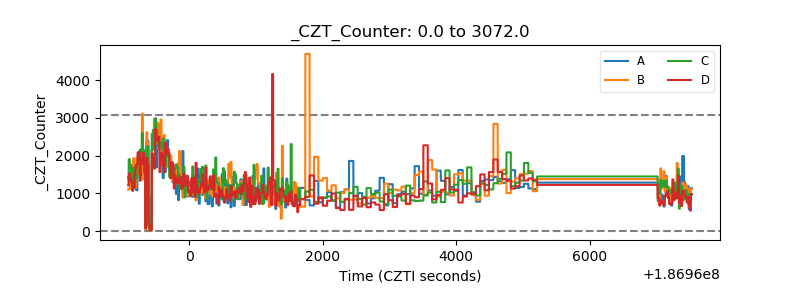 |
| +2.5 Volts monitor |  |
| +5 Volts monitor | 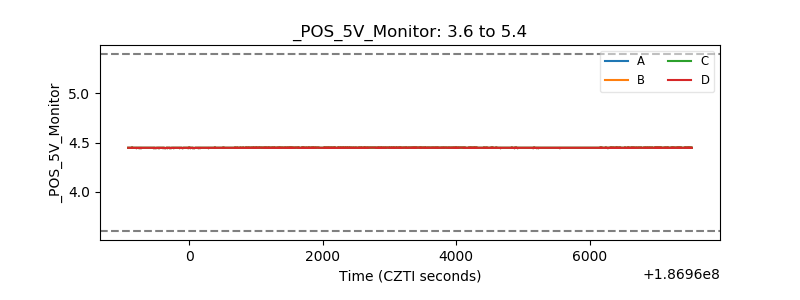 |
| _ROLL_ROT | 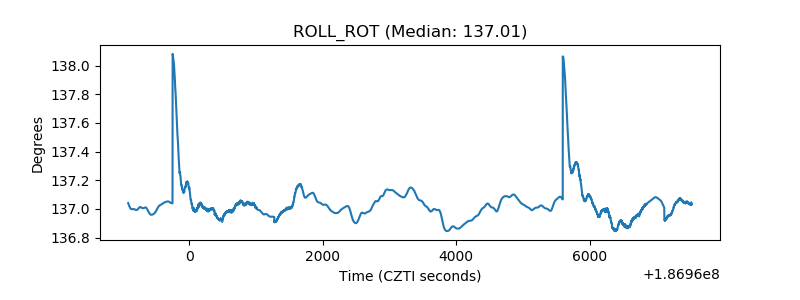 |
| _Roll_DEC | 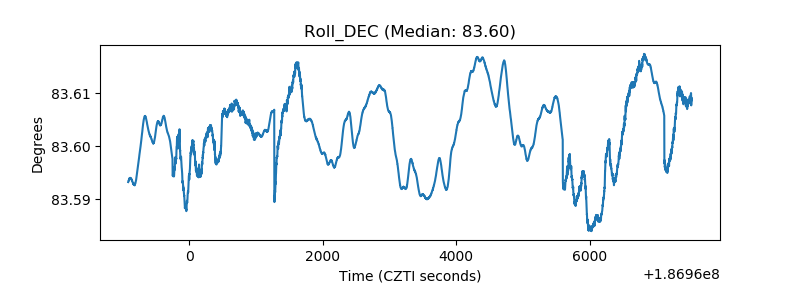 |
| _Roll_RA | 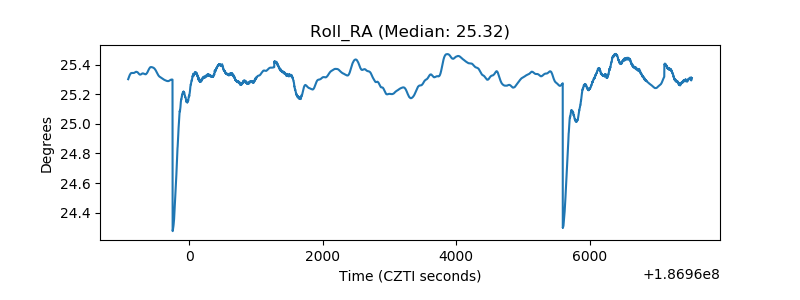 |
| Veto Counter | 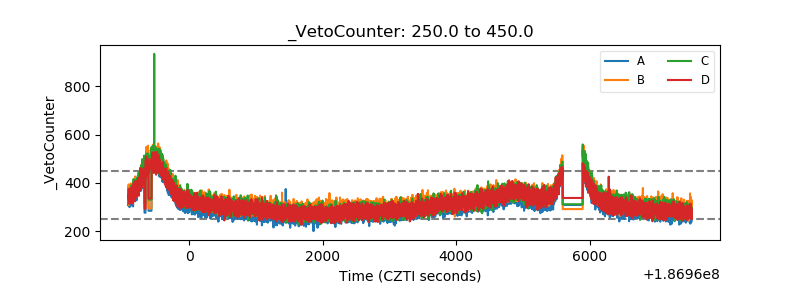 |