| Param | Original file | Final file |
|---|---|---|
| Filename | modeM0/AS1P01_998T02_9000000190_01005cztM0_level2.evt | modeM0/AS1P01_998T02_9000000190_01005cztM0_level2_quad_clean.evt |
| Size (bytes) | 1,155,539,520 | 124,151,040 |
| Size | 1.1 GB | 118.4 MB |
| Events in quadrant A | 8,583,990 | 815,145 |
| Events in quadrant B | 9,113,695 | 823,992 |
| Events in quadrant C | 8,854,978 | 809,440 |
| Events in quadrant D | 7,949,085 | 793,592 |
| Mode M0 | |||
|---|---|---|---|
| Quadrant | BADHDUFLAG | Total packets | Discarded packets |
| A | 0 | 30808 | 1 |
| B | 0 | 32364 | 1 |
| C | 0 | 31572 | 1 |
| D | 0 | 28972 | 1 |
| Mode SS | |||
|---|---|---|---|
| Quadrant | BADHDUFLAG | Total packets | Discarded packets |
| A | 0 | 150 | 0 |
| B | 0 | 150 | 0 |
| C | 0 | 150 | 0 |
| D | 0 | 150 | 0 |
| Mode M9 | |||
|---|---|---|---|
| Quadrant | BADHDUFLAG | Total packets | Discarded packets |
| A | 0 | 4 | 0 |
| B | 0 | 4 | 0 |
| C | 0 | 4 | 0 |
| D | 0 | 4 | 0 |
| Quadrant | Total seconds | Saturated seconds | Saturation percentage |
|---|---|---|---|
| A | 7449 | 7 | 0.093972% |
| B | 7449 | 14 | 0.187945% |
| C | 7449 | 10 | 0.134246% |
| D | 7449 | 17 | 0.228219% |
Noise dominated data is calculated using 1-second bins in cleaned event files. If a bin has >2000 counts, and if more than 50% of those come from <1% of pixels, then it is considered to be noise-dominated and hence unusable.
| Quadrant | # 1 sec bins | Bins with >0 counts | Bins with >2000 counts | High rate bins dominated by noise | Noise dominated (total time) | Noise dominated (detector-on time) | Marked lightcurve |
|---|---|---|---|---|---|---|---|
| A | 7854 | 7450 | 196 | 196 | 2.50% | 2.63% | 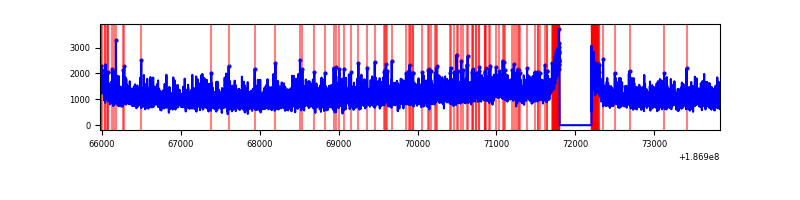 |
| B | 7854 | 7450 | 254 | 254 | 3.23% | 3.41% | 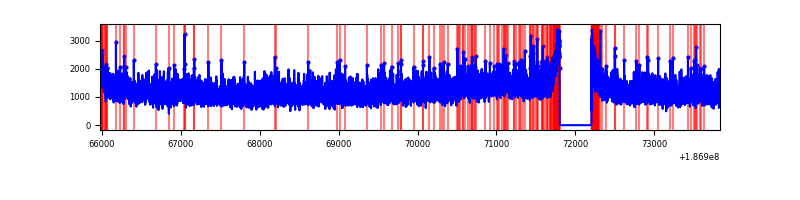 |
| C | 7854 | 7450 | 213 | 213 | 2.71% | 2.86% |  |
| D | 7854 | 7450 | 166 | 166 | 2.11% | 2.23% | 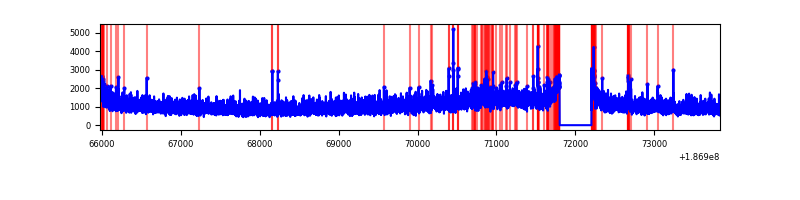 |
Top three noisy pixels from each quadrant. If the there are fewer than three noisy pixels in the level2.evt file, extra rows are filled as -1
| Pixel properties | Quadrant properties | ||||||
|---|---|---|---|---|---|---|---|
| Quadrant | DetID | PixID | Counts | Sigma | Mean | Median | Sigma |
| A | 15 | 233 | 13542 | 21.02 | 2234 | 2250 | 537.2 |
| A | 11 | 79 | 9157 | 12.86 | 2234 | 2250 | 537.2 |
| A | 3 | 111 | 7077 | 8.98 | 2234 | 2250 | 537.2 |
| B | 15 | 22 | 43069 | 72.64 | 2357 | 2363 | 560.4 |
| B | 5 | 200 | 34073 | 56.59 | 2357 | 2363 | 560.4 |
| B | 5 | 249 | 24372 | 39.28 | 2357 | 2363 | 560.4 |
| C | 15 | 241 | 367382 | 604.59 | 2154 | 2228 | 604.0 |
| C | 3 | 111 | 29405 | 45.0 | 2154 | 2228 | 604.0 |
| C | 3 | 79 | 25628 | 38.74 | 2154 | 2228 | 604.0 |
| D | 1 | 4 | 163209 | 254.42 | 2048 | 2120 | 633.2 |
| D | 2 | 107 | 58591 | 89.19 | 2048 | 2120 | 633.2 |
| D | 9 | 49 | 34285 | 50.8 | 2048 | 2120 | 633.2 |
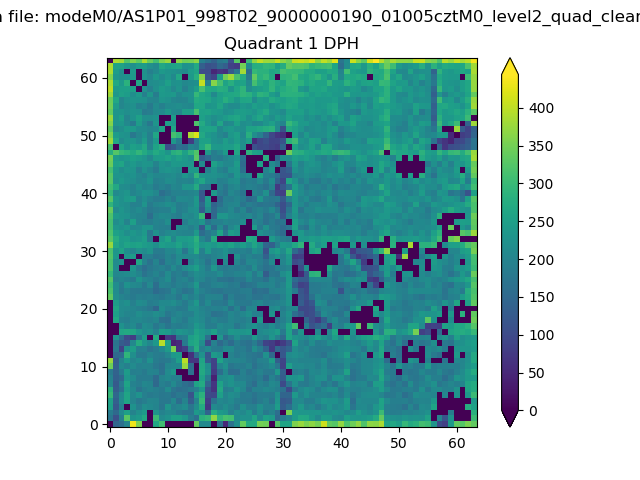
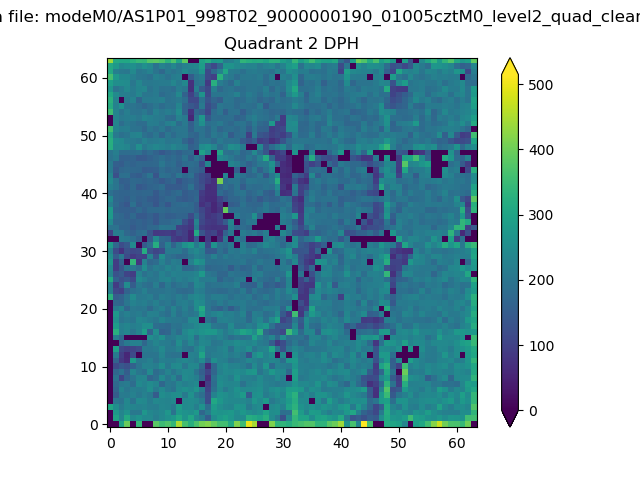
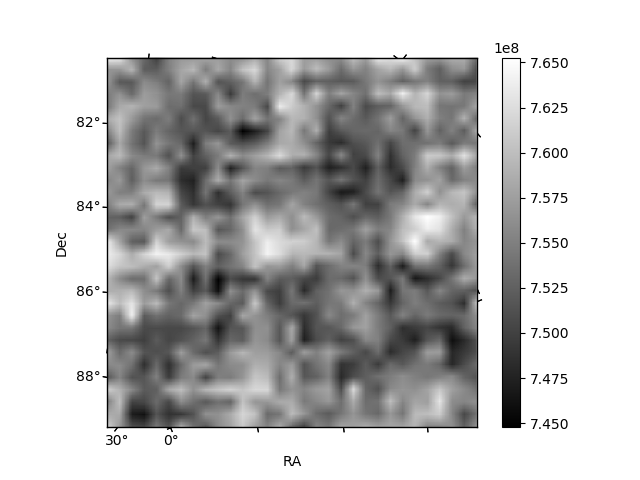
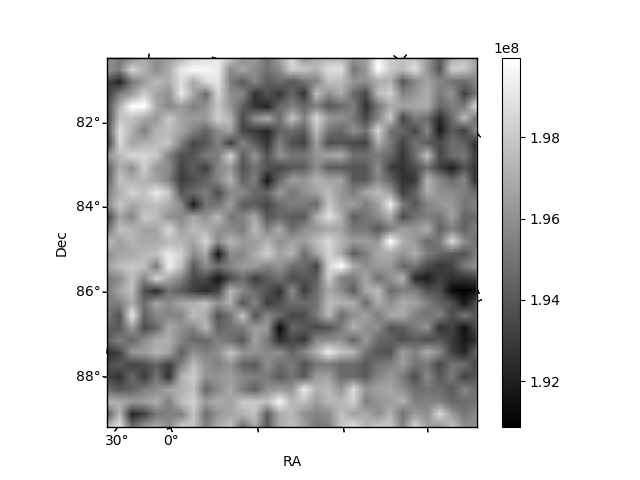
Histogram calculated using DETX and DETY for each event in the final _common_clean file
| Quadrant A | 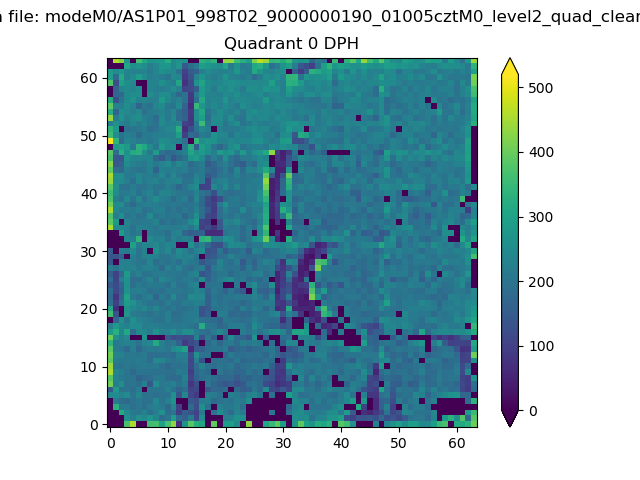 |
 |
Quadrant B |
|---|---|---|---|
| Quadrant D | 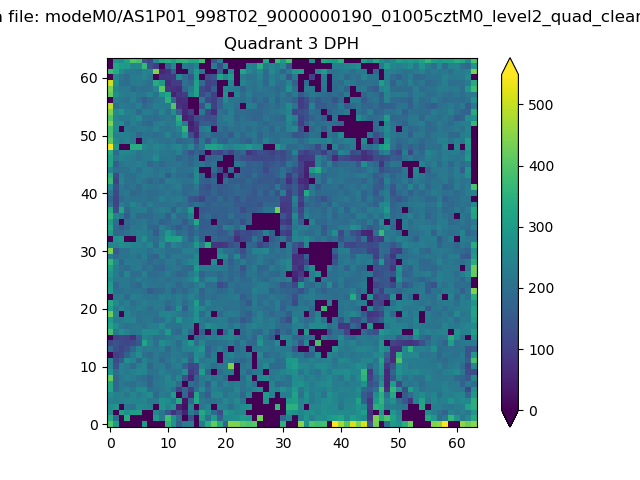 |
 |
Quadrant C |
| Plot type | Count rate plots | Images |
|---|---|---|
| Comparison with Poisson distribution Blue bars denote a histogram of data divided into 1 sec bins. Red curve is a Poisson curve with rate = median count rate of data. |
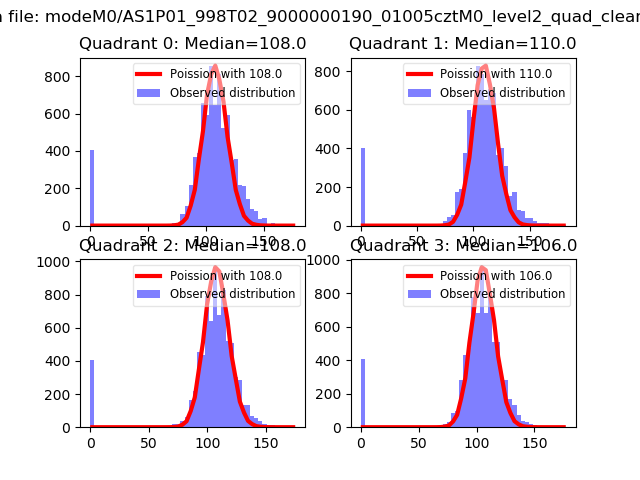 |
 |
| Quadrant-wise count rates Data is divided into 100 sec bins |
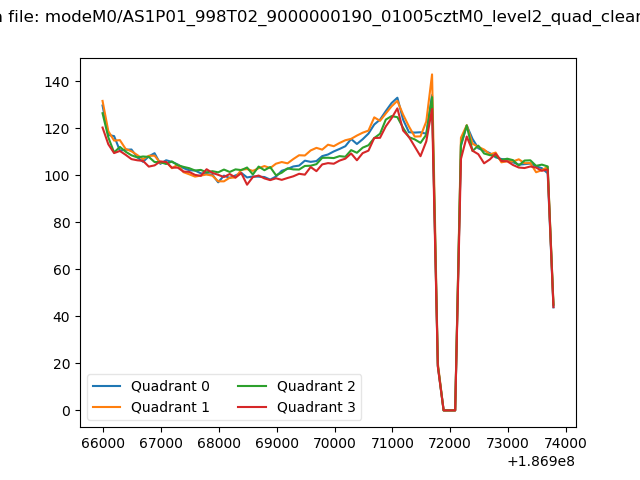 |
|
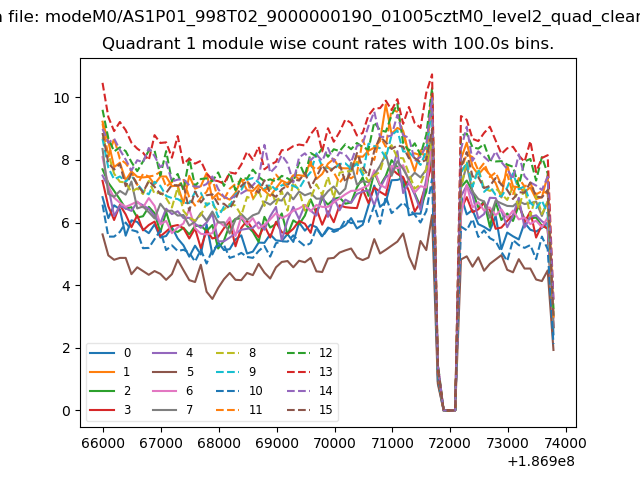
| Module-wise count rates for Quadrant A Data is divided into 100 sec bins |
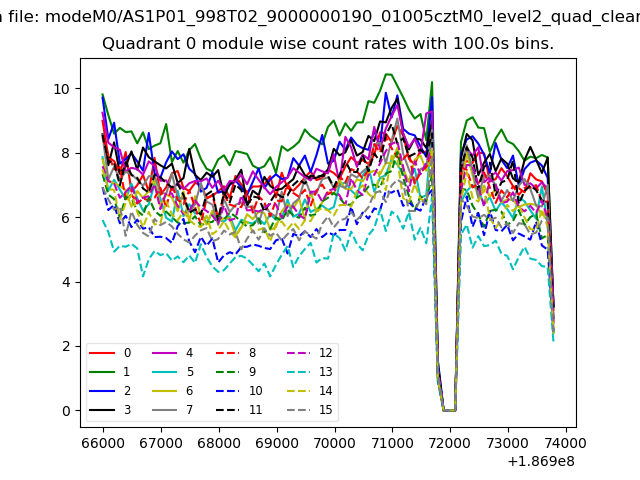 |
 |
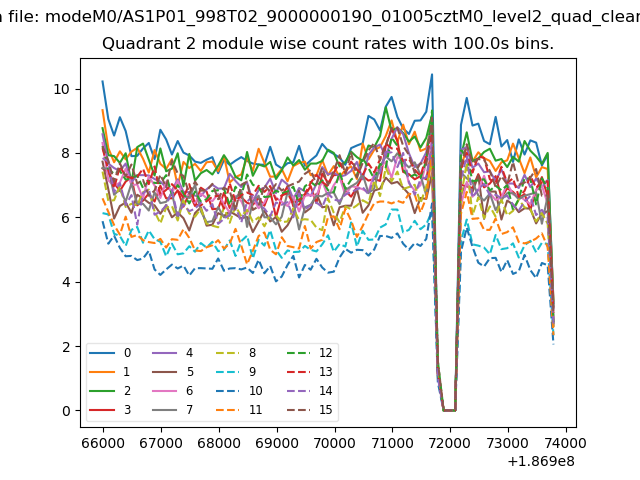
| Module-wise count rates for Quadrant B Data is divided into 100 sec bins |
 |
 |
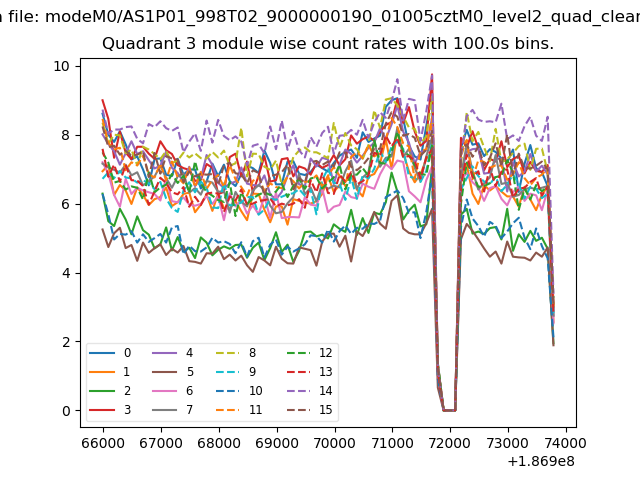
| Module-wise count rates for Quadrant C Data is divided into 100 sec bins |
 |
 |
| Module-wise count rates for Quadrant D Data is divided into 100 sec bins |
 |
 |
| Parameter | Plot |
|---|---|
| CZT HV Monitor | 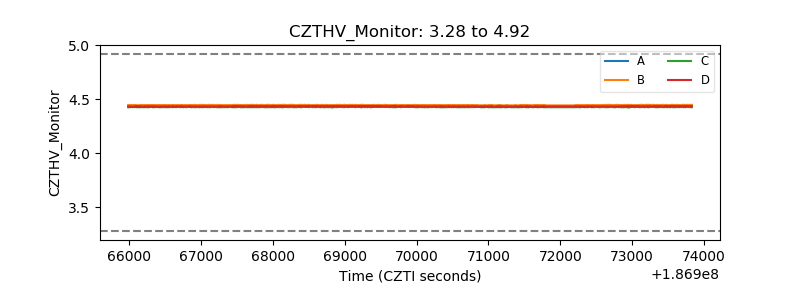 |
| D_VDD | 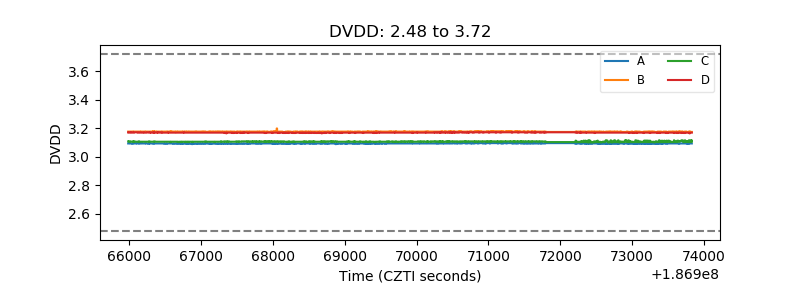 |
| Temperature 1 | 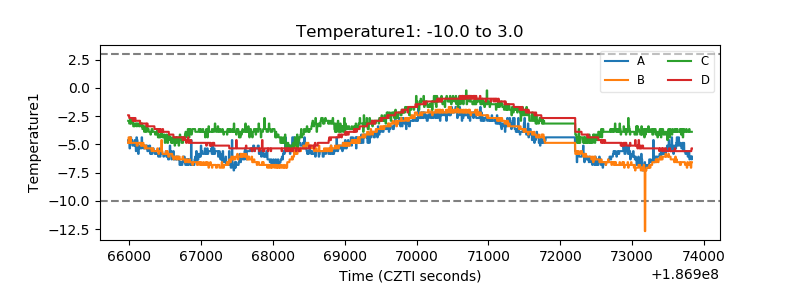 |
| Veto HV Monitor | 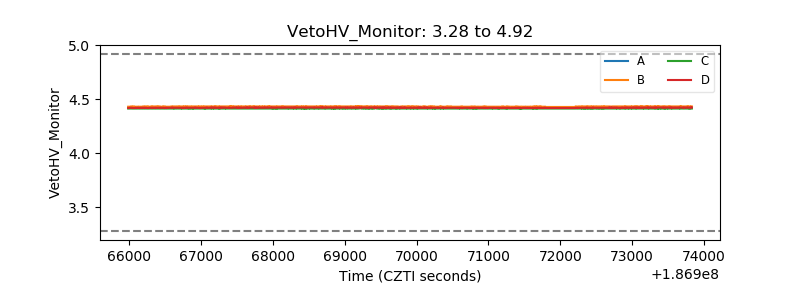 |
| Veto LLD | 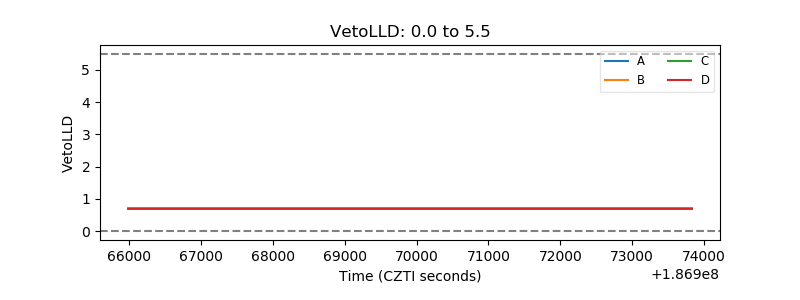 |
| Alpha Counter | 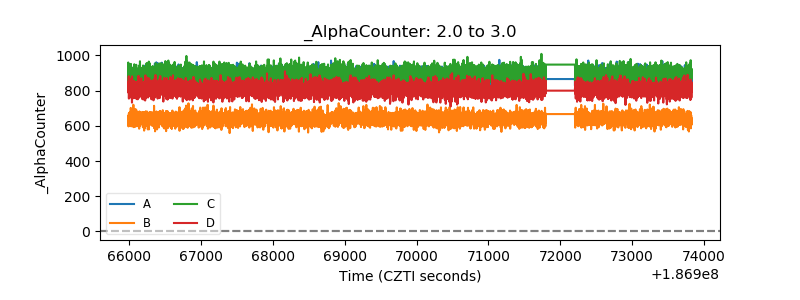 |
| _CPM_Rate | 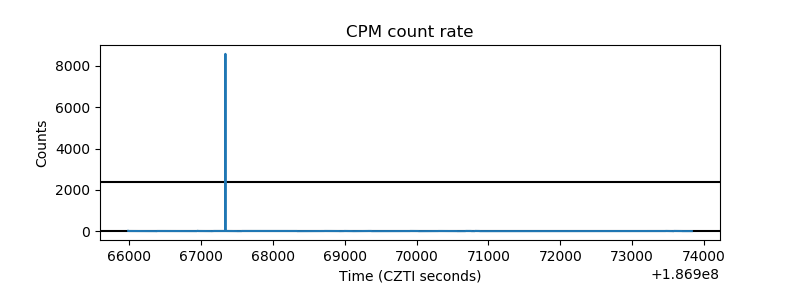 |
| CZT Counter | 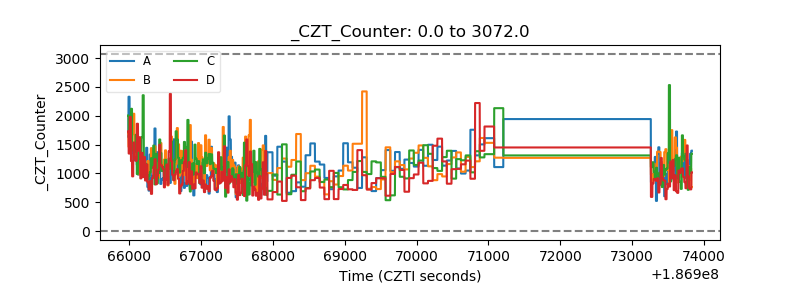 |
| +2.5 Volts monitor |  |
| +5 Volts monitor |  |
| _ROLL_ROT | 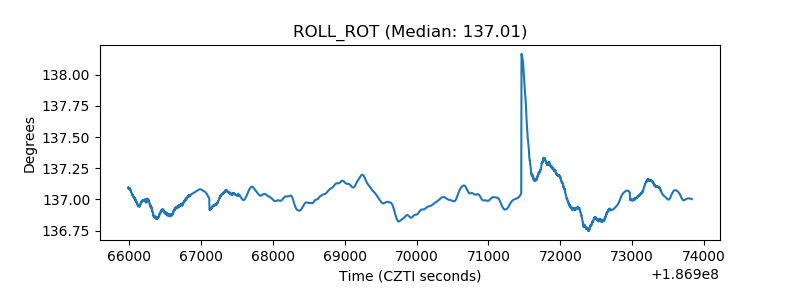 |
| _Roll_DEC | 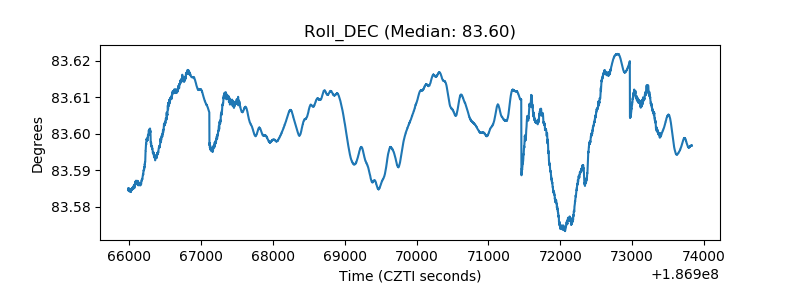 |
| _Roll_RA | 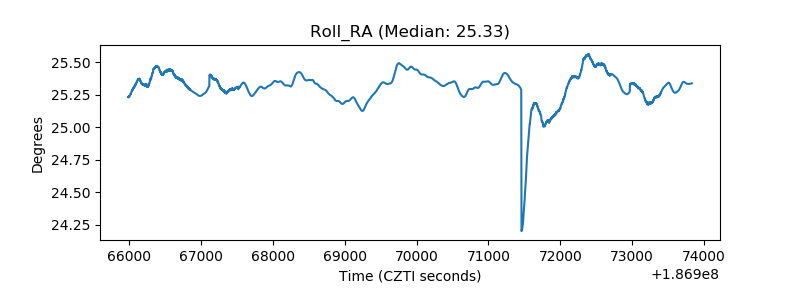 |
| Veto Counter | 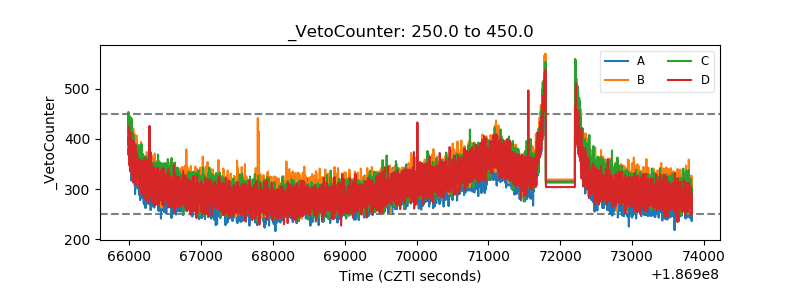 |